
|
|||||
|
 | |
| |
| |
| |
| |
| |
|
Gene: HIVEP3 |
Gene summary for HIVEP3 |
| Gene information | Species | Human | Gene symbol | HIVEP3 | Gene ID | 59269 |
| Gene name | HIVEP zinc finger 3 | |
| Gene Alias | KBP-1 | |
| Cytomap | 1p34.2 | |
| Gene Type | protein-coding | GO ID | GO:0006139 | UniProtAcc | Q5T1R4 |
Top |
Malignant transformation analysis |
| Identification of the aberrant gene expression in precancerous and cancerous lesions by comparing the gene expression of stem-like cells in diseased tissues with normal stem cells |
| Entrez ID | Symbol | Replicates | Species | Organ | Tissue | Adj P-value | Log2FC | Malignancy |
| 59269 | HIVEP3 | CCI_1 | Human | Cervix | CC | 2.53e-05 | 6.84e-01 | 0.528 |
| 59269 | HIVEP3 | CCI_3 | Human | Cervix | CC | 2.02e-14 | 8.87e-01 | 0.516 |
| 59269 | HIVEP3 | CCII_1 | Human | Cervix | CC | 1.13e-02 | 2.04e-01 | 0.3249 |
| 59269 | HIVEP3 | LZE8T | Human | Esophagus | ESCC | 3.59e-04 | 2.32e-01 | 0.067 |
| 59269 | HIVEP3 | P1T-E | Human | Esophagus | ESCC | 1.20e-04 | 3.39e-01 | 0.0875 |
| 59269 | HIVEP3 | P2T-E | Human | Esophagus | ESCC | 3.05e-07 | 1.06e-01 | 0.1177 |
| 59269 | HIVEP3 | P8T-E | Human | Esophagus | ESCC | 4.15e-03 | 1.40e-01 | 0.0889 |
| 59269 | HIVEP3 | P10T-E | Human | Esophagus | ESCC | 9.62e-06 | 3.45e-02 | 0.116 |
| 59269 | HIVEP3 | P12T-E | Human | Esophagus | ESCC | 3.00e-06 | 7.81e-02 | 0.1122 |
| 59269 | HIVEP3 | P15T-E | Human | Esophagus | ESCC | 1.00e-02 | 1.09e-01 | 0.1149 |
| 59269 | HIVEP3 | P16T-E | Human | Esophagus | ESCC | 4.93e-12 | 4.27e-01 | 0.1153 |
| 59269 | HIVEP3 | P20T-E | Human | Esophagus | ESCC | 2.26e-04 | 1.89e-01 | 0.1124 |
| 59269 | HIVEP3 | P21T-E | Human | Esophagus | ESCC | 3.73e-07 | 2.18e-01 | 0.1617 |
| 59269 | HIVEP3 | P23T-E | Human | Esophagus | ESCC | 2.10e-08 | 1.13e-01 | 0.108 |
| 59269 | HIVEP3 | P26T-E | Human | Esophagus | ESCC | 2.85e-10 | 6.09e-02 | 0.1276 |
| 59269 | HIVEP3 | P27T-E | Human | Esophagus | ESCC | 1.70e-15 | 8.90e-02 | 0.1055 |
| 59269 | HIVEP3 | P30T-E | Human | Esophagus | ESCC | 1.50e-04 | 1.32e-01 | 0.137 |
| 59269 | HIVEP3 | P31T-E | Human | Esophagus | ESCC | 3.32e-03 | 1.97e-01 | 0.1251 |
| 59269 | HIVEP3 | P32T-E | Human | Esophagus | ESCC | 1.53e-11 | 1.67e-01 | 0.1666 |
| 59269 | HIVEP3 | P36T-E | Human | Esophagus | ESCC | 1.10e-05 | 1.74e-01 | 0.1187 |
| Page: 1 2 3 4 5 |
| Tissue | Expression Dynamics | Abbreviation |
| Cervix | 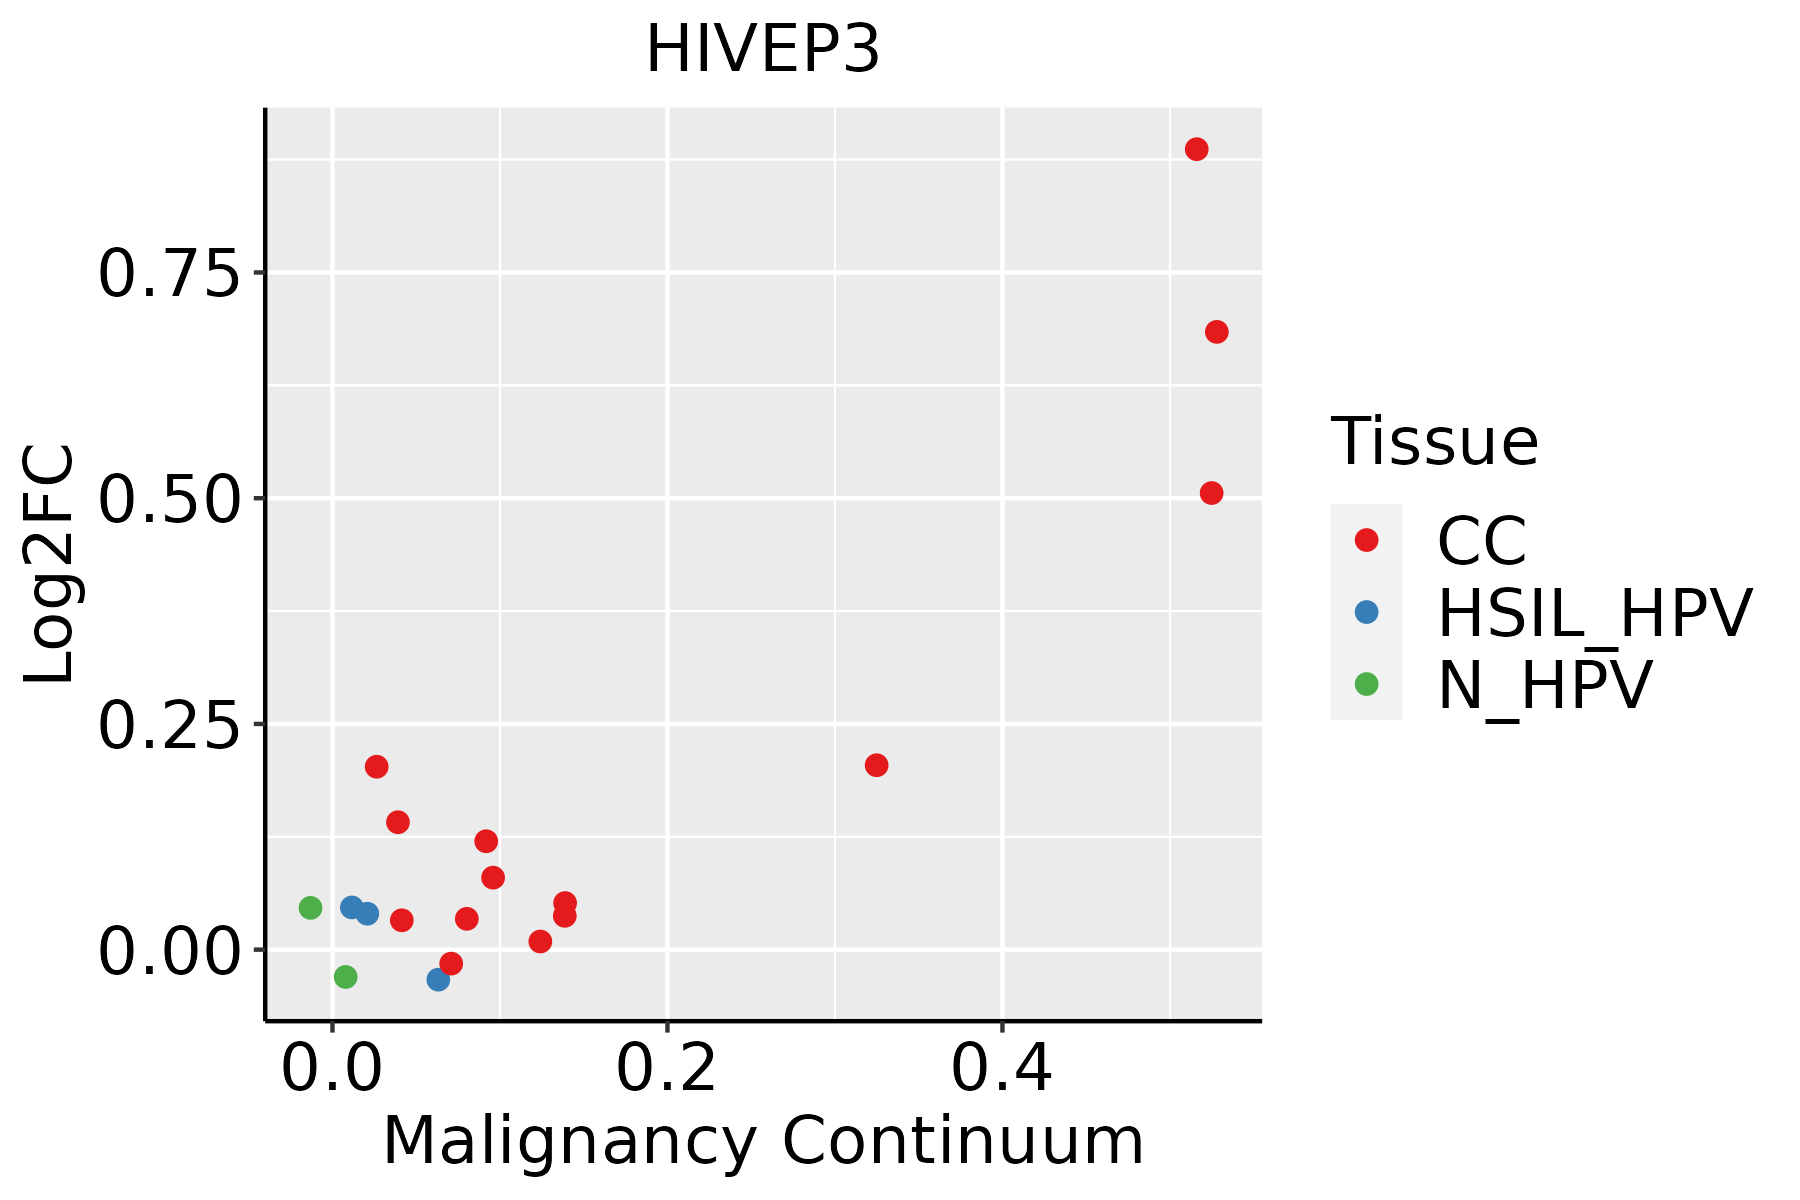 | CC: Cervix cancer |
| HSIL_HPV: HPV-infected high-grade squamous intraepithelial lesions | ||
| N_HPV: HPV-infected normal cervix | ||
| Esophagus | 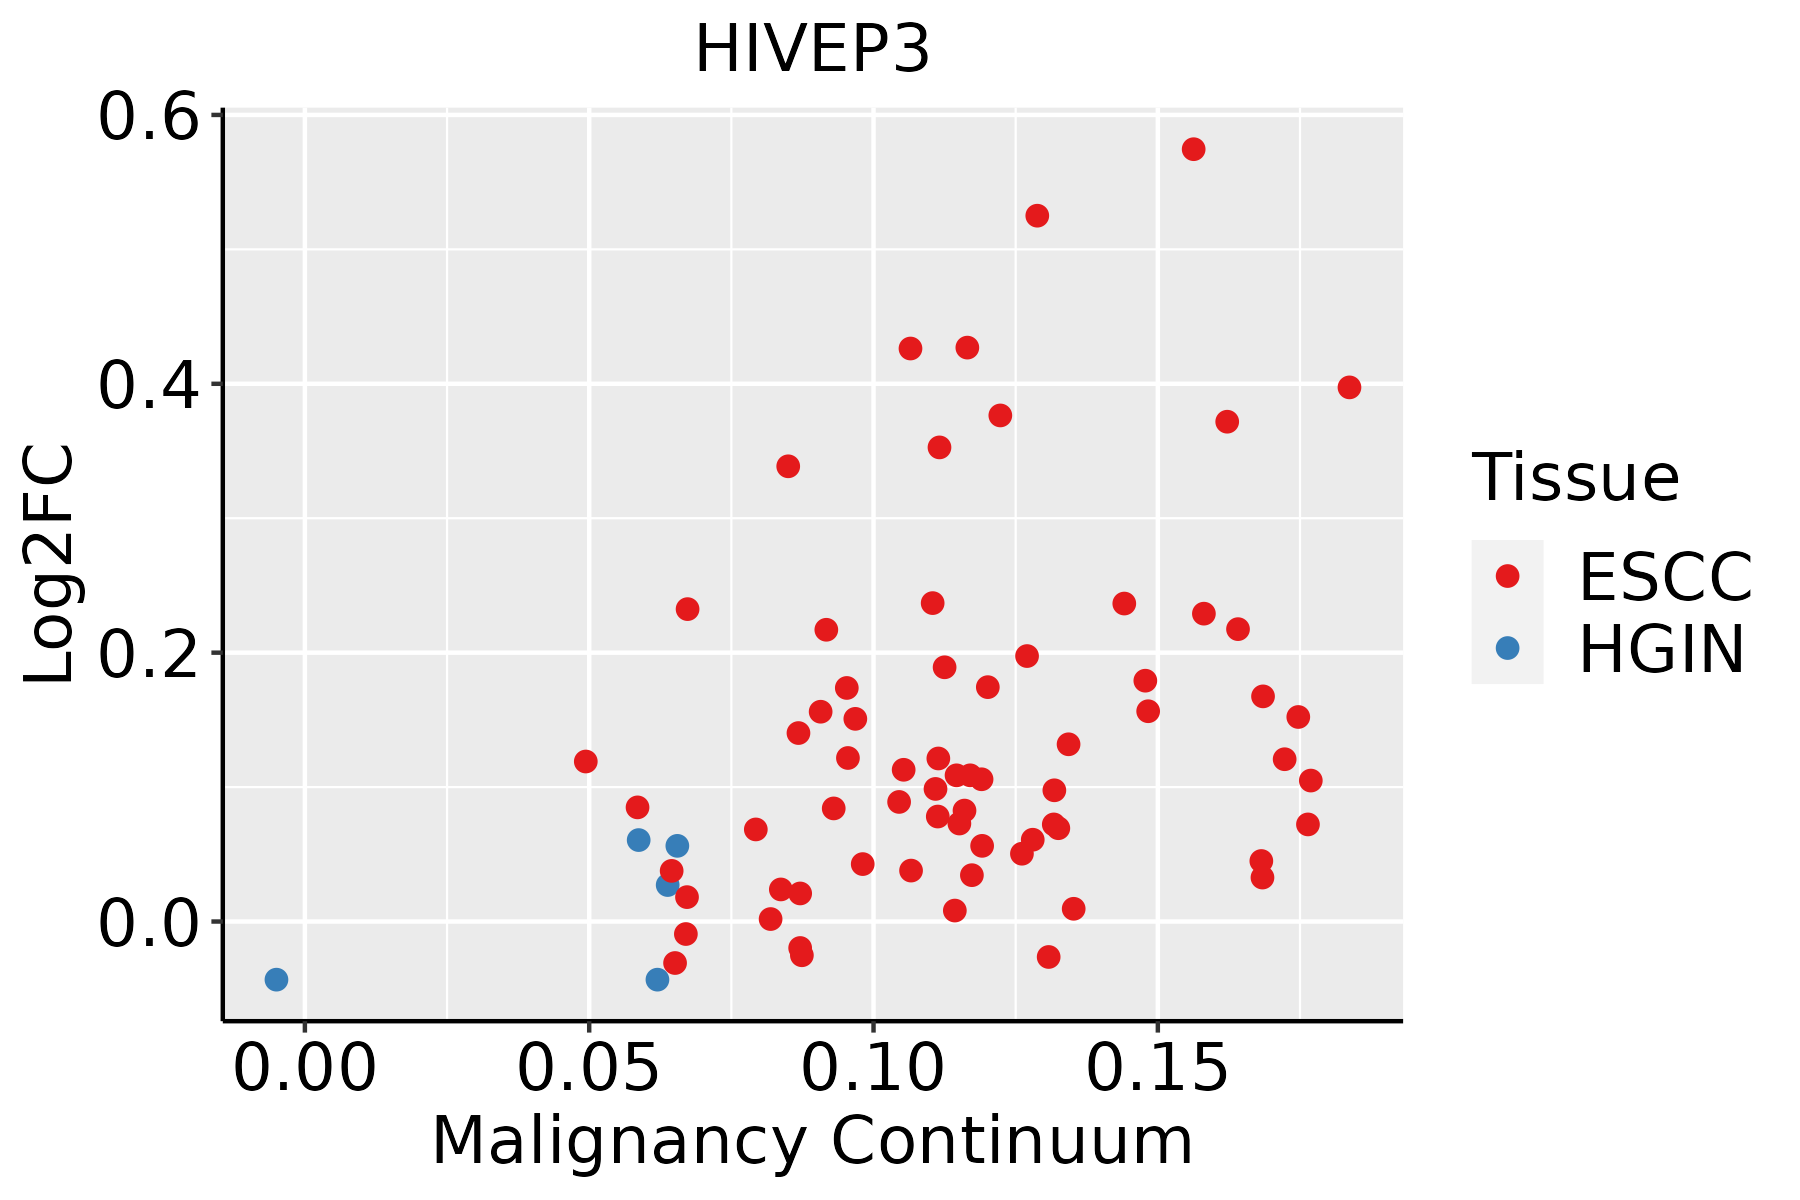 | ESCC: Esophageal squamous cell carcinoma |
| HGIN: High-grade intraepithelial neoplasias | ||
| LGIN: Low-grade intraepithelial neoplasias | ||
| Lung |  | AAH: Atypical adenomatous hyperplasia |
| AIS: Adenocarcinoma in situ | ||
| IAC: Invasive lung adenocarcinoma | ||
| MIA: Minimally invasive adenocarcinoma | ||
| Oral Cavity | 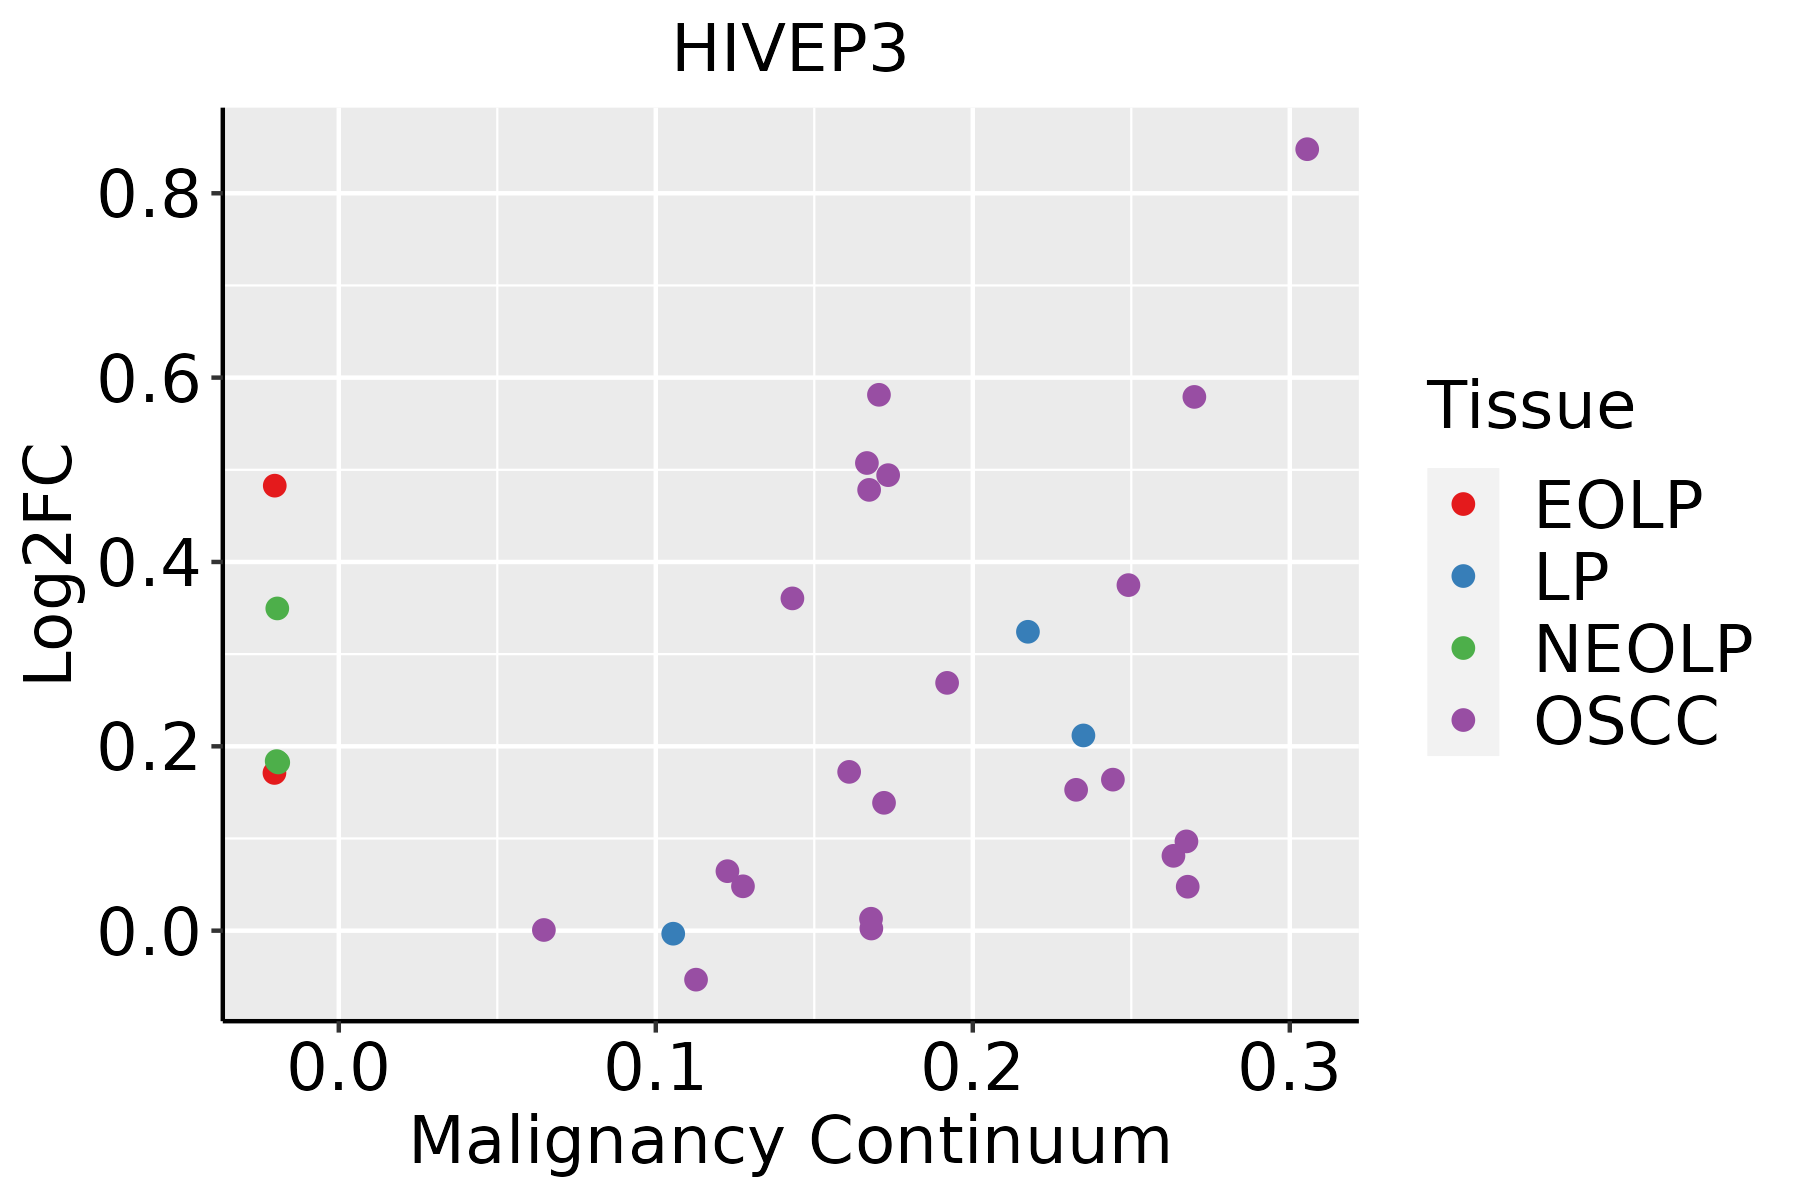 | EOLP: Erosive Oral lichen planus |
| LP: leukoplakia | ||
| NEOLP: Non-erosive oral lichen planus | ||
| OSCC: Oral squamous cell carcinoma | ||
| Prostate | 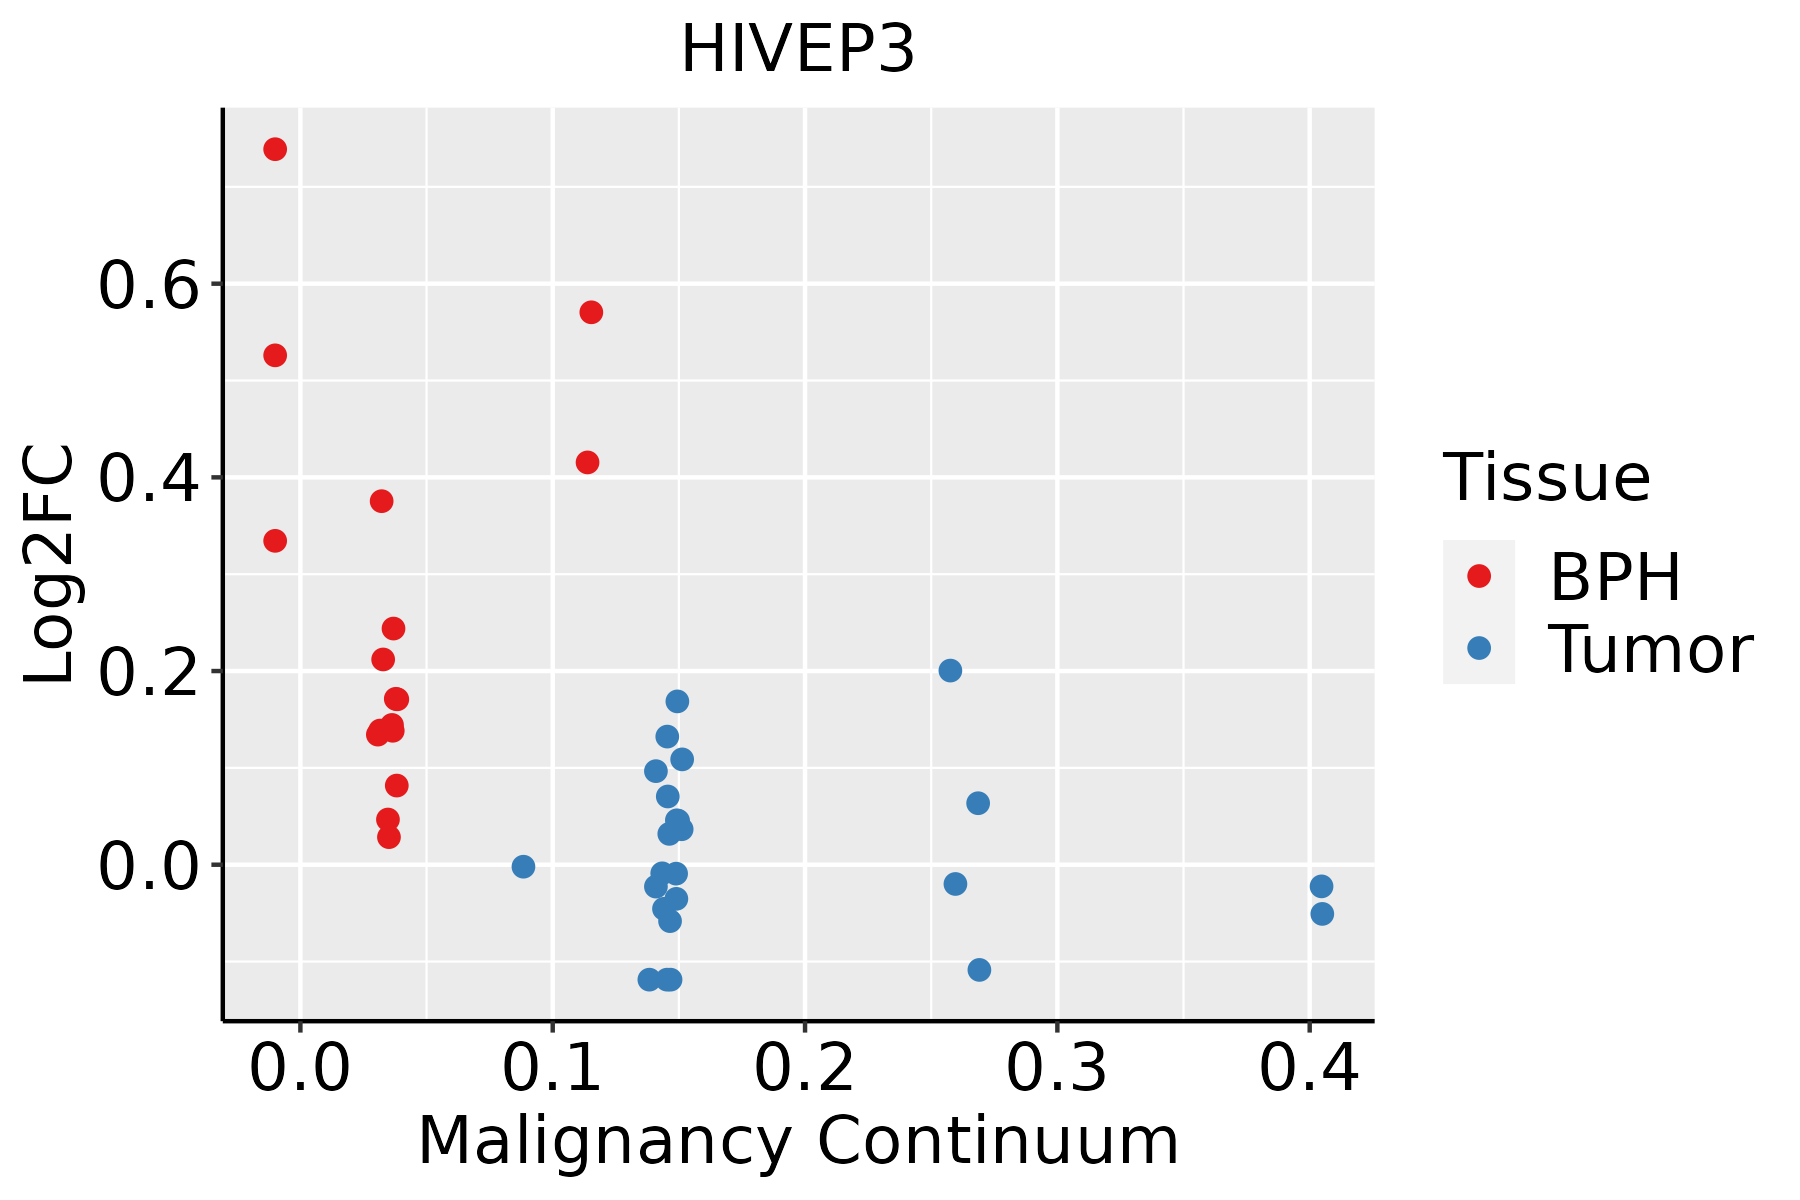 | BPH: Benign Prostatic Hyperplasia |
| Skin |  | AK: Actinic keratosis |
| cSCC: Cutaneous squamous cell carcinoma | ||
| SCCIS:squamous cell carcinoma in situ |
| ∗log2FC in expression of this searched gene in stem-like cells from each diseased tissue sample relative to stem-like cells in normal samples in each tissue plotted against the malignancy continuum. Samples are colored based on if they are from different disease stage. |
Top |
Malignant transformation related pathway analysis |
| Find out the enriched GO biological processes and KEGG pathways involved in transition from healthy to precancer to cancer |
| Tissue | Disease Stage | Enriched GO biological Processes |
| Colorectum | AD |  |
| Colorectum | SER |  |
| Colorectum | MSS |  |
| Colorectum | MSI-H |  |
| Colorectum | FAP |  |
| ∗Top 15 enriched GO BP terms are showed in the bar plot of each disease state in each tissue. Each row represents a significant GO biological process which is colored according to the -log10(p.adjust). |
| Page: 1 2 3 4 5 6 7 8 9 |
| GO ID | Tissue | Disease Stage | Description | Gene Ratio | Bg Ratio | pvalue | p.adjust | Count |
| GO:00605385 | Skin | AK | skeletal muscle organ development | 27/1910 | 166/18723 | 9.93e-03 | 4.80e-02 | 27 |
| GO:006053717 | Skin | SCCIS | muscle tissue development | 43/919 | 403/18723 | 1.50e-06 | 8.89e-05 | 43 |
| GO:001470616 | Skin | SCCIS | striated muscle tissue development | 38/919 | 384/18723 | 3.33e-05 | 8.88e-04 | 38 |
| GO:000751715 | Skin | SCCIS | muscle organ development | 28/919 | 327/18723 | 3.12e-03 | 2.83e-02 | 28 |
| Page: 1 2 3 |
| Pathway ID | Tissue | Disease Stage | Description | Gene Ratio | Bg Ratio | pvalue | p.adjust | qvalue | Count |
| Page: 1 |
Top |
Cell-cell communication analysis |
| Identification of potential cell-cell interactions between two cell types and their ligand-receptor pairs for different disease states |
| Ligand | Receptor | LRpair | Pathway | Tissue | Disease Stage |
| Page: 1 |
Top |
Single-cell gene regulatory network inference analysis |
| Find out the significant the regulons (TFs) and the target genes of each regulon across cell types for different disease states |
| TF | Cell Type | Tissue | Disease Stage | Target Gene | RSS | Regulon Activity |
| HIVEP3 | IMGOB | Colorectum | ADJ | GRAMD1B,ABCA5,LINC00278, etc. | 9.63e-02 |  |
| HIVEP3 | IMENT | Colorectum | CRC | GRAMD1B,ABCA5,LINC00278, etc. | 6.57e-02 |  |
| HIVEP3 | GOB | Colorectum | CRC | GRAMD1B,ABCA5,LINC00278, etc. | 4.11e-02 | |
| HIVEP3 | PLA | Endometrium | Healthy | TAF4B,POLR3C,PARD6B, etc. | 0.00e+00 |  |
| HIVEP3 | CD8TEXINT | Endometrium | Healthy | TAF4B,POLR3C,PARD6B, etc. | 0.00e+00 | |
| HIVEP3 | NK | Lung | IAC | AP005482.1,SLC16A1-AS1,AC243829.2, etc. | 4.35e-02 |  |
| HIVEP3 | MEGA | Pancreas | PDAC | ARL8B,AC026202.2,DCBLD2, etc. | 5.47e-05 |  |
| HIVEP3 | MSC | Pancreas | PDAC | ARL8B,AC026202.2,DCBLD2, etc. | 1.30e-01 | |
| HIVEP3 | LYMEND | Pancreas | PDAC | ARL8B,AC026202.2,DCBLD2, etc. | 0.00e+00 | |
| HIVEP3 | APCAF | Pancreas | PDAC | ARL8B,AC026202.2,DCBLD2, etc. | 2.70e-04 | |
| ∗The dot plots of a searched regulon are shown for all cell subpopulations in each disease state of each tissue based on the regulon specific score inferred using pySCENIC and by calculating the average expression. |
| Page: 1 2 3 |
Top |
Somatic mutation of malignant transformation related genes |
| Annotation of somatic variants for genes involved in malignant transformation |
| Hugo Symbol | Variant Class | Variant Classification | dbSNP RS | HGVSc | HGVSp | HGVSp Short | SWISSPROT | BIOTYPE | SIFT | PolyPhen | Tumor Sample Barcode | Tissue | Histology | Sex | Age | Stage | Therapy Types | Drugs | Outcome |
| HIVEP3 | SNV | Missense_Mutation | rs751390922 | c.1754N>A | p.Arg585Gln | p.R585Q | Q5T1R4 | protein_coding | deleterious(0) | probably_damaging(0.992) | TCGA-A2-A0YM-01 | Breast | breast invasive carcinoma | Female | >=65 | I/II | Unknown | Unknown | SD |
| HIVEP3 | SNV | Missense_Mutation | c.5599G>C | p.Glu1867Gln | p.E1867Q | Q5T1R4 | protein_coding | deleterious_low_confidence(0.02) | probably_damaging(0.965) | TCGA-AC-A23H-01 | Breast | breast invasive carcinoma | Female | >=65 | I/II | Unknown | Unknown | PD | |
| HIVEP3 | SNV | Missense_Mutation | c.3122G>C | p.Arg1041Thr | p.R1041T | Q5T1R4 | protein_coding | deleterious(0) | probably_damaging(0.941) | TCGA-AC-A23H-01 | Breast | breast invasive carcinoma | Female | >=65 | I/II | Unknown | Unknown | PD | |
| HIVEP3 | SNV | Missense_Mutation | c.2695G>C | p.Glu899Gln | p.E899Q | Q5T1R4 | protein_coding | deleterious(0) | probably_damaging(0.994) | TCGA-AC-A23H-01 | Breast | breast invasive carcinoma | Female | >=65 | I/II | Unknown | Unknown | PD | |
| HIVEP3 | SNV | Missense_Mutation | c.1879G>A | p.Glu627Lys | p.E627K | Q5T1R4 | protein_coding | tolerated(0.15) | benign(0.078) | TCGA-AC-A23H-01 | Breast | breast invasive carcinoma | Female | >=65 | I/II | Unknown | Unknown | PD | |
| HIVEP3 | SNV | Missense_Mutation | novel | c.6675C>A | p.Phe2225Leu | p.F2225L | Q5T1R4 | protein_coding | deleterious_low_confidence(0.01) | benign(0.056) | TCGA-AN-A046-01 | Breast | breast invasive carcinoma | Female | >=65 | I/II | Unknown | Unknown | SD |
| HIVEP3 | SNV | Missense_Mutation | rs560610413 | c.964G>A | p.Glu322Lys | p.E322K | Q5T1R4 | protein_coding | tolerated(0.05) | benign(0.122) | TCGA-AN-A046-01 | Breast | breast invasive carcinoma | Female | >=65 | I/II | Unknown | Unknown | SD |
| HIVEP3 | SNV | Missense_Mutation | c.3149N>T | p.Ser1050Phe | p.S1050F | Q5T1R4 | protein_coding | deleterious(0) | probably_damaging(0.996) | TCGA-AO-A03V-01 | Breast | breast invasive carcinoma | Female | <65 | I/II | Chemotherapy | fluorouracil | SD | |
| HIVEP3 | SNV | Missense_Mutation | c.4310N>T | p.Ser1437Ile | p.S1437I | Q5T1R4 | protein_coding | deleterious(0) | probably_damaging(0.998) | TCGA-AO-A0J6-01 | Breast | breast invasive carcinoma | Female | <65 | I/II | Chemotherapy | doxorubicin | SD | |
| HIVEP3 | SNV | Missense_Mutation | rs377282990 | c.6232N>A | p.Glu2078Lys | p.E2078K | Q5T1R4 | protein_coding | tolerated(0.57) | benign(0.073) | TCGA-B6-A0I8-01 | Breast | breast invasive carcinoma | Female | <65 | I/II | Unknown | Unknown | PD |
| Page: 1 2 3 4 5 6 7 8 9 10 11 12 13 14 15 16 17 18 19 20 21 22 23 24 25 |
Top |
Related drugs of malignant transformation related genes |
| Identification of chemicals and drugs interact with genes involved in malignant transfromation |
| (DGIdb 4.0) |
| Entrez ID | Symbol | Category | Interaction Types | Drug Claim Name | Drug Name | PMIDs |
| Page: 1 |

Copyright 2023-Present -The University of Texas Health Science Center at Houston |