
|
|||||
|
 | |
| |
| |
| |
| |
| |
|
Gene: HIP1R |
Gene summary for HIP1R |
| Gene information | Species | Human | Gene symbol | HIP1R | Gene ID | 9026 |
| Gene name | huntingtin interacting protein 1 related | |
| Gene Alias | HIP12 | |
| Cytomap | 12q24.31 | |
| Gene Type | protein-coding | GO ID | GO:0001696 | UniProtAcc | B3KQW8 |
Top |
Malignant transformation analysis |
| Identification of the aberrant gene expression in precancerous and cancerous lesions by comparing the gene expression of stem-like cells in diseased tissues with normal stem cells |
| Entrez ID | Symbol | Replicates | Species | Organ | Tissue | Adj P-value | Log2FC | Malignancy |
| 9026 | HIP1R | LZE5T | Human | Esophagus | ESCC | 7.82e-03 | 3.46e-01 | 0.0514 |
| 9026 | HIP1R | LZE7T | Human | Esophagus | ESCC | 4.47e-04 | 2.75e-01 | 0.0667 |
| 9026 | HIP1R | LZE20T | Human | Esophagus | ESCC | 3.71e-06 | 1.65e-01 | 0.0662 |
| 9026 | HIP1R | LZE24T | Human | Esophagus | ESCC | 2.89e-14 | 3.54e-01 | 0.0596 |
| 9026 | HIP1R | LZE21T | Human | Esophagus | ESCC | 1.13e-04 | 3.65e-01 | 0.0655 |
| 9026 | HIP1R | P1T-E | Human | Esophagus | ESCC | 2.93e-13 | 5.13e-01 | 0.0875 |
| 9026 | HIP1R | P2T-E | Human | Esophagus | ESCC | 5.73e-26 | 5.53e-01 | 0.1177 |
| 9026 | HIP1R | P4T-E | Human | Esophagus | ESCC | 1.92e-10 | 2.49e-01 | 0.1323 |
| 9026 | HIP1R | P5T-E | Human | Esophagus | ESCC | 1.69e-18 | 4.14e-01 | 0.1327 |
| 9026 | HIP1R | P8T-E | Human | Esophagus | ESCC | 4.42e-24 | 4.96e-01 | 0.0889 |
| 9026 | HIP1R | P9T-E | Human | Esophagus | ESCC | 1.65e-03 | 1.39e-01 | 0.1131 |
| 9026 | HIP1R | P10T-E | Human | Esophagus | ESCC | 4.44e-08 | 1.23e-01 | 0.116 |
| 9026 | HIP1R | P11T-E | Human | Esophagus | ESCC | 2.26e-07 | 3.98e-01 | 0.1426 |
| 9026 | HIP1R | P12T-E | Human | Esophagus | ESCC | 2.81e-16 | 3.20e-01 | 0.1122 |
| 9026 | HIP1R | P15T-E | Human | Esophagus | ESCC | 1.40e-14 | 3.38e-01 | 0.1149 |
| 9026 | HIP1R | P16T-E | Human | Esophagus | ESCC | 3.26e-15 | 2.36e-01 | 0.1153 |
| 9026 | HIP1R | P17T-E | Human | Esophagus | ESCC | 7.22e-10 | 4.00e-01 | 0.1278 |
| 9026 | HIP1R | P20T-E | Human | Esophagus | ESCC | 3.11e-09 | 2.71e-01 | 0.1124 |
| 9026 | HIP1R | P21T-E | Human | Esophagus | ESCC | 3.24e-28 | 5.04e-01 | 0.1617 |
| 9026 | HIP1R | P22T-E | Human | Esophagus | ESCC | 5.12e-05 | 1.10e-01 | 0.1236 |
| Page: 1 2 3 4 5 |
| Tissue | Expression Dynamics | Abbreviation |
| Esophagus | 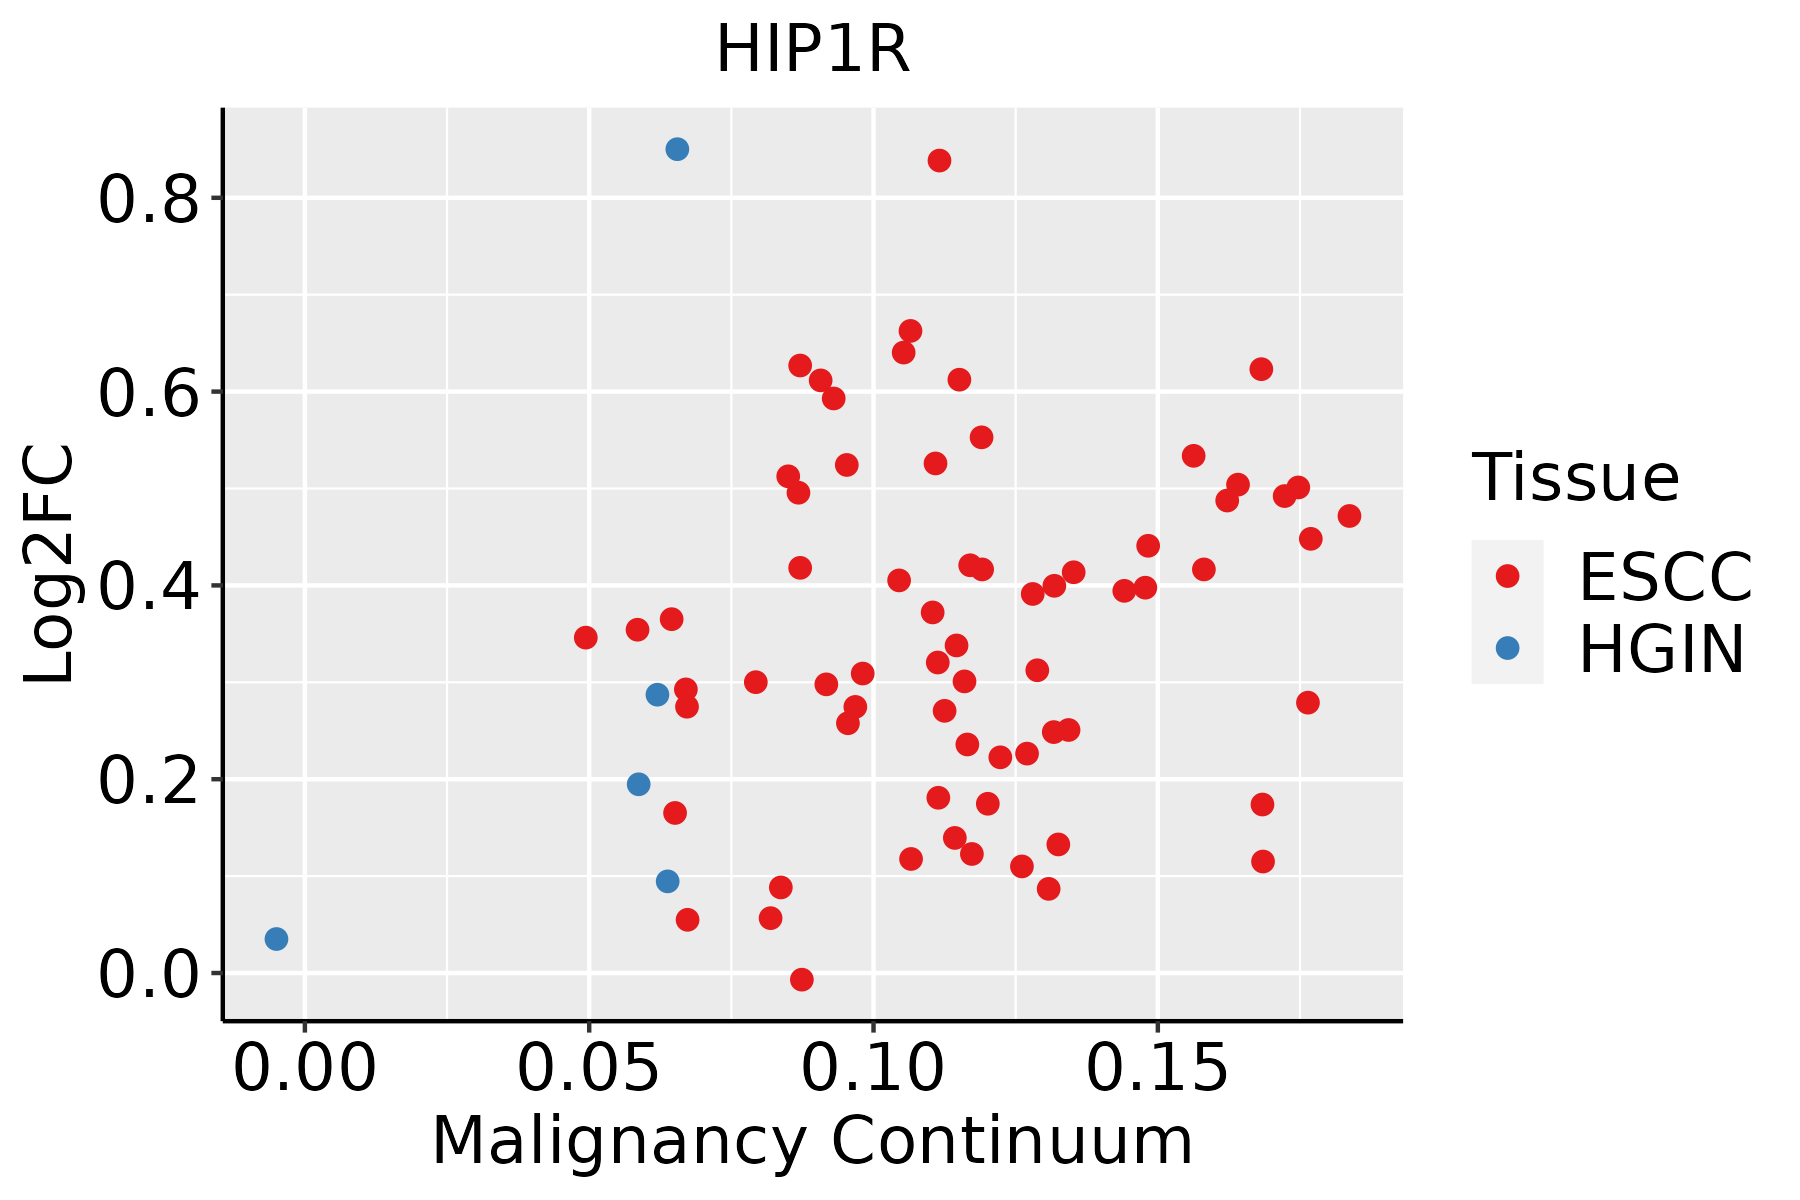 | ESCC: Esophageal squamous cell carcinoma |
| HGIN: High-grade intraepithelial neoplasias | ||
| LGIN: Low-grade intraepithelial neoplasias | ||
| Liver |  | HCC: Hepatocellular carcinoma |
| NAFLD: Non-alcoholic fatty liver disease | ||
| Oral Cavity | 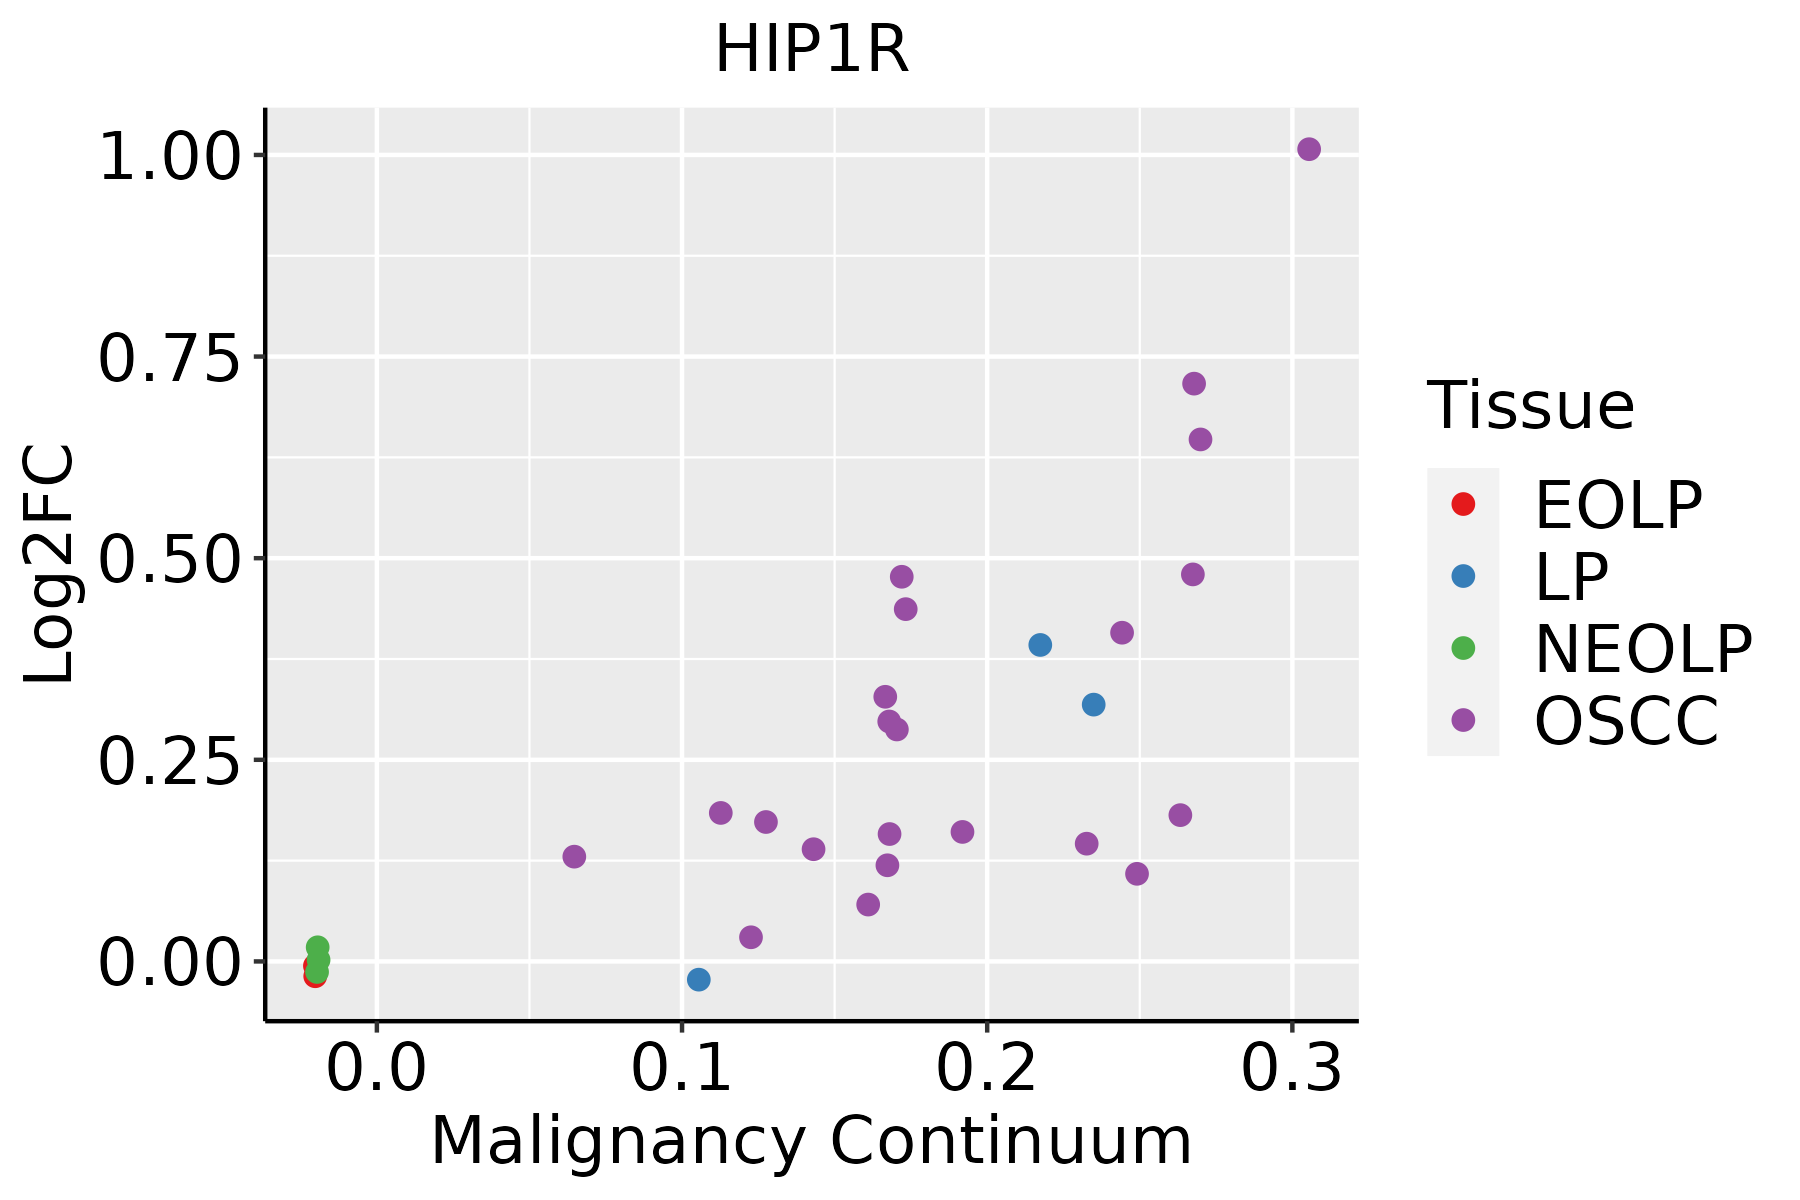 | EOLP: Erosive Oral lichen planus |
| LP: leukoplakia | ||
| NEOLP: Non-erosive oral lichen planus | ||
| OSCC: Oral squamous cell carcinoma |
| ∗log2FC in expression of this searched gene in stem-like cells from each diseased tissue sample relative to stem-like cells in normal samples in each tissue plotted against the malignancy continuum. Samples are colored based on if they are from different disease stage. |
Top |
Malignant transformation related pathway analysis |
| Find out the enriched GO biological processes and KEGG pathways involved in transition from healthy to precancer to cancer |
| Tissue | Disease Stage | Enriched GO biological Processes |
| Colorectum | AD |  |
| Colorectum | SER |  |
| Colorectum | MSS |  |
| Colorectum | MSI-H |  |
| Colorectum | FAP |  |
| ∗Top 15 enriched GO BP terms are showed in the bar plot of each disease state in each tissue. Each row represents a significant GO biological process which is colored according to the -log10(p.adjust). |
| Page: 1 2 3 4 5 6 7 8 9 |
| GO ID | Tissue | Disease Stage | Description | Gene Ratio | Bg Ratio | pvalue | p.adjust | Count |
| GO:19021108 | Esophagus | ESCC | positive regulation of mitochondrial membrane permeability involved in apoptotic process | 31/8552 | 38/18723 | 5.93e-06 | 6.10e-05 | 31 |
| GO:0043280110 | Esophagus | ESCC | positive regulation of cysteine-type endopeptidase activity involved in apoptotic process | 84/8552 | 129/18723 | 6.38e-06 | 6.55e-05 | 84 |
| GO:00480087 | Esophagus | ESCC | platelet-derived growth factor receptor signaling pathway | 42/8552 | 56/18723 | 7.62e-06 | 7.54e-05 | 42 |
| GO:2001056110 | Esophagus | ESCC | positive regulation of cysteine-type endopeptidase activity | 94/8552 | 148/18723 | 8.87e-06 | 8.59e-05 | 94 |
| GO:19057108 | Esophagus | ESCC | positive regulation of membrane permeability | 37/8552 | 48/18723 | 8.99e-06 | 8.65e-05 | 37 |
| GO:003083819 | Esophagus | ESCC | positive regulation of actin filament polymerization | 66/8552 | 99/18723 | 1.96e-05 | 1.72e-04 | 66 |
| GO:000691915 | Esophagus | ESCC | activation of cysteine-type endopeptidase activity involved in apoptotic process | 54/8552 | 78/18723 | 2.17e-05 | 1.87e-04 | 54 |
| GO:000815420 | Esophagus | ESCC | actin polymerization or depolymerization | 130/8552 | 218/18723 | 2.19e-05 | 1.88e-04 | 130 |
| GO:19010289 | Esophagus | ESCC | regulation of mitochondrial outer membrane permeabilization involved in apoptotic signaling pathway | 19/8552 | 21/18723 | 2.28e-05 | 1.96e-04 | 19 |
| GO:190118413 | Esophagus | ESCC | regulation of ERBB signaling pathway | 54/8552 | 79/18723 | 3.81e-05 | 3.08e-04 | 54 |
| GO:19021086 | Esophagus | ESCC | regulation of mitochondrial membrane permeability involved in apoptotic process | 34/8552 | 45/18723 | 4.37e-05 | 3.49e-04 | 34 |
| GO:000689818 | Esophagus | ESCC | receptor-mediated endocytosis | 142/8552 | 244/18723 | 5.22e-05 | 4.05e-04 | 142 |
| GO:0030041110 | Esophagus | ESCC | actin filament polymerization | 114/8552 | 191/18723 | 6.46e-05 | 4.92e-04 | 114 |
| GO:00420588 | Esophagus | ESCC | regulation of epidermal growth factor receptor signaling pathway | 50/8552 | 73/18723 | 6.75e-05 | 5.12e-04 | 50 |
| GO:000806419 | Esophagus | ESCC | regulation of actin polymerization or depolymerization | 112/8552 | 188/18723 | 8.31e-05 | 6.06e-04 | 112 |
| GO:003083218 | Esophagus | ESCC | regulation of actin filament length | 112/8552 | 189/18723 | 1.13e-04 | 7.85e-04 | 112 |
| GO:003083320 | Esophagus | ESCC | regulation of actin filament polymerization | 103/8552 | 172/18723 | 1.19e-04 | 8.15e-04 | 103 |
| GO:0031333110 | Esophagus | ESCC | negative regulation of protein-containing complex assembly | 86/8552 | 141/18723 | 1.74e-04 | 1.14e-03 | 86 |
| GO:19010304 | Esophagus | ESCC | positive regulation of mitochondrial outer membrane permeabilization involved in apoptotic signaling pathway | 11/8552 | 11/18723 | 1.80e-04 | 1.16e-03 | 11 |
| GO:007258314 | Esophagus | ESCC | clathrin-dependent endocytosis | 34/8552 | 47/18723 | 1.91e-04 | 1.21e-03 | 34 |
| Page: 1 2 3 4 5 6 7 8 9 10 11 12 13 |
| Pathway ID | Tissue | Disease Stage | Description | Gene Ratio | Bg Ratio | pvalue | p.adjust | qvalue | Count |
| Page: 1 |
Top |
Cell-cell communication analysis |
| Identification of potential cell-cell interactions between two cell types and their ligand-receptor pairs for different disease states |
| Ligand | Receptor | LRpair | Pathway | Tissue | Disease Stage |
| Page: 1 |
Top |
Single-cell gene regulatory network inference analysis |
| Find out the significant the regulons (TFs) and the target genes of each regulon across cell types for different disease states |
| TF | Cell Type | Tissue | Disease Stage | Target Gene | RSS | Regulon Activity |
| ∗The dot plots of a searched regulon are shown for all cell subpopulations in each disease state of each tissue based on the regulon specific score inferred using pySCENIC and by calculating the average expression. |
| Page: 1 |
Top |
Somatic mutation of malignant transformation related genes |
| Annotation of somatic variants for genes involved in malignant transformation |
| Hugo Symbol | Variant Class | Variant Classification | dbSNP RS | HGVSc | HGVSp | HGVSp Short | SWISSPROT | BIOTYPE | SIFT | PolyPhen | Tumor Sample Barcode | Tissue | Histology | Sex | Age | Stage | Therapy Types | Drugs | Outcome |
| HIP1R | SNV | Missense_Mutation | rs771199833 | c.2192N>T | p.Arg731Leu | p.R731L | O75146 | protein_coding | deleterious(0.02) | benign(0.001) | TCGA-A7-A3RF-01 | Breast | breast invasive carcinoma | Female | >=65 | I/II | Hormone Therapy | anastrozole | PD |
| HIP1R | SNV | Missense_Mutation | c.2901T>G | p.Asp967Glu | p.D967E | O75146 | protein_coding | deleterious(0.03) | probably_damaging(0.998) | TCGA-E2-A1B4-01 | Breast | breast invasive carcinoma | Female | >=65 | III/IV | Hormone Therapy | arimidex | SD | |
| HIP1R | SNV | Missense_Mutation | rs749155510 | c.1696N>T | p.Arg566Trp | p.R566W | O75146 | protein_coding | deleterious(0.01) | possibly_damaging(0.677) | TCGA-2W-A8YY-01 | Cervix | cervical & endocervical cancer | Female | <65 | I/II | Chemotherapy | cisplatin | CR |
| HIP1R | insertion | Frame_Shift_Ins | novel | c.2349_2350insCTGG | p.Asp784LeufsTer13 | p.D784Lfs*13 | O75146 | protein_coding | TCGA-DS-A1OA-01 | Cervix | cervical & endocervical cancer | Female | >=65 | I/II | Chemotherapy | carboplatin | PD | ||
| HIP1R | insertion | Frame_Shift_Ins | novel | c.2351_2352insAAGC | p.Asp784GlufsTer13 | p.D784Efs*13 | O75146 | protein_coding | TCGA-DS-A1OA-01 | Cervix | cervical & endocervical cancer | Female | >=65 | I/II | Chemotherapy | carboplatin | PD | ||
| HIP1R | SNV | Missense_Mutation | rs375128048 | c.374N>A | p.Arg125His | p.R125H | O75146 | protein_coding | tolerated(0.08) | possibly_damaging(0.708) | TCGA-5M-AAT6-01 | Colorectum | colon adenocarcinoma | Female | <65 | III/IV | Unknown | Unknown | PD |
| HIP1R | SNV | Missense_Mutation | rs752398981 | c.1888G>A | p.Glu630Lys | p.E630K | O75146 | protein_coding | deleterious(0.01) | possibly_damaging(0.701) | TCGA-AA-3492-01 | Colorectum | colon adenocarcinoma | Female | >=65 | I/II | Unknown | Unknown | SD |
| HIP1R | SNV | Missense_Mutation | rs185463143 | c.1801C>T | p.Arg601Trp | p.R601W | O75146 | protein_coding | deleterious(0.02) | possibly_damaging(0.462) | TCGA-AA-3663-01 | Colorectum | colon adenocarcinoma | Male | <65 | I/II | Unknown | Unknown | SD |
| HIP1R | SNV | Missense_Mutation | rs756668419 | c.842G>A | p.Arg281Gln | p.R281Q | O75146 | protein_coding | tolerated(1) | benign(0.013) | TCGA-AA-3947-01 | Colorectum | colon adenocarcinoma | Female | <65 | I/II | Unknown | Unknown | SD |
| HIP1R | SNV | Missense_Mutation | rs140673904 | c.3068C>T | p.Ala1023Val | p.A1023V | O75146 | protein_coding | tolerated(0.27) | benign(0.013) | TCGA-AA-3947-01 | Colorectum | colon adenocarcinoma | Female | <65 | I/II | Unknown | Unknown | SD |
| Page: 1 2 3 4 5 6 7 8 |
Top |
Related drugs of malignant transformation related genes |
| Identification of chemicals and drugs interact with genes involved in malignant transfromation |
| (DGIdb 4.0) |
| Entrez ID | Symbol | Category | Interaction Types | Drug Claim Name | Drug Name | PMIDs |
| Page: 1 |

Copyright 2023-Present -The University of Texas Health Science Center at Houston |