
|
|||||
|
 | |
| |
| |
| |
| |
| |
|
Gene: HIF1AN |
Gene summary for HIF1AN |
| Gene information | Species | Human | Gene symbol | HIF1AN | Gene ID | 55662 |
| Gene name | hypoxia inducible factor 1 subunit alpha inhibitor | |
| Gene Alias | FIH1 | |
| Cytomap | 10q24.31 | |
| Gene Type | protein-coding | GO ID | GO:0000122 | UniProtAcc | Q9NWT6 |
Top |
Malignant transformation analysis |
| Identification of the aberrant gene expression in precancerous and cancerous lesions by comparing the gene expression of stem-like cells in diseased tissues with normal stem cells |
| Entrez ID | Symbol | Replicates | Species | Organ | Tissue | Adj P-value | Log2FC | Malignancy |
| 55662 | HIF1AN | LZE4T | Human | Esophagus | ESCC | 6.86e-07 | 2.55e-01 | 0.0811 |
| 55662 | HIF1AN | LZE8T | Human | Esophagus | ESCC | 1.55e-08 | 2.10e-01 | 0.067 |
| 55662 | HIF1AN | LZE24T | Human | Esophagus | ESCC | 1.61e-16 | 5.05e-01 | 0.0596 |
| 55662 | HIF1AN | P1T-E | Human | Esophagus | ESCC | 1.42e-02 | 2.61e-01 | 0.0875 |
| 55662 | HIF1AN | P2T-E | Human | Esophagus | ESCC | 3.15e-27 | 4.02e-01 | 0.1177 |
| 55662 | HIF1AN | P4T-E | Human | Esophagus | ESCC | 1.46e-14 | 3.75e-01 | 0.1323 |
| 55662 | HIF1AN | P5T-E | Human | Esophagus | ESCC | 1.13e-16 | 3.11e-01 | 0.1327 |
| 55662 | HIF1AN | P8T-E | Human | Esophagus | ESCC | 1.15e-13 | 2.91e-01 | 0.0889 |
| 55662 | HIF1AN | P9T-E | Human | Esophagus | ESCC | 1.83e-06 | 8.76e-02 | 0.1131 |
| 55662 | HIF1AN | P10T-E | Human | Esophagus | ESCC | 4.17e-05 | 9.31e-02 | 0.116 |
| 55662 | HIF1AN | P11T-E | Human | Esophagus | ESCC | 1.96e-04 | 2.32e-01 | 0.1426 |
| 55662 | HIF1AN | P12T-E | Human | Esophagus | ESCC | 5.81e-25 | 3.84e-01 | 0.1122 |
| 55662 | HIF1AN | P15T-E | Human | Esophagus | ESCC | 3.09e-14 | 3.17e-01 | 0.1149 |
| 55662 | HIF1AN | P16T-E | Human | Esophagus | ESCC | 1.86e-19 | 3.15e-01 | 0.1153 |
| 55662 | HIF1AN | P17T-E | Human | Esophagus | ESCC | 9.32e-09 | 2.65e-01 | 0.1278 |
| 55662 | HIF1AN | P19T-E | Human | Esophagus | ESCC | 1.05e-05 | 5.38e-01 | 0.1662 |
| 55662 | HIF1AN | P20T-E | Human | Esophagus | ESCC | 4.48e-16 | 3.40e-01 | 0.1124 |
| 55662 | HIF1AN | P21T-E | Human | Esophagus | ESCC | 1.48e-10 | 1.92e-01 | 0.1617 |
| 55662 | HIF1AN | P22T-E | Human | Esophagus | ESCC | 4.58e-18 | 2.53e-01 | 0.1236 |
| 55662 | HIF1AN | P23T-E | Human | Esophagus | ESCC | 1.51e-20 | 4.57e-01 | 0.108 |
| Page: 1 2 3 4 5 |
| Tissue | Expression Dynamics | Abbreviation |
| Esophagus |  | ESCC: Esophageal squamous cell carcinoma |
| HGIN: High-grade intraepithelial neoplasias | ||
| LGIN: Low-grade intraepithelial neoplasias | ||
| Liver | 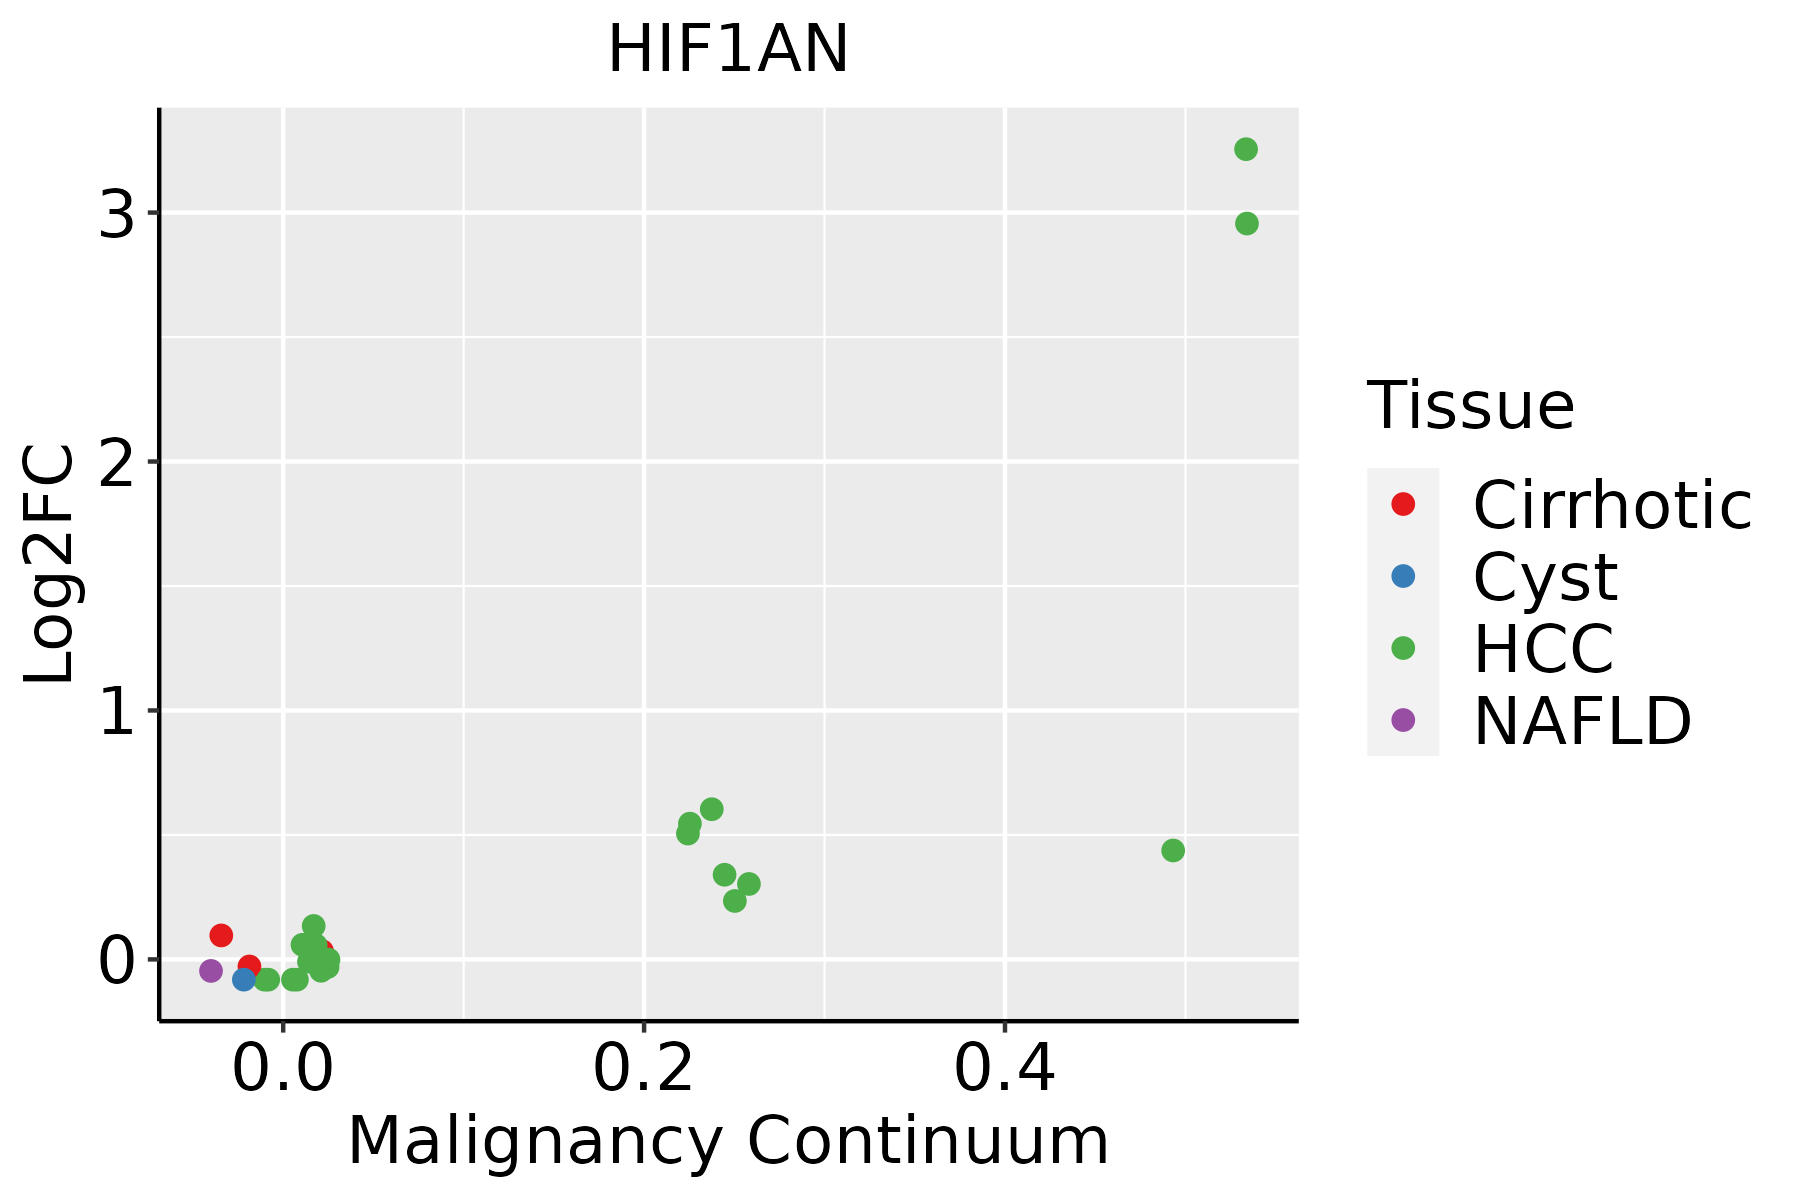 | HCC: Hepatocellular carcinoma |
| NAFLD: Non-alcoholic fatty liver disease | ||
| Oral Cavity |  | EOLP: Erosive Oral lichen planus |
| LP: leukoplakia | ||
| NEOLP: Non-erosive oral lichen planus | ||
| OSCC: Oral squamous cell carcinoma |
| ∗log2FC in expression of this searched gene in stem-like cells from each diseased tissue sample relative to stem-like cells in normal samples in each tissue plotted against the malignancy continuum. Samples are colored based on if they are from different disease stage. |
Top |
Malignant transformation related pathway analysis |
| Find out the enriched GO biological processes and KEGG pathways involved in transition from healthy to precancer to cancer |
| Tissue | Disease Stage | Enriched GO biological Processes |
| Colorectum | AD |  |
| Colorectum | SER |  |
| Colorectum | MSS |  |
| Colorectum | MSI-H |  |
| Colorectum | FAP |  |
| ∗Top 15 enriched GO BP terms are showed in the bar plot of each disease state in each tissue. Each row represents a significant GO biological process which is colored according to the -log10(p.adjust). |
| Page: 1 2 3 4 5 6 7 8 9 |
| GO ID | Tissue | Disease Stage | Description | Gene Ratio | Bg Ratio | pvalue | p.adjust | Count |
| GO:00085934 | Oral cavity | OSCC | regulation of Notch signaling pathway | 53/7305 | 95/18723 | 6.64e-04 | 3.72e-03 | 53 |
| GO:00614183 | Oral cavity | OSCC | regulation of transcription from RNA polymerase II promoter in response to hypoxia | 11/7305 | 13/18723 | 1.02e-03 | 5.29e-03 | 11 |
| GO:00454453 | Oral cavity | OSCC | myoblast differentiation | 46/7305 | 84/18723 | 2.43e-03 | 1.07e-02 | 46 |
| GO:0070482110 | Oral cavity | LP | response to oxygen levels | 122/4623 | 347/18723 | 7.10e-06 | 1.37e-04 | 122 |
| GO:0043620110 | Oral cavity | LP | regulation of DNA-templated transcription in response to stress | 28/4623 | 53/18723 | 9.88e-06 | 1.80e-04 | 28 |
| GO:001819614 | Oral cavity | LP | peptidyl-asparagine modification | 16/4623 | 24/18723 | 1.68e-05 | 2.92e-04 | 16 |
| GO:0001666110 | Oral cavity | LP | response to hypoxia | 106/4623 | 307/18723 | 6.38e-05 | 8.61e-04 | 106 |
| GO:0043618110 | Oral cavity | LP | regulation of transcription from RNA polymerase II promoter in response to stress | 24/4623 | 47/18723 | 8.65e-05 | 1.10e-03 | 24 |
| GO:0036293110 | Oral cavity | LP | response to decreased oxygen levels | 109/4623 | 322/18723 | 1.25e-04 | 1.46e-03 | 109 |
| GO:009720113 | Oral cavity | LP | negative regulation of transcription from RNA polymerase II promoter in response to stress | 9/4623 | 12/18723 | 3.52e-04 | 3.49e-03 | 9 |
| GO:004544512 | Oral cavity | LP | myoblast differentiation | 35/4623 | 84/18723 | 4.56e-04 | 4.33e-03 | 35 |
| GO:001812611 | Oral cavity | LP | protein hydroxylation | 14/4623 | 27/18723 | 2.14e-03 | 1.57e-02 | 14 |
| GO:0045661 | Oral cavity | LP | regulation of myoblast differentiation | 22/4623 | 51/18723 | 2.96e-03 | 2.03e-02 | 22 |
| GO:006141811 | Oral cavity | LP | regulation of transcription from RNA polymerase II promoter in response to hypoxia | 8/4623 | 13/18723 | 5.19e-03 | 3.19e-02 | 8 |
| GO:000859311 | Oral cavity | LP | regulation of Notch signaling pathway | 35/4623 | 95/18723 | 5.53e-03 | 3.34e-02 | 35 |
| GO:000721913 | Oral cavity | LP | Notch signaling pathway | 57/4623 | 172/18723 | 7.60e-03 | 4.18e-02 | 57 |
| Page: 1 2 3 |
| Pathway ID | Tissue | Disease Stage | Description | Gene Ratio | Bg Ratio | pvalue | p.adjust | qvalue | Count |
| Page: 1 |
Top |
Cell-cell communication analysis |
| Identification of potential cell-cell interactions between two cell types and their ligand-receptor pairs for different disease states |
| Ligand | Receptor | LRpair | Pathway | Tissue | Disease Stage |
| Page: 1 |
Top |
Single-cell gene regulatory network inference analysis |
| Find out the significant the regulons (TFs) and the target genes of each regulon across cell types for different disease states |
| TF | Cell Type | Tissue | Disease Stage | Target Gene | RSS | Regulon Activity |
| ∗The dot plots of a searched regulon are shown for all cell subpopulations in each disease state of each tissue based on the regulon specific score inferred using pySCENIC and by calculating the average expression. |
| Page: 1 |
Top |
Somatic mutation of malignant transformation related genes |
| Annotation of somatic variants for genes involved in malignant transformation |
| Hugo Symbol | Variant Class | Variant Classification | dbSNP RS | HGVSc | HGVSp | HGVSp Short | SWISSPROT | BIOTYPE | SIFT | PolyPhen | Tumor Sample Barcode | Tissue | Histology | Sex | Age | Stage | Therapy Types | Drugs | Outcome |
| HIF1AN | insertion | Frame_Shift_Ins | rs796594580 | c.615_616insT | p.Ala208CysfsTer30 | p.A208Cfs*30 | Q9NWT6 | protein_coding | TCGA-A8-A09Z-01 | Breast | breast invasive carcinoma | Female | >=65 | I/II | Unknown | Unknown | SD | ||
| HIF1AN | SNV | Missense_Mutation | novel | c.521A>G | p.Gln174Arg | p.Q174R | Q9NWT6 | protein_coding | tolerated(0.09) | possibly_damaging(0.857) | TCGA-2W-A8YY-01 | Cervix | cervical & endocervical cancer | Female | <65 | I/II | Chemotherapy | cisplatin | CR |
| HIF1AN | SNV | Missense_Mutation | c.388N>A | p.Glu130Lys | p.E130K | Q9NWT6 | protein_coding | tolerated(0.49) | benign(0.003) | TCGA-Q1-A5R2-01 | Cervix | cervical & endocervical cancer | Female | <65 | I/II | Chemotherapy | cisplatin | PR | |
| HIF1AN | SNV | Missense_Mutation | c.484N>G | p.Phe162Val | p.F162V | Q9NWT6 | protein_coding | deleterious(0.01) | probably_damaging(0.954) | TCGA-AA-A01P-01 | Colorectum | colon adenocarcinoma | Female | >=65 | III/IV | Unknown | Unknown | PD | |
| HIF1AN | SNV | Missense_Mutation | c.249N>T | p.Glu83Asp | p.E83D | Q9NWT6 | protein_coding | tolerated(0.06) | benign(0.003) | TCGA-CA-6718-01 | Colorectum | colon adenocarcinoma | Male | <65 | I/II | Unknown | Unknown | PD | |
| HIF1AN | SNV | Missense_Mutation | c.926N>A | p.Pro309His | p.P309H | Q9NWT6 | protein_coding | deleterious(0) | probably_damaging(0.999) | TCGA-G4-6588-01 | Colorectum | colon adenocarcinoma | Female | <65 | I/II | Unknown | Unknown | SD | |
| HIF1AN | SNV | Missense_Mutation | novel | c.281N>A | p.Ser94Asn | p.S94N | Q9NWT6 | protein_coding | tolerated(0.47) | benign(0.013) | TCGA-AG-A002-01 | Colorectum | rectum adenocarcinoma | Male | <65 | I/II | Unknown | Unknown | SD |
| HIF1AN | SNV | Missense_Mutation | rs762795856 | c.662N>T | p.Pro221Leu | p.P221L | Q9NWT6 | protein_coding | deleterious(0) | probably_damaging(1) | TCGA-AG-A023-01 | Colorectum | rectum adenocarcinoma | Female | <65 | III/IV | Unknown | Unknown | PD |
| HIF1AN | SNV | Missense_Mutation | novel | c.454N>T | p.Asp152Tyr | p.D152Y | Q9NWT6 | protein_coding | tolerated(0.05) | benign(0.415) | TCGA-EI-6917-01 | Colorectum | rectum adenocarcinoma | Male | <65 | III/IV | Chemotherapy | 5fluorouracil+oxaciplatina+l-folinian | SD |
| HIF1AN | SNV | Missense_Mutation | novel | c.350N>T | p.Arg117Met | p.R117M | Q9NWT6 | protein_coding | deleterious(0.04) | benign(0.132) | TCGA-A5-A1OF-01 | Endometrium | uterine corpus endometrioid carcinoma | Female | <65 | I/II | Unknown | Unknown | SD |
| Page: 1 2 3 4 |
Top |
Related drugs of malignant transformation related genes |
| Identification of chemicals and drugs interact with genes involved in malignant transfromation |
| (DGIdb 4.0) |
| Entrez ID | Symbol | Category | Interaction Types | Drug Claim Name | Drug Name | PMIDs |
| 55662 | HIF1AN | NA | L-4-THIOPROLINE | CHEMBL1800368 | 21665470 | |
| 55662 | HIF1AN | NA | L-3,4-DEHYDROPROLINE | CHEMBL78920 | 21665470 | |
| 55662 | HIF1AN | NA | BAICALEIN | BAICALEIN | 21665470 |
| Page: 1 |

Copyright 2023-Present -The University of Texas Health Science Center at Houston |