
|
|||||
|
 | |
| |
| |
| |
| |
| |
|
Gene: HACD2 |
Gene summary for HACD2 |
| Gene information | Species | Human | Gene symbol | HACD2 | Gene ID | 201562 |
| Gene name | 3-hydroxyacyl-CoA dehydratase 2 | |
| Gene Alias | PTPLB | |
| Cytomap | 3q21.1 | |
| Gene Type | protein-coding | GO ID | GO:0000038 | UniProtAcc | Q6Y1H2 |
Top |
Malignant transformation analysis |
| Identification of the aberrant gene expression in precancerous and cancerous lesions by comparing the gene expression of stem-like cells in diseased tissues with normal stem cells |
| Entrez ID | Symbol | Replicates | Species | Organ | Tissue | Adj P-value | Log2FC | Malignancy |
| 201562 | HACD2 | CCI_2 | Human | Cervix | CC | 1.24e-05 | 6.79e-01 | 0.5249 |
| 201562 | HACD2 | CCI_3 | Human | Cervix | CC | 2.10e-06 | 7.09e-01 | 0.516 |
| 201562 | HACD2 | Tumor | Human | Cervix | CC | 1.44e-03 | 3.35e-01 | 0.1241 |
| 201562 | HACD2 | sample3 | Human | Cervix | CC | 7.90e-08 | 3.52e-01 | 0.1387 |
| 201562 | HACD2 | T3 | Human | Cervix | CC | 4.02e-12 | 4.10e-01 | 0.1389 |
| 201562 | HACD2 | LZE2T | Human | Esophagus | ESCC | 1.99e-05 | 5.94e-01 | 0.082 |
| 201562 | HACD2 | LZE4T | Human | Esophagus | ESCC | 2.44e-09 | 3.05e-01 | 0.0811 |
| 201562 | HACD2 | LZE7T | Human | Esophagus | ESCC | 9.36e-05 | 1.82e-01 | 0.0667 |
| 201562 | HACD2 | LZE20T | Human | Esophagus | ESCC | 3.66e-07 | 1.70e-01 | 0.0662 |
| 201562 | HACD2 | LZE22T | Human | Esophagus | ESCC | 8.11e-03 | 2.61e-01 | 0.068 |
| 201562 | HACD2 | LZE24T | Human | Esophagus | ESCC | 6.51e-16 | 3.37e-01 | 0.0596 |
| 201562 | HACD2 | LZE21T | Human | Esophagus | ESCC | 2.09e-03 | 1.05e-01 | 0.0655 |
| 201562 | HACD2 | P1T-E | Human | Esophagus | ESCC | 1.01e-08 | 4.39e-01 | 0.0875 |
| 201562 | HACD2 | P2T-E | Human | Esophagus | ESCC | 8.51e-37 | 6.96e-01 | 0.1177 |
| 201562 | HACD2 | P4T-E | Human | Esophagus | ESCC | 4.98e-17 | 3.14e-01 | 0.1323 |
| 201562 | HACD2 | P5T-E | Human | Esophagus | ESCC | 2.20e-34 | 7.22e-01 | 0.1327 |
| 201562 | HACD2 | P8T-E | Human | Esophagus | ESCC | 4.23e-37 | 7.55e-01 | 0.0889 |
| 201562 | HACD2 | P9T-E | Human | Esophagus | ESCC | 2.51e-17 | 2.95e-01 | 0.1131 |
| 201562 | HACD2 | P10T-E | Human | Esophagus | ESCC | 8.93e-38 | 7.60e-01 | 0.116 |
| 201562 | HACD2 | P11T-E | Human | Esophagus | ESCC | 1.04e-25 | 9.49e-01 | 0.1426 |
| Page: 1 2 3 4 5 |
| Tissue | Expression Dynamics | Abbreviation |
| Cervix | 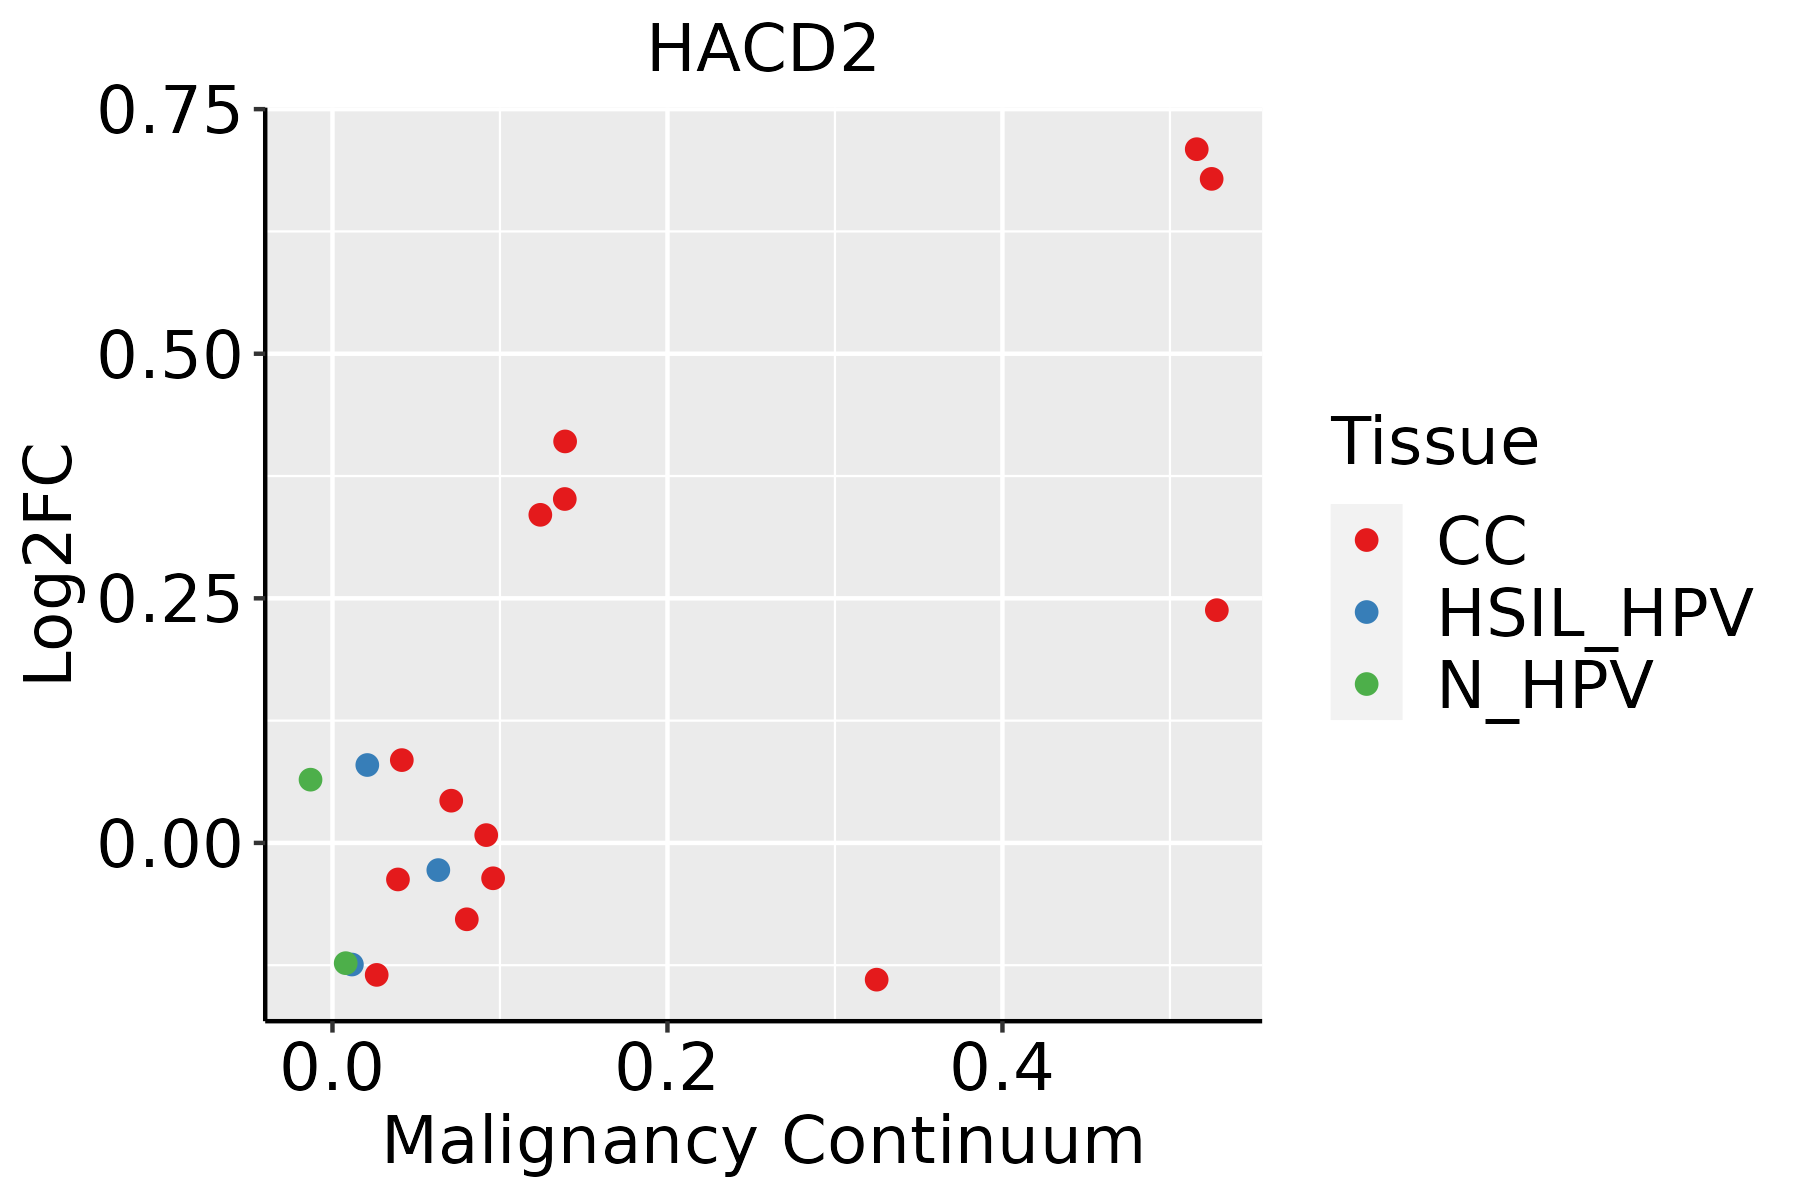 | CC: Cervix cancer |
| HSIL_HPV: HPV-infected high-grade squamous intraepithelial lesions | ||
| N_HPV: HPV-infected normal cervix | ||
| Esophagus | 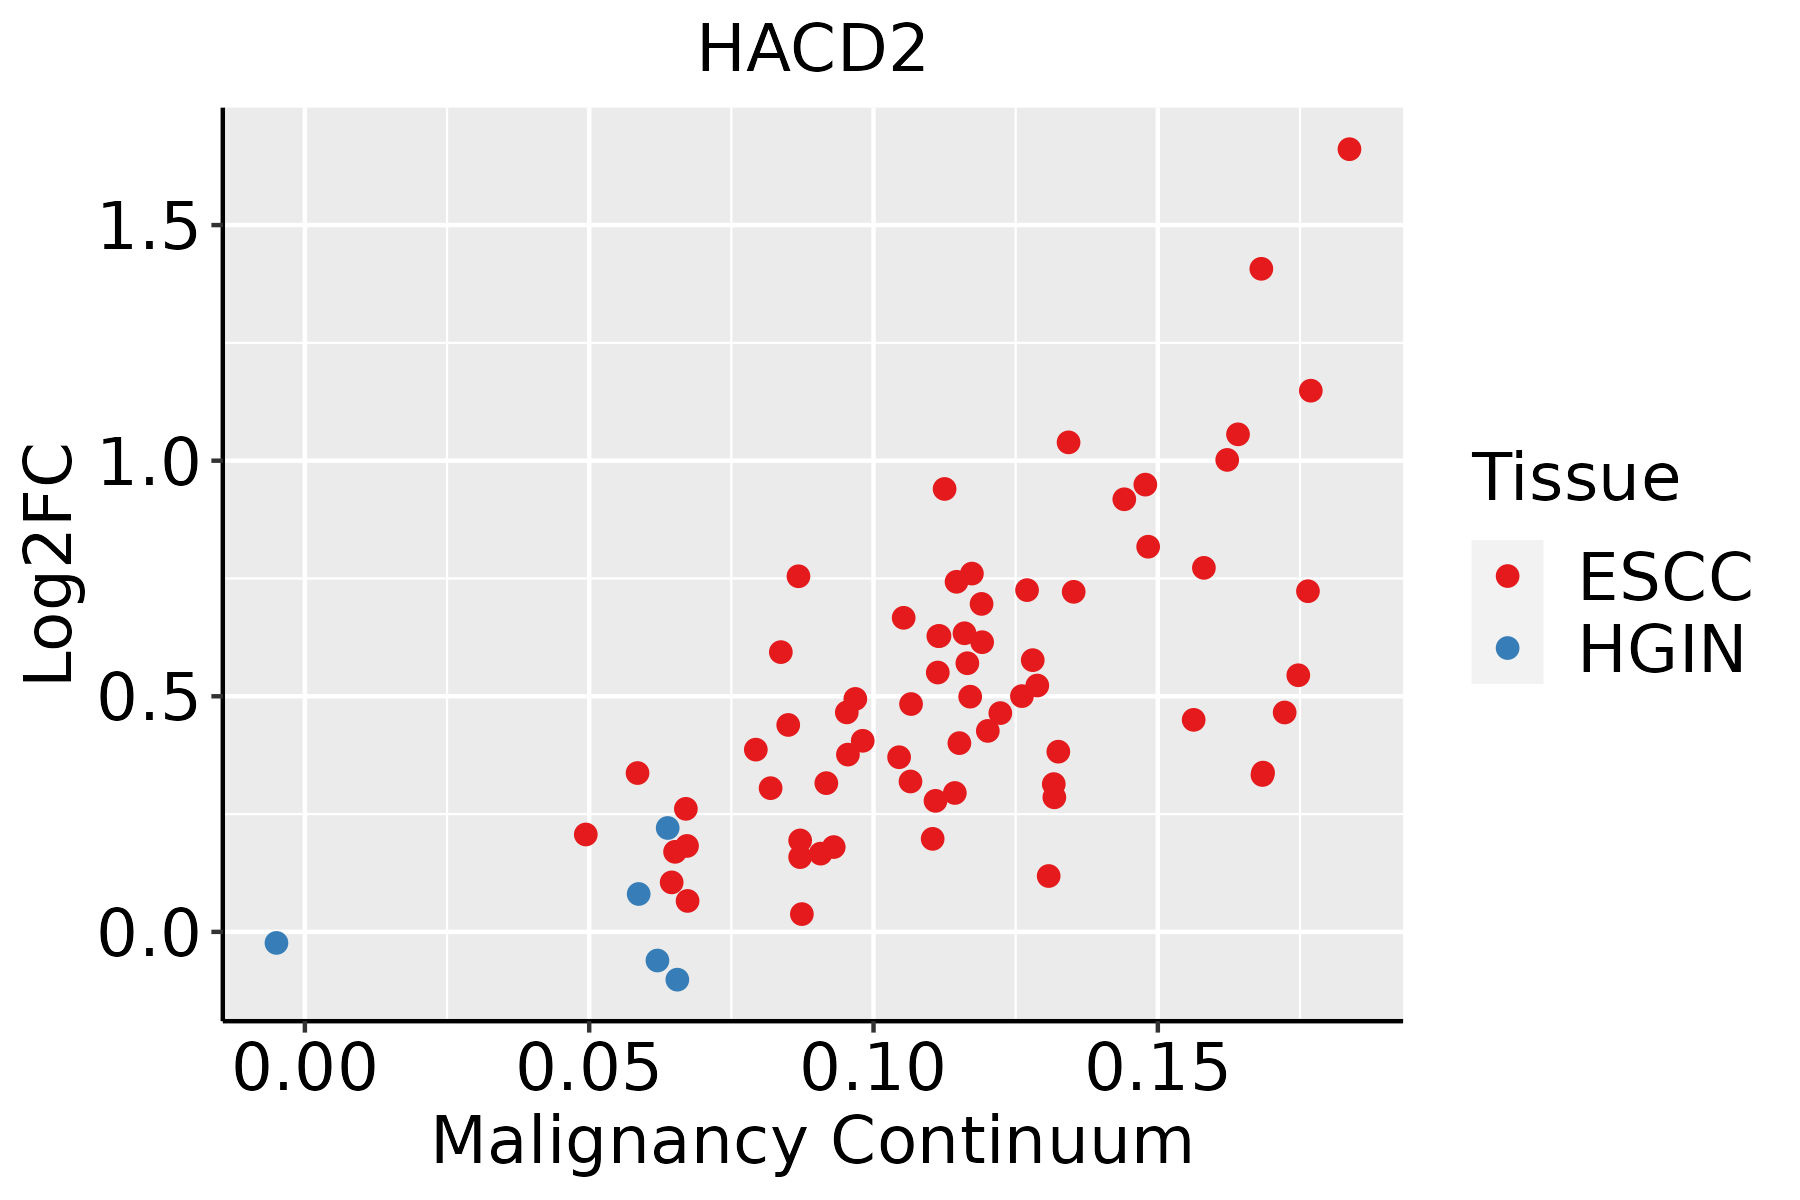 | ESCC: Esophageal squamous cell carcinoma |
| HGIN: High-grade intraepithelial neoplasias | ||
| LGIN: Low-grade intraepithelial neoplasias | ||
| Liver | 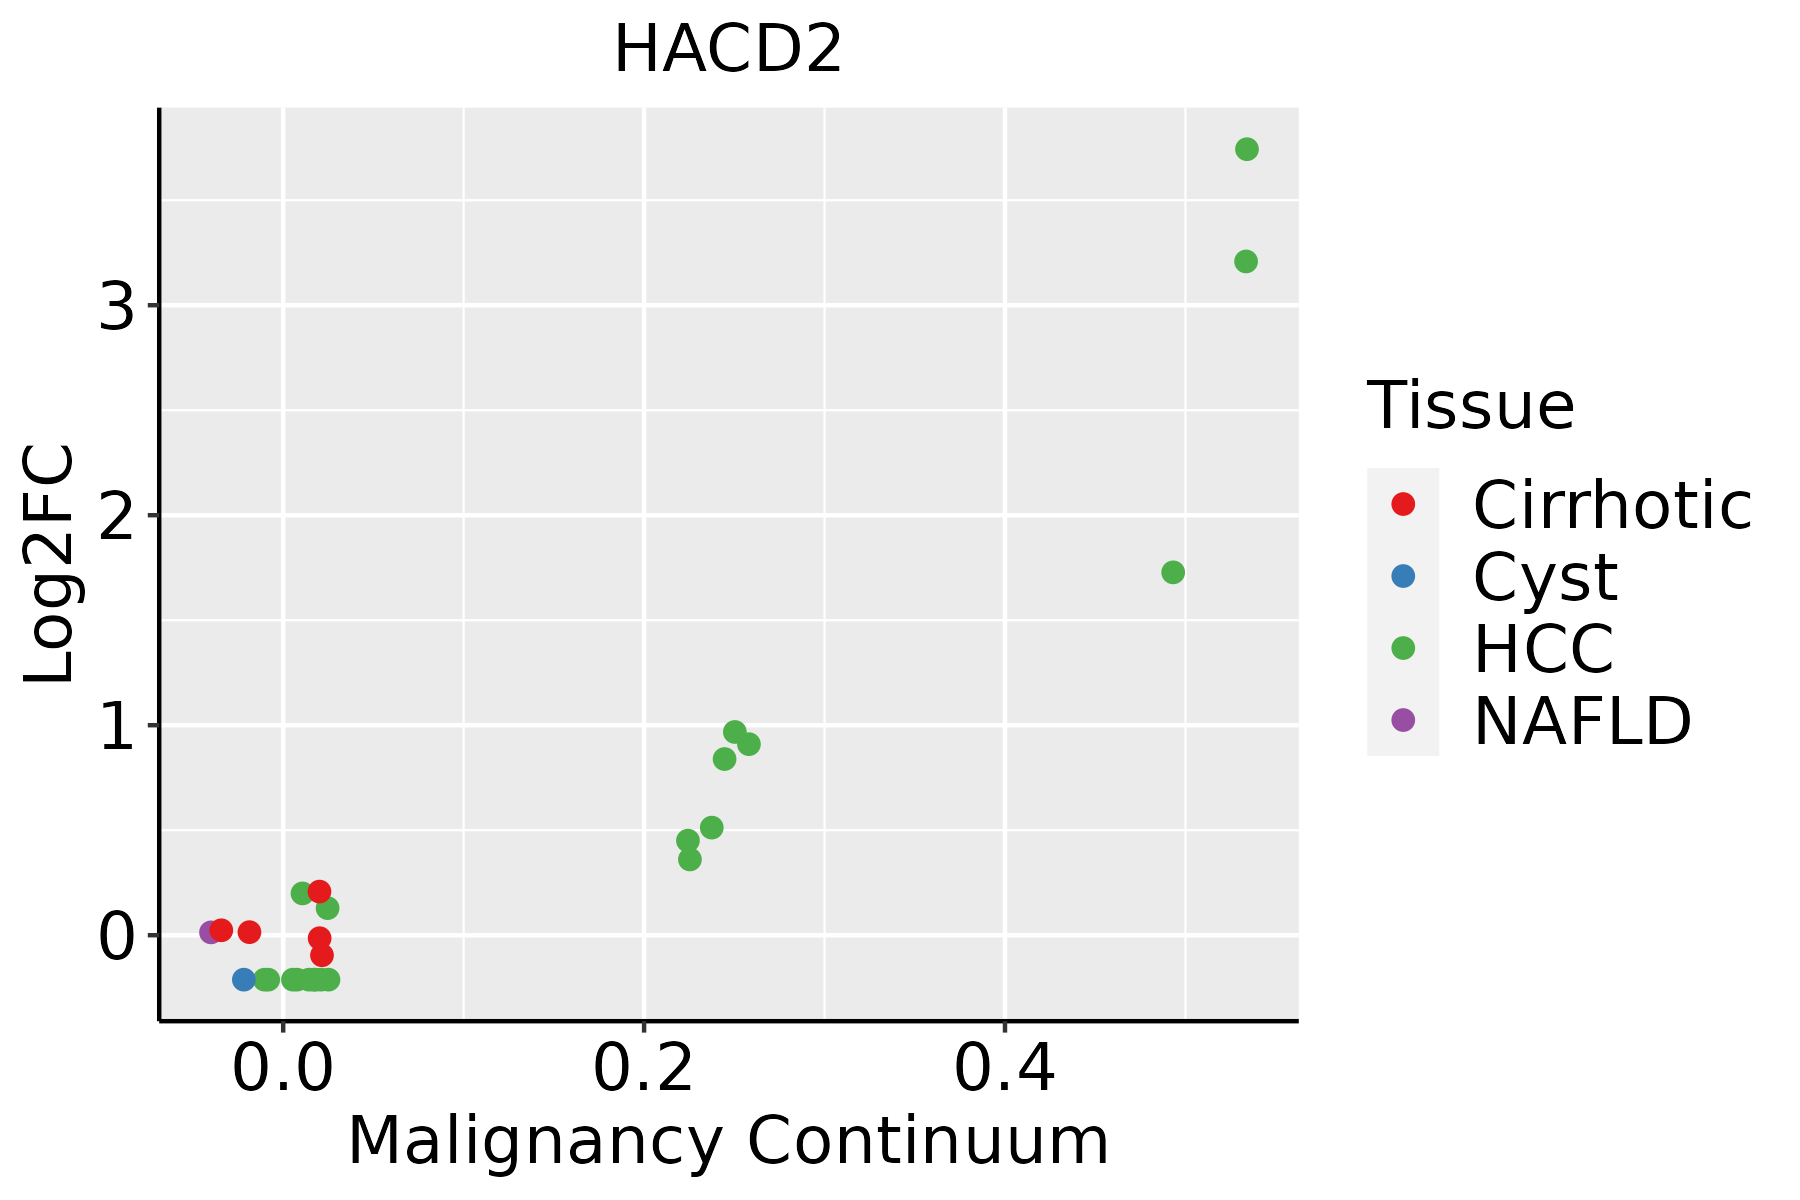 | HCC: Hepatocellular carcinoma |
| NAFLD: Non-alcoholic fatty liver disease | ||
| Oral Cavity |  | EOLP: Erosive Oral lichen planus |
| LP: leukoplakia | ||
| NEOLP: Non-erosive oral lichen planus | ||
| OSCC: Oral squamous cell carcinoma | ||
| Prostate |  | BPH: Benign Prostatic Hyperplasia |
| ∗log2FC in expression of this searched gene in stem-like cells from each diseased tissue sample relative to stem-like cells in normal samples in each tissue plotted against the malignancy continuum. Samples are colored based on if they are from different disease stage. |
Top |
Malignant transformation related pathway analysis |
| Find out the enriched GO biological processes and KEGG pathways involved in transition from healthy to precancer to cancer |
| Tissue | Disease Stage | Enriched GO biological Processes |
| Colorectum | AD |  |
| Colorectum | SER |  |
| Colorectum | MSS |  |
| Colorectum | MSI-H |  |
| Colorectum | FAP |  |
| ∗Top 15 enriched GO BP terms are showed in the bar plot of each disease state in each tissue. Each row represents a significant GO biological process which is colored according to the -log10(p.adjust). |
| Page: 1 2 3 4 5 6 7 8 9 |
| GO ID | Tissue | Disease Stage | Description | Gene Ratio | Bg Ratio | pvalue | p.adjust | Count |
| GO:00066374 | Esophagus | ESCC | acyl-CoA metabolic process | 55/8552 | 96/18723 | 1.45e-02 | 4.71e-02 | 55 |
| GO:00353834 | Esophagus | ESCC | thioester metabolic process | 55/8552 | 96/18723 | 1.45e-02 | 4.71e-02 | 55 |
| GO:000663112 | Liver | Cirrhotic | fatty acid metabolic process | 165/4634 | 390/18723 | 1.29e-14 | 1.26e-12 | 165 |
| GO:001605312 | Liver | Cirrhotic | organic acid biosynthetic process | 139/4634 | 316/18723 | 4.28e-14 | 3.83e-12 | 139 |
| GO:004639412 | Liver | Cirrhotic | carboxylic acid biosynthetic process | 137/4634 | 314/18723 | 1.40e-13 | 1.14e-11 | 137 |
| GO:000675312 | Liver | Cirrhotic | nucleoside phosphate metabolic process | 190/4634 | 497/18723 | 1.10e-11 | 6.96e-10 | 190 |
| GO:000911712 | Liver | Cirrhotic | nucleotide metabolic process | 187/4634 | 489/18723 | 1.55e-11 | 9.63e-10 | 187 |
| GO:001969312 | Liver | Cirrhotic | ribose phosphate metabolic process | 156/4634 | 396/18723 | 5.83e-11 | 3.23e-09 | 156 |
| GO:000925912 | Liver | Cirrhotic | ribonucleotide metabolic process | 151/4634 | 385/18723 | 1.72e-10 | 8.70e-09 | 151 |
| GO:007233011 | Liver | Cirrhotic | monocarboxylic acid biosynthetic process | 93/4634 | 214/18723 | 1.43e-09 | 6.16e-08 | 93 |
| GO:007252112 | Liver | Cirrhotic | purine-containing compound metabolic process | 156/4634 | 416/18723 | 3.74e-09 | 1.52e-07 | 156 |
| GO:000915012 | Liver | Cirrhotic | purine ribonucleotide metabolic process | 141/4634 | 368/18723 | 4.22e-09 | 1.70e-07 | 141 |
| GO:000679011 | Liver | Cirrhotic | sulfur compound metabolic process | 129/4634 | 339/18723 | 3.06e-08 | 1.04e-06 | 129 |
| GO:000616312 | Liver | Cirrhotic | purine nucleotide metabolic process | 146/4634 | 396/18723 | 4.12e-08 | 1.34e-06 | 146 |
| GO:000663311 | Liver | Cirrhotic | fatty acid biosynthetic process | 70/4634 | 163/18723 | 2.57e-07 | 6.41e-06 | 70 |
| GO:00442721 | Liver | Cirrhotic | sulfur compound biosynthetic process | 58/4634 | 148/18723 | 6.93e-05 | 7.83e-04 | 58 |
| GO:00463905 | Liver | Cirrhotic | ribose phosphate biosynthetic process | 71/4634 | 190/18723 | 7.09e-05 | 7.98e-04 | 71 |
| GO:00092605 | Liver | Cirrhotic | ribonucleotide biosynthetic process | 68/4634 | 182/18723 | 1.00e-04 | 1.05e-03 | 68 |
| GO:00091654 | Liver | Cirrhotic | nucleotide biosynthetic process | 89/4634 | 254/18723 | 1.45e-04 | 1.40e-03 | 89 |
| GO:19012934 | Liver | Cirrhotic | nucleoside phosphate biosynthetic process | 89/4634 | 256/18723 | 1.97e-04 | 1.82e-03 | 89 |
| Page: 1 2 3 4 5 6 7 8 9 |
| Pathway ID | Tissue | Disease Stage | Description | Gene Ratio | Bg Ratio | pvalue | p.adjust | qvalue | Count |
| hsa012129 | Esophagus | ESCC | Fatty acid metabolism | 41/4205 | 57/8465 | 5.13e-04 | 1.75e-03 | 8.98e-04 | 41 |
| hsa0121214 | Esophagus | ESCC | Fatty acid metabolism | 41/4205 | 57/8465 | 5.13e-04 | 1.75e-03 | 8.98e-04 | 41 |
| hsa012122 | Liver | Cirrhotic | Fatty acid metabolism | 32/2530 | 57/8465 | 3.12e-05 | 2.47e-04 | 1.52e-04 | 32 |
| hsa01040 | Liver | Cirrhotic | Biosynthesis of unsaturated fatty acids | 14/2530 | 27/8465 | 1.36e-02 | 4.25e-02 | 2.62e-02 | 14 |
| hsa012123 | Liver | Cirrhotic | Fatty acid metabolism | 32/2530 | 57/8465 | 3.12e-05 | 2.47e-04 | 1.52e-04 | 32 |
| hsa010401 | Liver | Cirrhotic | Biosynthesis of unsaturated fatty acids | 14/2530 | 27/8465 | 1.36e-02 | 4.25e-02 | 2.62e-02 | 14 |
| hsa012124 | Liver | HCC | Fatty acid metabolism | 45/4020 | 57/8465 | 1.05e-06 | 1.10e-05 | 6.09e-06 | 45 |
| hsa000622 | Liver | HCC | Fatty acid elongation | 20/4020 | 27/8465 | 4.58e-03 | 1.36e-02 | 7.55e-03 | 20 |
| hsa010402 | Liver | HCC | Biosynthesis of unsaturated fatty acids | 19/4020 | 27/8465 | 1.37e-02 | 3.33e-02 | 1.85e-02 | 19 |
| hsa012125 | Liver | HCC | Fatty acid metabolism | 45/4020 | 57/8465 | 1.05e-06 | 1.10e-05 | 6.09e-06 | 45 |
| hsa0006211 | Liver | HCC | Fatty acid elongation | 20/4020 | 27/8465 | 4.58e-03 | 1.36e-02 | 7.55e-03 | 20 |
| hsa010403 | Liver | HCC | Biosynthesis of unsaturated fatty acids | 19/4020 | 27/8465 | 1.37e-02 | 3.33e-02 | 1.85e-02 | 19 |
| hsa012128 | Oral cavity | OSCC | Fatty acid metabolism | 35/3704 | 57/8465 | 5.37e-03 | 1.29e-02 | 6.55e-03 | 35 |
| hsa0121213 | Oral cavity | OSCC | Fatty acid metabolism | 35/3704 | 57/8465 | 5.37e-03 | 1.29e-02 | 6.55e-03 | 35 |
| hsa0121221 | Prostate | Tumor | Fatty acid metabolism | 23/1791 | 57/8465 | 7.60e-04 | 3.59e-03 | 2.23e-03 | 23 |
| hsa010404 | Prostate | Tumor | Biosynthesis of unsaturated fatty acids | 12/1791 | 27/8465 | 5.53e-03 | 1.93e-02 | 1.19e-02 | 12 |
| hsa0121231 | Prostate | Tumor | Fatty acid metabolism | 23/1791 | 57/8465 | 7.60e-04 | 3.59e-03 | 2.23e-03 | 23 |
| hsa0104011 | Prostate | Tumor | Biosynthesis of unsaturated fatty acids | 12/1791 | 27/8465 | 5.53e-03 | 1.93e-02 | 1.19e-02 | 12 |
| Page: 1 |
Top |
Cell-cell communication analysis |
| Identification of potential cell-cell interactions between two cell types and their ligand-receptor pairs for different disease states |
| Ligand | Receptor | LRpair | Pathway | Tissue | Disease Stage |
| Page: 1 |
Top |
Single-cell gene regulatory network inference analysis |
| Find out the significant the regulons (TFs) and the target genes of each regulon across cell types for different disease states |
| TF | Cell Type | Tissue | Disease Stage | Target Gene | RSS | Regulon Activity |
| ∗The dot plots of a searched regulon are shown for all cell subpopulations in each disease state of each tissue based on the regulon specific score inferred using pySCENIC and by calculating the average expression. |
| Page: 1 |
Top |
Somatic mutation of malignant transformation related genes |
| Annotation of somatic variants for genes involved in malignant transformation |
| Hugo Symbol | Variant Class | Variant Classification | dbSNP RS | HGVSc | HGVSp | HGVSp Short | SWISSPROT | BIOTYPE | SIFT | PolyPhen | Tumor Sample Barcode | Tissue | Histology | Sex | Age | Stage | Therapy Types | Drugs | Outcome |
| HACD2 | SNV | Missense_Mutation | c.632C>T | p.Ser211Phe | p.S211F | Q6Y1H2 | protein_coding | deleterious(0) | probably_damaging(0.999) | TCGA-AR-A1AJ-01 | Breast | breast invasive carcinoma | Female | >=65 | I/II | Unknown | Unknown | SD | |
| HACD2 | SNV | Missense_Mutation | c.722N>A | p.Arg241Lys | p.R241K | Q6Y1H2 | protein_coding | tolerated(0.39) | benign(0.02) | TCGA-B6-A0IJ-01 | Breast | breast invasive carcinoma | Female | <65 | I/II | Unknown | Unknown | SD | |
| HACD2 | SNV | Missense_Mutation | novel | c.516N>A | p.Phe172Leu | p.F172L | Q6Y1H2 | protein_coding | deleterious(0) | probably_damaging(0.967) | TCGA-AA-A00N-01 | Colorectum | colon adenocarcinoma | Male | >=65 | I/II | Unknown | Unknown | PD |
| HACD2 | SNV | Missense_Mutation | novel | c.569N>T | p.Ala190Val | p.A190V | Q6Y1H2 | protein_coding | deleterious(0) | probably_damaging(0.998) | TCGA-AZ-4315-01 | Colorectum | colon adenocarcinoma | Male | <65 | I/II | Unknown | Unknown | SD |
| HACD2 | SNV | Missense_Mutation | novel | c.620N>C | p.Lys207Thr | p.K207T | Q6Y1H2 | protein_coding | deleterious(0.05) | possibly_damaging(0.867) | TCGA-CA-6717-01 | Colorectum | colon adenocarcinoma | Male | <65 | I/II | Chemotherapy | oxaliplatin | CR |
| HACD2 | SNV | Missense_Mutation | novel | c.755N>T | p.Lys252Ile | p.K252I | Q6Y1H2 | protein_coding | deleterious(0) | possibly_damaging(0.854) | TCGA-AJ-A3EL-01 | Endometrium | uterine corpus endometrioid carcinoma | Female | <65 | I/II | Unknown | Unknown | SD |
| HACD2 | SNV | Missense_Mutation | novel | c.658C>A | p.Leu220Ile | p.L220I | Q6Y1H2 | protein_coding | tolerated(0.79) | benign(0.034) | TCGA-AX-A2HC-01 | Endometrium | uterine corpus endometrioid carcinoma | Female | <65 | III/IV | Chemotherapy | paclitaxel | PD |
| HACD2 | SNV | Missense_Mutation | c.630C>A | p.Phe210Leu | p.F210L | Q6Y1H2 | protein_coding | tolerated(0.11) | benign(0.123) | TCGA-BS-A0TC-01 | Endometrium | uterine corpus endometrioid carcinoma | Female | >=65 | I/II | Unknown | Unknown | SD | |
| HACD2 | SNV | Missense_Mutation | novel | c.734N>A | p.Ser245Tyr | p.S245Y | Q6Y1H2 | protein_coding | deleterious(0.01) | benign(0.196) | TCGA-BS-A0UV-01 | Endometrium | uterine corpus endometrioid carcinoma | Female | <65 | III/IV | Unknown | Unknown | SD |
| HACD2 | SNV | Missense_Mutation | c.163G>T | p.Val55Phe | p.V55F | Q6Y1H2 | protein_coding | tolerated(0.17) | benign(0.021) | TCGA-D1-A16X-01 | Endometrium | uterine corpus endometrioid carcinoma | Female | <65 | I/II | Unknown | Unknown | SD |
| Page: 1 2 |
Top |
Related drugs of malignant transformation related genes |
| Identification of chemicals and drugs interact with genes involved in malignant transfromation |
| (DGIdb 4.0) |
| Entrez ID | Symbol | Category | Interaction Types | Drug Claim Name | Drug Name | PMIDs |
| Page: 1 |

Copyright 2023-Present -The University of Texas Health Science Center at Houston |