
|
|||||
|
 | |
| |
| |
| |
| |
| |
|
Gene: GP2 |
Gene summary for GP2 |
| Gene information | Species | Human | Gene symbol | GP2 | Gene ID | 2813 |
| Gene name | glycoprotein 2 | |
| Gene Alias | ZAP75 | |
| Cytomap | 16p12.3 | |
| Gene Type | protein-coding | GO ID | GO:0002251 | UniProtAcc | B7Z1G2 |
Top |
Malignant transformation analysis |
| Identification of the aberrant gene expression in precancerous and cancerous lesions by comparing the gene expression of stem-like cells in diseased tissues with normal stem cells |
| Entrez ID | Symbol | Replicates | Species | Organ | Tissue | Adj P-value | Log2FC | Malignancy |
| 2813 | GP2 | HCC1 | Human | Liver | HCC | 2.53e-11 | 6.92e-01 | 0.5336 |
| 2813 | GP2 | HCC2 | Human | Liver | HCC | 3.94e-24 | 1.26e+00 | 0.5341 |
| 2813 | GP2 | HCC5 | Human | Liver | HCC | 1.64e-20 | 1.00e+00 | 0.4932 |
| 2813 | GP2 | HTA12-15-2 | Human | Pancreas | PDAC | 4.79e-49 | -2.47e+00 | 0.2315 |
| 2813 | GP2 | HTA12-16-2 | Human | Pancreas | PDAC | 2.38e-06 | -6.54e-01 | 0.0535 |
| 2813 | GP2 | HTA12-16-5 | Human | Pancreas | PDAC | 3.29e-27 | -4.18e-01 | 0.047 |
| 2813 | GP2 | HTA12-16-6 | Human | Pancreas | PDAC | 8.52e-05 | -5.62e-01 | 0.0544 |
| 2813 | GP2 | HTA12-18-3 | Human | Pancreas | PDAC | 5.10e-13 | -3.79e-01 | 0.0716 |
| 2813 | GP2 | HTA12-23-1 | Human | Pancreas | PDAC | 5.17e-35 | -2.47e+00 | 0.3405 |
| 2813 | GP2 | HTA12-25-1 | Human | Pancreas | PDAC | 3.56e-48 | -2.47e+00 | 0.313 |
| 2813 | GP2 | HTA12-26-1 | Human | Pancreas | PDAC | 2.45e-57 | -2.47e+00 | 0.3728 |
| 2813 | GP2 | HTA12-29-1 | Human | Pancreas | PDAC | 2.80e-127 | -2.47e+00 | 0.3722 |
| 2813 | GP2 | HTA12-3-16 | Human | Pancreas | PDAC | 9.64e-13 | -2.47e+00 | 0.1553 |
| 2813 | GP2 | HTA12-30-1 | Human | Pancreas | PDAC | 4.08e-14 | -2.47e+00 | 0.3671 |
| 2813 | GP2 | HTA12-32-1 | Human | Pancreas | PDAC | 3.70e-20 | -2.09e+00 | 0.3624 |
| 2813 | GP2 | HTA12-9-1 | Human | Pancreas | PDAC | 2.00e-73 | -2.40e+00 | 0.1532 |
| 2813 | GP2 | HTA12-9-2 | Human | Pancreas | PDAC | 1.98e-39 | -6.51e-01 | 0.0835 |
| 2813 | GP2 | HTA12-9-3 | Human | Pancreas | PDAC | 6.77e-41 | -2.47e+00 | 0.2045 |
| 2813 | GP2 | 3829-EC | Human | Pancreas | PanIN | 4.02e-44 | 1.71e-01 | 0.009 |
| 2813 | GP2 | 4347-EC | Human | Pancreas | PanIN | 2.09e-96 | -5.96e-01 | 0.0572 |
| Page: 1 2 |
| Tissue | Expression Dynamics | Abbreviation |
| Liver | 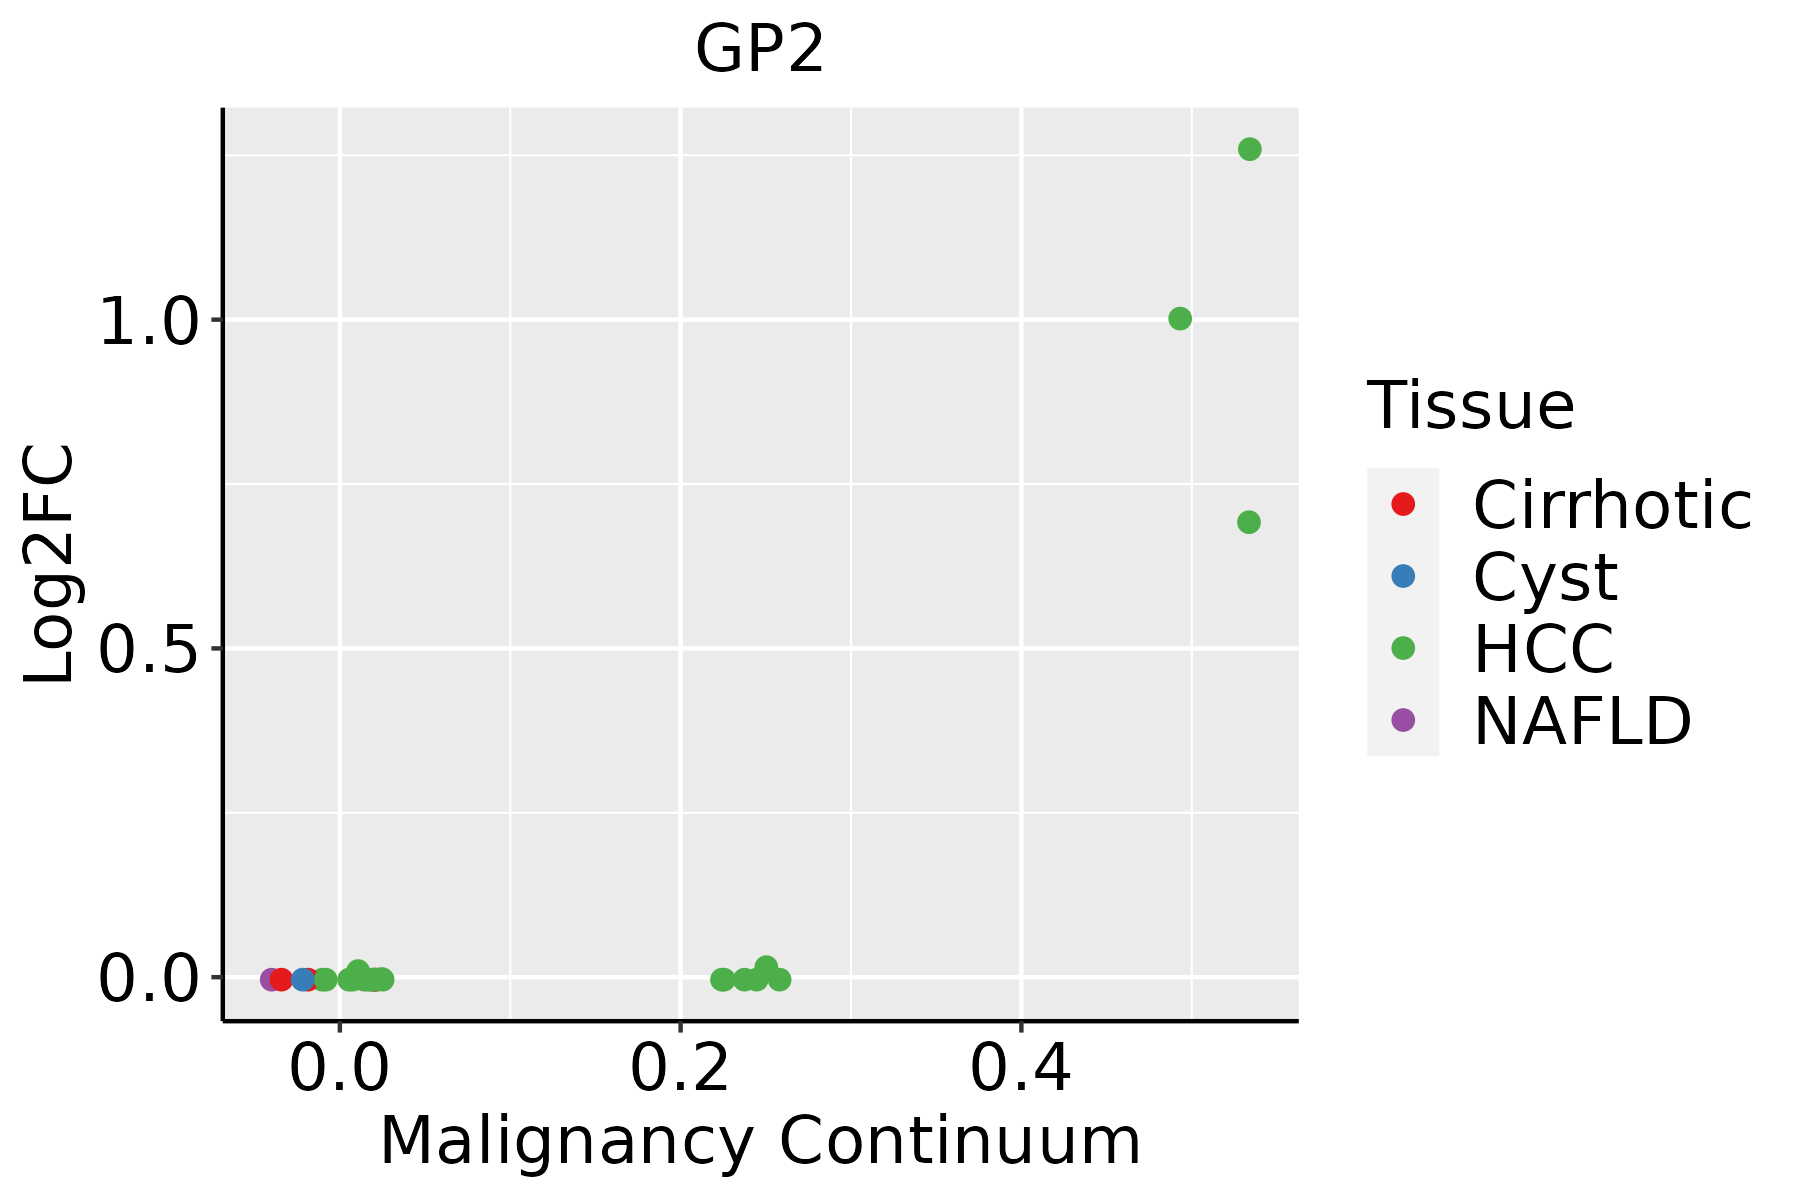 | HCC: Hepatocellular carcinoma |
| NAFLD: Non-alcoholic fatty liver disease |
| ∗log2FC in expression of this searched gene in stem-like cells from each diseased tissue sample relative to stem-like cells in normal samples in each tissue plotted against the malignancy continuum. Samples are colored based on if they are from different disease stage. |
Top |
Malignant transformation related pathway analysis |
| Find out the enriched GO biological processes and KEGG pathways involved in transition from healthy to precancer to cancer |
| Tissue | Disease Stage | Enriched GO biological Processes |
| Colorectum | AD |  |
| Colorectum | SER |  |
| Colorectum | MSS |  |
| Colorectum | MSI-H |  |
| Colorectum | FAP |  |
| ∗Top 15 enriched GO BP terms are showed in the bar plot of each disease state in each tissue. Each row represents a significant GO biological process which is colored according to the -log10(p.adjust). |
| Page: 1 2 3 4 5 6 7 8 9 |
| GO ID | Tissue | Disease Stage | Description | Gene Ratio | Bg Ratio | pvalue | p.adjust | Count |
| GO:001598012 | Liver | Cirrhotic | energy derivation by oxidation of organic compounds | 154/4634 | 318/18723 | 3.11e-20 | 8.87e-18 | 154 |
| GO:004426211 | Liver | Cirrhotic | cellular carbohydrate metabolic process | 97/4634 | 283/18723 | 1.89e-04 | 1.76e-03 | 97 |
| GO:00160511 | Liver | Cirrhotic | carbohydrate biosynthetic process | 73/4634 | 202/18723 | 1.91e-04 | 1.77e-03 | 73 |
| GO:00059771 | Liver | Cirrhotic | glycogen metabolic process | 30/4634 | 72/18723 | 1.18e-03 | 7.98e-03 | 30 |
| GO:00060731 | Liver | Cirrhotic | cellular glucan metabolic process | 30/4634 | 73/18723 | 1.53e-03 | 9.99e-03 | 30 |
| GO:00440421 | Liver | Cirrhotic | glucan metabolic process | 30/4634 | 73/18723 | 1.53e-03 | 9.99e-03 | 30 |
| GO:00061121 | Liver | Cirrhotic | energy reserve metabolic process | 31/4634 | 84/18723 | 8.75e-03 | 4.04e-02 | 31 |
| GO:000838022 | Liver | HCC | RNA splicing | 313/7958 | 434/18723 | 1.36e-36 | 1.73e-33 | 313 |
| GO:000609122 | Liver | HCC | generation of precursor metabolites and energy | 340/7958 | 490/18723 | 4.04e-34 | 2.85e-31 | 340 |
| GO:001598022 | Liver | HCC | energy derivation by oxidation of organic compounds | 221/7958 | 318/18723 | 1.02e-22 | 1.86e-20 | 221 |
| GO:004426221 | Liver | HCC | cellular carbohydrate metabolic process | 153/7958 | 283/18723 | 5.27e-05 | 5.00e-04 | 153 |
| GO:00160512 | Liver | HCC | carbohydrate biosynthetic process | 113/7958 | 202/18723 | 7.64e-05 | 6.83e-04 | 113 |
| GO:00059772 | Liver | HCC | glycogen metabolic process | 46/7958 | 72/18723 | 2.02e-04 | 1.56e-03 | 46 |
| GO:00060732 | Liver | HCC | cellular glucan metabolic process | 46/7958 | 73/18723 | 3.23e-04 | 2.28e-03 | 46 |
| GO:00440422 | Liver | HCC | glucan metabolic process | 46/7958 | 73/18723 | 3.23e-04 | 2.28e-03 | 46 |
| GO:00092254 | Liver | HCC | nucleotide-sugar metabolic process | 25/7958 | 36/18723 | 9.87e-04 | 5.71e-03 | 25 |
| GO:00059781 | Liver | HCC | glycogen biosynthetic process | 29/7958 | 44/18723 | 1.46e-03 | 7.75e-03 | 29 |
| GO:00092501 | Liver | HCC | glucan biosynthetic process | 29/7958 | 44/18723 | 1.46e-03 | 7.75e-03 | 29 |
| GO:00061122 | Liver | HCC | energy reserve metabolic process | 49/7958 | 84/18723 | 2.46e-03 | 1.19e-02 | 49 |
| GO:004505611 | Liver | HCC | transcytosis | 15/7958 | 21/18723 | 7.03e-03 | 2.80e-02 | 15 |
| Page: 1 2 3 4 5 |
| Pathway ID | Tissue | Disease Stage | Description | Gene Ratio | Bg Ratio | pvalue | p.adjust | qvalue | Count |
| Page: 1 |
Top |
Cell-cell communication analysis |
| Identification of potential cell-cell interactions between two cell types and their ligand-receptor pairs for different disease states |
| Ligand | Receptor | LRpair | Pathway | Tissue | Disease Stage |
| Page: 1 |
Top |
Single-cell gene regulatory network inference analysis |
| Find out the significant the regulons (TFs) and the target genes of each regulon across cell types for different disease states |
| TF | Cell Type | Tissue | Disease Stage | Target Gene | RSS | Regulon Activity |
| ∗The dot plots of a searched regulon are shown for all cell subpopulations in each disease state of each tissue based on the regulon specific score inferred using pySCENIC and by calculating the average expression. |
| Page: 1 |
Top |
Somatic mutation of malignant transformation related genes |
| Annotation of somatic variants for genes involved in malignant transformation |
| Hugo Symbol | Variant Class | Variant Classification | dbSNP RS | HGVSc | HGVSp | HGVSp Short | SWISSPROT | BIOTYPE | SIFT | PolyPhen | Tumor Sample Barcode | Tissue | Histology | Sex | Age | Stage | Therapy Types | Drugs | Outcome |
| GP2 | SNV | Missense_Mutation | novel | c.916G>T | p.Asp306Tyr | p.D306Y | P55259 | protein_coding | deleterious(0) | possibly_damaging(0.903) | TCGA-AN-A046-01 | Breast | breast invasive carcinoma | Female | >=65 | I/II | Unknown | Unknown | SD |
| GP2 | SNV | Missense_Mutation | c.1426N>A | p.Ser476Thr | p.S476T | P55259 | protein_coding | tolerated(0.77) | benign(0.041) | TCGA-E2-A1BD-01 | Breast | breast invasive carcinoma | Female | <65 | I/II | Hormone Therapy | arimidex | SD | |
| GP2 | SNV | Missense_Mutation | rs765756297 | c.281G>A | p.Arg94His | p.R94H | P55259 | protein_coding | deleterious(0) | probably_damaging(0.999) | TCGA-2W-A8YY-01 | Cervix | cervical & endocervical cancer | Female | <65 | I/II | Chemotherapy | cisplatin | CR |
| GP2 | SNV | Missense_Mutation | rs530327819 | c.589G>A | p.Glu197Lys | p.E197K | P55259 | protein_coding | deleterious(0.04) | benign(0.368) | TCGA-EK-A3GK-01 | Cervix | cervical & endocervical cancer | Female | <65 | I/II | Unknown | Unknown | SD |
| GP2 | SNV | Missense_Mutation | novel | c.1172C>T | p.Thr391Ile | p.T391I | P55259 | protein_coding | tolerated(0.08) | possibly_damaging(0.506) | TCGA-VS-A94Z-01 | Cervix | cervical & endocervical cancer | Female | <65 | I/II | Chemotherapy | cisplatin | CR |
| GP2 | SNV | Missense_Mutation | c.685T>G | p.Cys229Gly | p.C229G | P55259 | protein_coding | deleterious(0) | probably_damaging(1) | TCGA-A6-3809-01 | Colorectum | colon adenocarcinoma | Female | >=65 | I/II | Unknown | Unknown | SD | |
| GP2 | SNV | Missense_Mutation | c.1468N>A | p.Asp490Asn | p.D490N | P55259 | protein_coding | tolerated(0.43) | benign(0.012) | TCGA-A6-6141-01 | Colorectum | colon adenocarcinoma | Male | <65 | I/II | Chemotherapy | 5-fu | SD | |
| GP2 | SNV | Missense_Mutation | c.1468G>A | p.Asp490Asn | p.D490N | P55259 | protein_coding | tolerated(0.43) | benign(0.012) | TCGA-AA-3510-01 | Colorectum | colon adenocarcinoma | Male | >=65 | I/II | Unknown | Unknown | SD | |
| GP2 | SNV | Missense_Mutation | rs140222432 | c.122C>T | p.Ser41Leu | p.S41L | P55259 | protein_coding | deleterious(0) | benign(0.349) | TCGA-AA-3510-01 | Colorectum | colon adenocarcinoma | Male | >=65 | I/II | Unknown | Unknown | SD |
| GP2 | SNV | Missense_Mutation | c.1310N>C | p.Gln437Pro | p.Q437P | P55259 | protein_coding | tolerated(0.22) | benign(0.007) | TCGA-AA-3663-01 | Colorectum | colon adenocarcinoma | Male | <65 | I/II | Unknown | Unknown | SD |
| Page: 1 2 3 4 5 6 7 8 9 10 |
Top |
Related drugs of malignant transformation related genes |
| Identification of chemicals and drugs interact with genes involved in malignant transfromation |
| (DGIdb 4.0) |
| Entrez ID | Symbol | Category | Interaction Types | Drug Claim Name | Drug Name | PMIDs |
| Page: 1 |

Copyright 2023-Present -The University of Texas Health Science Center at Houston |