Schematic overview of the cellular and molecular mechanisms involved in the cancer progression, including the proposed cellular and molecular mechanisms in cancer cells trajectory. AT1: alveolar type 1 cells; AT2: alveolar type 2 cells; AAH: atypical adenomatous hyperplasia; AIS: adenocarcinoma in situ; MIA: minimally invasive adenocarcinoma; IA: invasive adenocarcinoma; EMT: epithelial-mesenchymal transition

Home

Download

Statistics

Help

Contact

Center for Computational Systems Medicine
leaf

Gene summary

leaf

Malignant transformation analysis

leaf

Malignant transformation related pathway analysis

leaf

Cell-cell communication analysis

leaf

Single-cell gene regulatory network inference analysis

leaf

Somatic mutation of malignant transformation related genes

leaf

Related drugs of malignant transformation related genes

Gene: GNL1

Gene summary for GNL1

check button Gene summary.

Gene informationSpeciesHuman
Gene symbol

GNL1

Gene ID

2794

Gene nameG protein nucleolar 1 (putative)
Gene AliasHSR1
Cytomap6p21.33
Gene Typeprotein-coding
GO ID

GO:0002250

UniProtAcc

A0A024RCR2


Top

Malignant transformation analysis

check button Identification of the aberrant gene expression in precancerous and cancerous lesions by comparing the gene expression of stem-like cells in diseased tissues with normal stem cells
check button Malignant transformation involving gene list.
Entrez IDSymbolReplicatesSpeciesOrganTissueAdj P-valueLog2FCMalignancy
2794GNL1LZE4THumanEsophagusESCC1.00e-143.29e-010.0811
2794GNL1LZE5THumanEsophagusESCC4.85e-046.03e-020.0514
2794GNL1LZE7THumanEsophagusESCC8.79e-053.02e-010.0667
2794GNL1LZE8THumanEsophagusESCC1.45e-081.95e-010.067
2794GNL1LZE20THumanEsophagusESCC1.83e-093.37e-020.0662
2794GNL1LZE22D1HumanEsophagusHGIN7.09e-061.29e-010.0595
2794GNL1LZE22THumanEsophagusESCC3.05e-035.50e-010.068
2794GNL1LZE24THumanEsophagusESCC6.24e-226.59e-010.0596
2794GNL1LZE21THumanEsophagusESCC3.21e-053.00e-010.0655
2794GNL1LZE6THumanEsophagusESCC3.53e-072.69e-010.0845
2794GNL1P1T-EHumanEsophagusESCC3.10e-086.85e-010.0875
2794GNL1P2T-EHumanEsophagusESCC1.17e-499.18e-010.1177
2794GNL1P4T-EHumanEsophagusESCC1.88e-267.26e-010.1323
2794GNL1P5T-EHumanEsophagusESCC1.45e-122.09e-010.1327
2794GNL1P8T-EHumanEsophagusESCC6.16e-294.74e-010.0889
2794GNL1P9T-EHumanEsophagusESCC2.40e-123.64e-010.1131
2794GNL1P10T-EHumanEsophagusESCC7.22e-163.84e-010.116
2794GNL1P11T-EHumanEsophagusESCC7.84e-177.26e-010.1426
2794GNL1P12T-EHumanEsophagusESCC9.69e-315.84e-010.1122
2794GNL1P15T-EHumanEsophagusESCC7.54e-225.12e-010.1149
Page: 1 2 3 4 5 6 

check button Transcriptomic changes along malignancy continuum.
TissueExpression DynamicsAbbreviation
EsophagusThe image shows the transcriptomic changes along malignancy continuum.log2FC in expression of this searched gene in stem-like cells from each diseased tissue sample relative to stem-like cells in normal samples in each tissue plotted against the malignancy continuum. Samples are colored based on if they are from different disease stage.
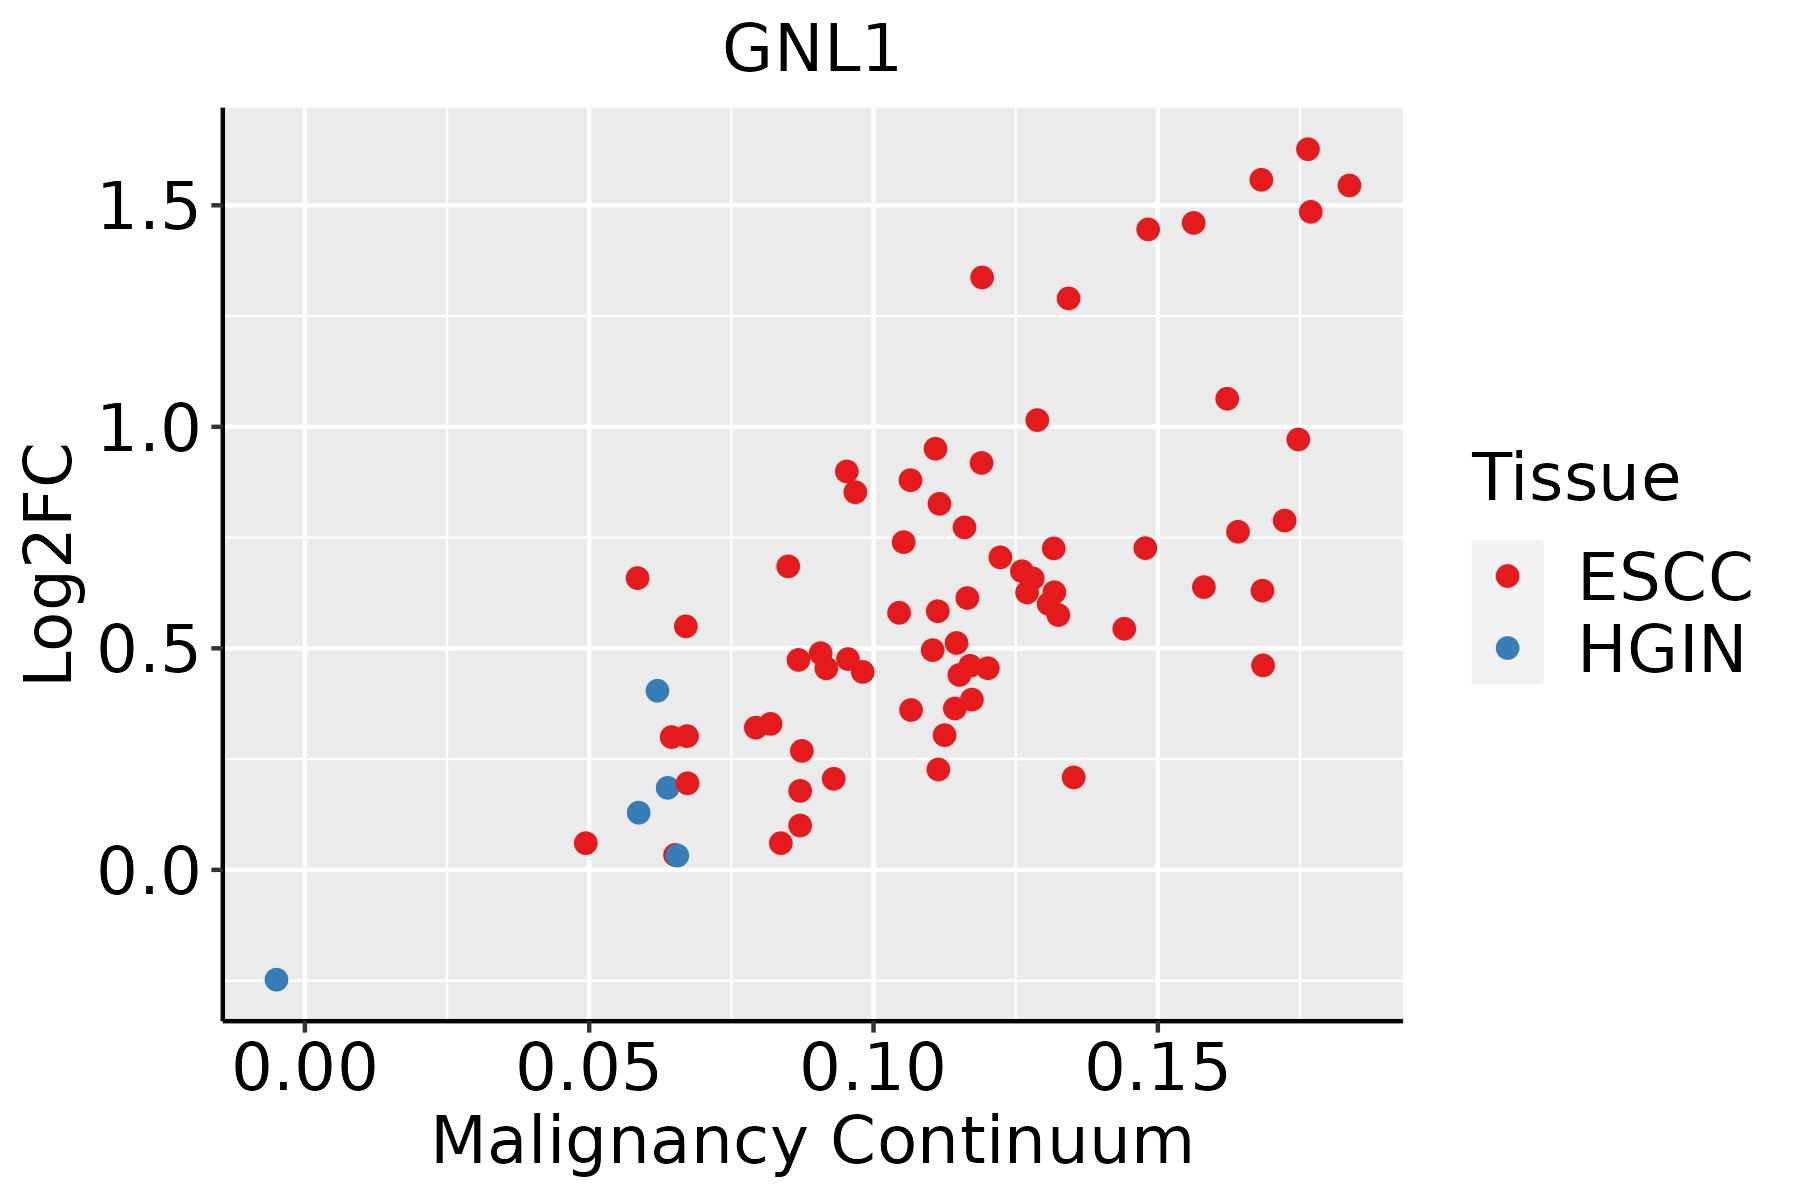
ESCC: Esophageal squamous cell carcinoma
HGIN: High-grade intraepithelial neoplasias
LGIN: Low-grade intraepithelial neoplasias
LiverThe image shows the transcriptomic changes along malignancy continuum.log2FC in expression of this searched gene in stem-like cells from each diseased tissue sample relative to stem-like cells in normal samples in each tissue plotted against the malignancy continuum. Samples are colored based on if they are from different disease stage.
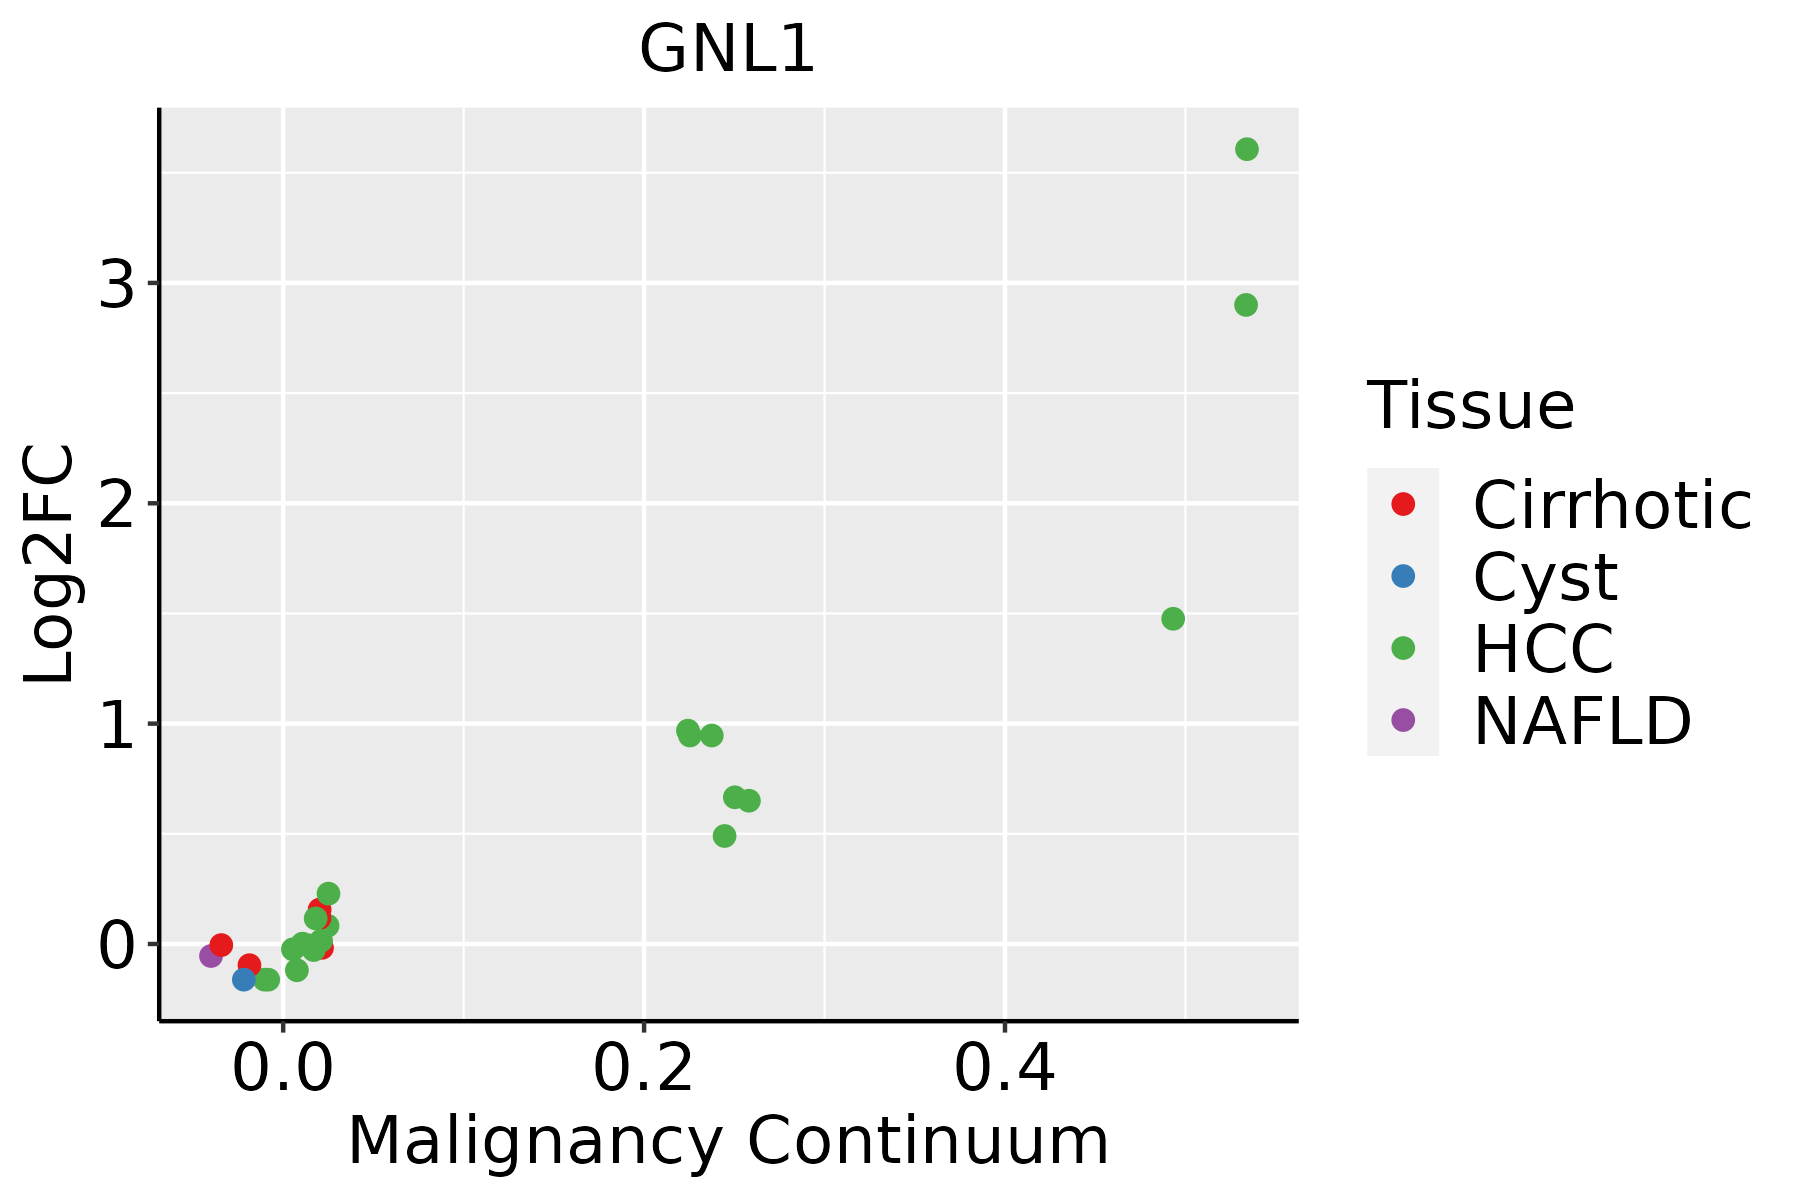
HCC: Hepatocellular carcinoma
NAFLD: Non-alcoholic fatty liver disease
Oral CavityThe image shows the transcriptomic changes along malignancy continuum.log2FC in expression of this searched gene in stem-like cells from each diseased tissue sample relative to stem-like cells in normal samples in each tissue plotted against the malignancy continuum. Samples are colored based on if they are from different disease stage.
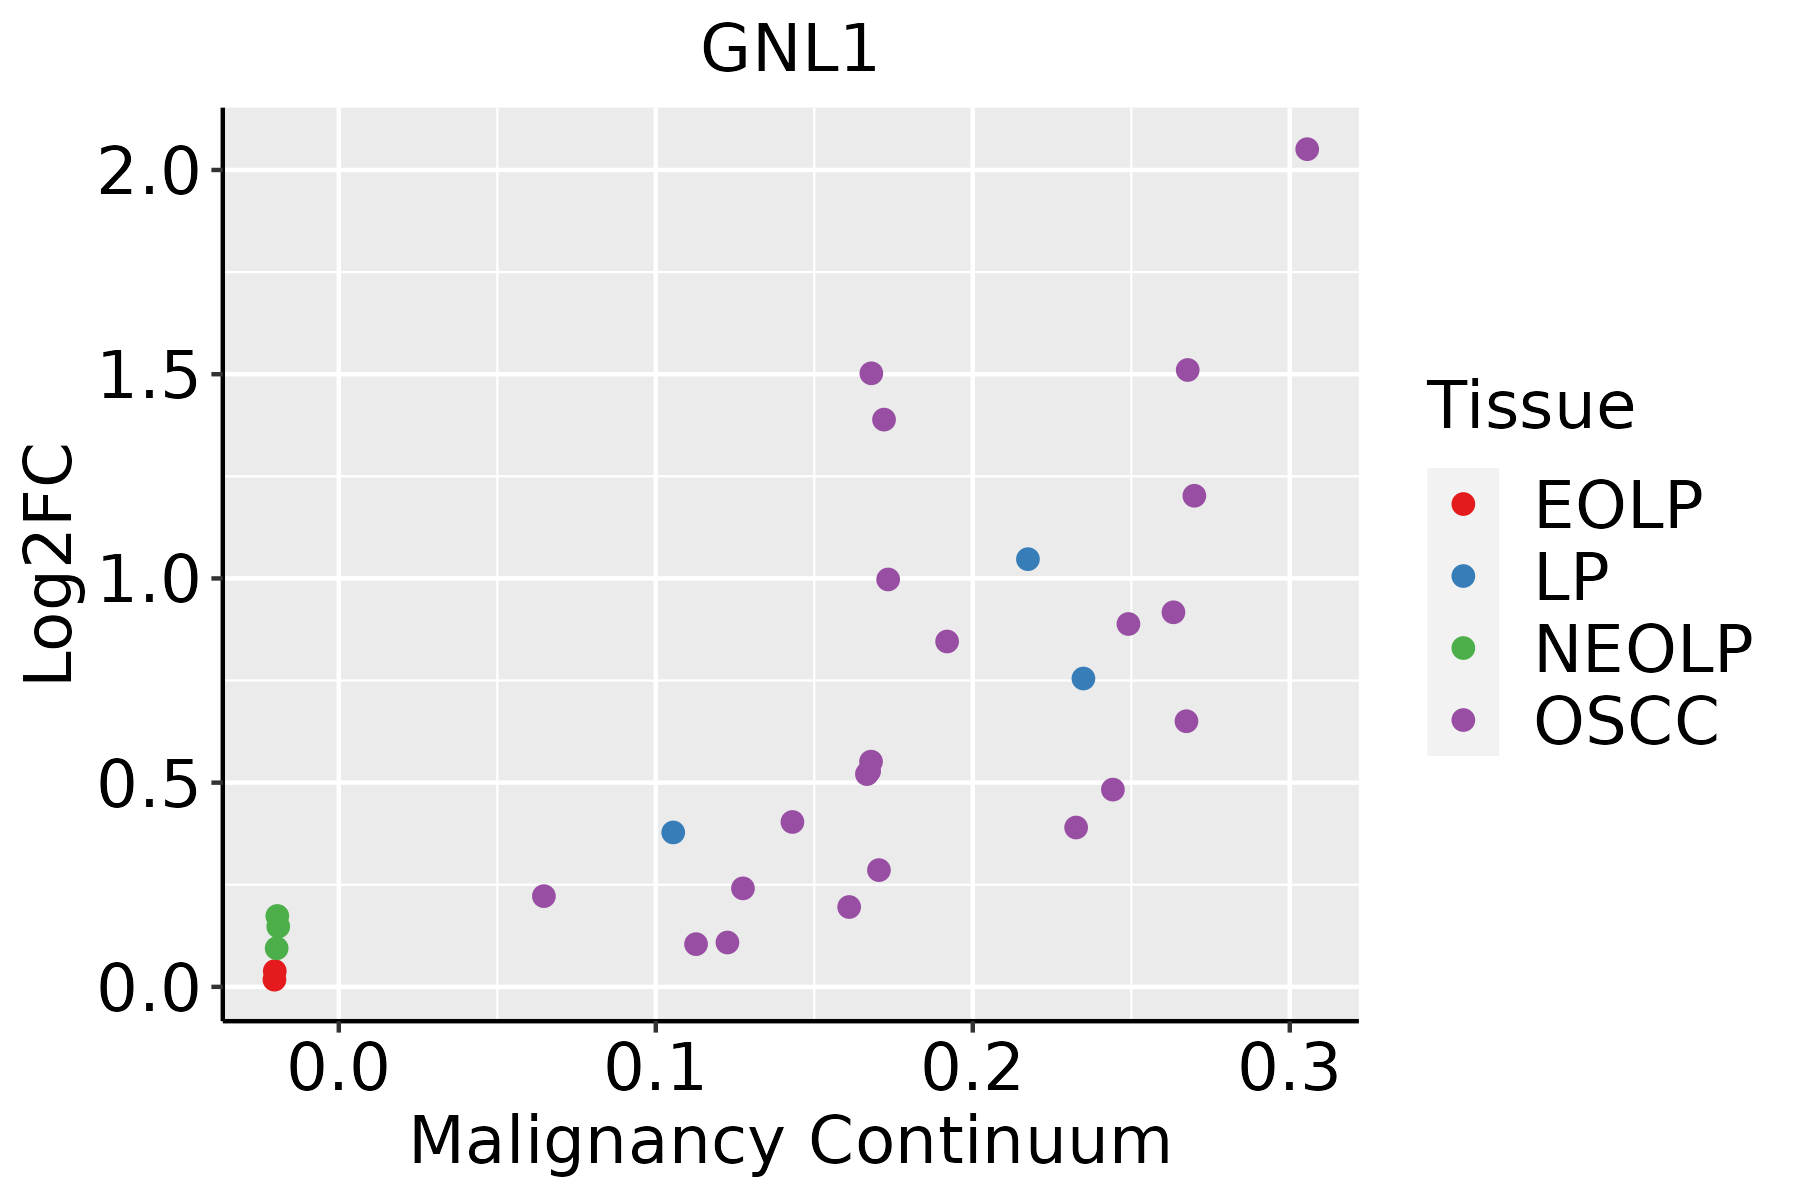
EOLP: Erosive Oral lichen planus
LP: leukoplakia
NEOLP: Non-erosive oral lichen planus
OSCC: Oral squamous cell carcinoma
SkinThe image shows the transcriptomic changes along malignancy continuum.log2FC in expression of this searched gene in stem-like cells from each diseased tissue sample relative to stem-like cells in normal samples in each tissue plotted against the malignancy continuum. Samples are colored based on if they are from different disease stage.AK: Actinic keratosis
cSCC: Cutaneous squamous cell carcinoma
SCCIS:squamous cell carcinoma in situ
ThyroidThe image shows the transcriptomic changes along malignancy continuum.log2FC in expression of this searched gene in stem-like cells from each diseased tissue sample relative to stem-like cells in normal samples in each tissue plotted against the malignancy continuum. Samples are colored based on if they are from different disease stage.
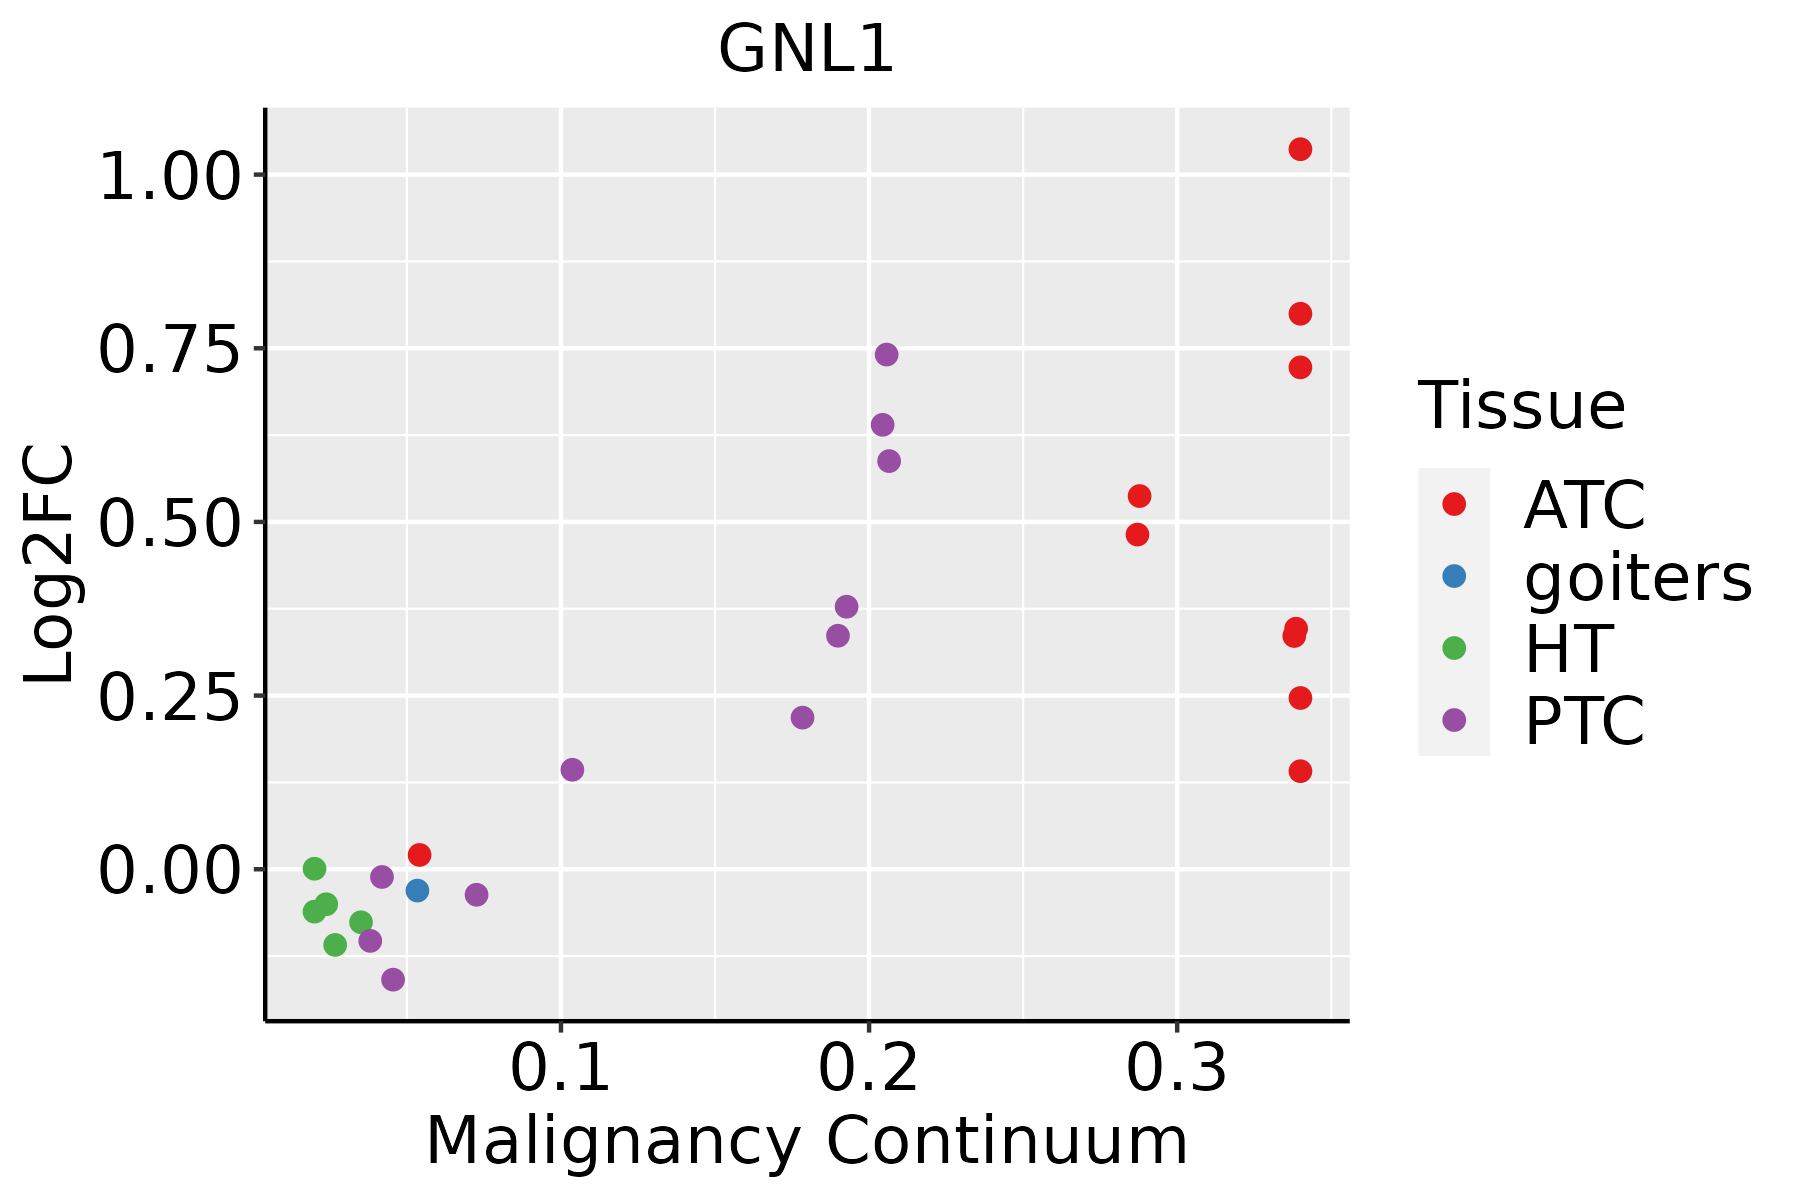
ATC: Anaplastic thyroid cancer
HT: Hashimoto's thyroiditis
PTC: Papillary thyroid cancer
∗log2FC in expression of this searched gene in stem-like cells from each diseased tissue sample relative to stem-like cells in normal samples in each tissue plotted against the malignancy continuum. Samples are colored based on if they are from different disease stage.

Top

Malignant transformation related pathway analysis

check buttonFind out the enriched GO biological processes and KEGG pathways involved in transition from healthy to precancer to cancer
check button Figure of enriched GO biological processes.
TissueDisease StageEnriched GO biological Processes
ColorectumADGO analysis - Figure of enriched GO biological processes: Top 15 enriched GO BP terms are showed in the bar plot of each disease state in each tissue. Each row represents a significant GO biological process which is colored according to the -log10(p.adjust).
ColorectumSERGO analysis - Figure of enriched GO biological processes: Top 15 enriched GO BP terms are showed in the bar plot of each disease state in each tissue. Each row represents a significant GO biological process which is colored according to the -log10(p.adjust).
ColorectumMSSGO analysis - Figure of enriched GO biological processes: Top 15 enriched GO BP terms are showed in the bar plot of each disease state in each tissue. Each row represents a significant GO biological process which is colored according to the -log10(p.adjust).
ColorectumMSI-HGO analysis - Figure of enriched GO biological processes: Top 15 enriched GO BP terms are showed in the bar plot of each disease state in each tissue. Each row represents a significant GO biological process which is colored according to the -log10(p.adjust).
ColorectumFAPGO analysis - Figure of enriched GO biological processes: Top 15 enriched GO BP terms are showed in the bar plot of each disease state in each tissue. Each row represents a significant GO biological process which is colored according to the -log10(p.adjust).
∗Top 15 enriched GO BP terms are showed in the bar plot of each disease state in each tissue. Each row represents a significant GO biological process which is colored according to the -log10(p.adjust).
Page: 1 2 3 4 5 6 7 8 9 

check button Enriched GO biological processes.
GO IDTissueDisease StageDescriptionGene RatioBg Ratiopvaluep.adjustCount
GO:015010511LiverHCCprotein localization to cell-cell junction17/795821/187233.71e-042.56e-0317
GO:190290412LiverHCCnegative regulation of supramolecular fiber organization90/7958167/187231.90e-039.69e-0390
GO:003003822LiverHCCcontractile actin filament bundle assembly60/7958106/187232.34e-031.16e-0260
GO:004314922LiverHCCstress fiber assembly60/7958106/187232.34e-031.16e-0260
GO:003223122LiverHCCregulation of actin filament bundle assembly57/7958105/187239.73e-033.66e-0257
GO:00514946LiverHCCnegative regulation of cytoskeleton organization84/7958163/187231.22e-024.43e-0284
GO:011002022LiverHCCregulation of actomyosin structure organization54/7958100/187231.33e-024.76e-0254
GO:00510565LungIACregulation of small GTPase mediated signal transduction70/2061302/187239.44e-101.87e-0770
GO:00070158LungIACactin filament organization92/2061442/187231.01e-091.93e-0792
GO:00510178LungIACactin filament bundle assembly40/2061157/187232.66e-072.14e-0540
GO:00310327LungIACactomyosin structure organization46/2061196/187234.70e-073.10e-0546
GO:00329708LungIACregulation of actin filament-based process77/2061397/187234.85e-073.10e-0577
GO:00615728LungIACactin filament bundle organization40/2061161/187235.43e-073.32e-0540
GO:00329568LungIACregulation of actin cytoskeleton organization70/2061358/187231.17e-066.20e-0570
GO:00106398LungIACnegative regulation of organelle organization68/2061348/187231.69e-068.24e-0568
GO:19029038LungIACregulation of supramolecular fiber organization73/2061383/187231.87e-068.87e-0573
GO:00514947LungIACnegative regulation of cytoskeleton organization38/2061163/187235.35e-062.08e-0438
GO:00322318LungIACregulation of actin filament bundle assembly28/2061105/187236.21e-062.30e-0428
GO:00300388LungIACcontractile actin filament bundle assembly28/2061106/187237.56e-062.64e-0428
GO:00431498LungIACstress fiber assembly28/2061106/187237.56e-062.64e-0428
Page: 1 2 3 4 5 6 7 

check button Enriched KEGG pathways.
Pathway IDTissueDisease StageDescriptionGene RatioBg Ratiopvaluep.adjustqvalueCount
Page: 1 

Top

Cell-cell communication analysis

check buttonIdentification of potential cell-cell interactions between two cell types and their ligand-receptor pairs for different disease states
LigandReceptorLRpairPathwayTissueDisease Stage
Page: 1 

Top

Single-cell gene regulatory network inference analysis

check buttonFind out the significant the regulons (TFs) and the target genes of each regulon across cell types for different disease states
TFCell TypeTissueDisease StageTarget GeneRSSRegulon Activity
∗The dot plots of a searched regulon are shown for all cell subpopulations in each disease state of each tissue based on the regulon specific score inferred using pySCENIC and by calculating the average expression.
Page: 1 

Top

Somatic mutation of malignant transformation related genes

check buttonAnnotation of somatic variants for genes involved in malignant transformation
Hugo SymbolVariant ClassVariant ClassificationdbSNP RSHGVScHGVSpHGVSp ShortSWISSPROTBIOTYPESIFTPolyPhenTumor Sample BarcodeTissueHistologySexAgeStageTherapy TypesDrugsOutcome
GNL1SNVMissense_Mutationnovelc.775N>Tp.Arg259Trpp.R259WP36915protein_codingdeleterious(0.02)possibly_damaging(0.446)TCGA-5L-AAT1-01Breastbreast invasive carcinomaFemale<65III/IVHormone TherapyletrozolSD
GNL1insertionIn_Frame_Insnovelc.1469_1470insTTCTCTCCTCTTCTCCCTTCTTTTTTCATGCATTCTp.Thr490_Ala491insSerLeuLeuPheSerLeuLeuPheSerCysIleLeup.T490_A491insSLLFSLLFSCILP36915protein_codingTCGA-A7-A0CJ-01Breastbreast invasive carcinomaFemale<65I/IIChemotherapycytoxanSD
GNL1insertionNonsense_Mutationnovelc.1381_1382insTGTTCAGCAATCTGCACATAGGAAGTTGAATGAATGGATGAATGp.His461LeufsTer10p.H461Lfs*10P36915protein_codingTCGA-A8-A06O-01Breastbreast invasive carcinomaFemale<65I/IIHormone TherapyletrozoleSD
GNL1insertionFrame_Shift_Insnovelc.540_541insGGACCGAGACATCCAGAGCAATCp.Leu181GlyfsTer13p.L181Gfs*13P36915protein_codingTCGA-A8-A08B-01Breastbreast invasive carcinomaFemale<65I/IIChemotherapy5-fluorouracilCR
GNL1SNVMissense_Mutationrs758752898c.904G>Ap.Val302Metp.V302MP36915protein_codingdeleterious(0)probably_damaging(0.993)TCGA-2W-A8YY-01Cervixcervical & endocervical cancerFemale<65I/IIChemotherapycisplatinCR
GNL1SNVMissense_Mutationnovelc.775C>Tp.Arg259Trpp.R259WP36915protein_codingdeleterious(0.02)possibly_damaging(0.446)TCGA-2W-A8YY-01Cervixcervical & endocervical cancerFemale<65I/IIChemotherapycisplatinCR
GNL1SNVMissense_Mutationc.1438N>Ap.Glu480Lysp.E480KP36915protein_codingdeleterious(0.01)benign(0.054)TCGA-C5-A7CM-01Cervixcervical & endocervical cancerFemale<65I/IIChemotherapycisplatinSD
GNL1SNVMissense_Mutationc.494C>Tp.Ser165Phep.S165FP36915protein_codingdeleterious(0.04)benign(0.037)TCGA-DR-A0ZM-01Cervixcervical & endocervical cancerFemale<65III/IVUnspecificCisplatinSD
GNL1SNVMissense_Mutationc.449G>Ap.Arg150Glnp.R150QP36915protein_codingtolerated(0.18)benign(0.029)TCGA-AA-3494-01Colorectumcolon adenocarcinomaMale<65III/IVChemotherapyfolinicPR
GNL1SNVMissense_Mutationrs757866378c.824N>Ap.Arg275Glnp.R275QP36915protein_codingdeleterious(0.01)benign(0.278)TCGA-AA-3966-01Colorectumcolon adenocarcinomaFemale>=65I/IIUnknownUnknownSD
Page: 1 2 3 4 5 

Top

Related drugs of malignant transformation related genes

check buttonIdentification of chemicals and drugs interact with genes involved in malignant transfromation
(DGIdb 4.0)
Entrez IDSymbolCategoryInteraction TypesDrug Claim NameDrug NamePMIDs
Page: 1