
|
|||||
|
 | |
| |
| |
| |
| |
| |
|
Gene: GNA12 |
Gene summary for GNA12 |
| Gene information | Species | Human | Gene symbol | GNA12 | Gene ID | 2768 |
| Gene name | G protein subunit alpha 12 | |
| Gene Alias | NNX3 | |
| Cytomap | 7p22.3-p22.2 | |
| Gene Type | protein-coding | GO ID | GO:0001667 | UniProtAcc | E9PC54 |
Top |
Malignant transformation analysis |
| Identification of the aberrant gene expression in precancerous and cancerous lesions by comparing the gene expression of stem-like cells in diseased tissues with normal stem cells |
| Entrez ID | Symbol | Replicates | Species | Organ | Tissue | Adj P-value | Log2FC | Malignancy |
| 2768 | GNA12 | LZE24T | Human | Esophagus | ESCC | 4.20e-05 | 8.68e-02 | 0.0596 |
| 2768 | GNA12 | P2T-E | Human | Esophagus | ESCC | 2.15e-05 | 1.28e-01 | 0.1177 |
| 2768 | GNA12 | P4T-E | Human | Esophagus | ESCC | 6.16e-10 | 2.38e-01 | 0.1323 |
| 2768 | GNA12 | P5T-E | Human | Esophagus | ESCC | 4.94e-08 | 1.15e-01 | 0.1327 |
| 2768 | GNA12 | P10T-E | Human | Esophagus | ESCC | 1.84e-04 | 1.27e-01 | 0.116 |
| 2768 | GNA12 | P11T-E | Human | Esophagus | ESCC | 5.08e-05 | 1.66e-01 | 0.1426 |
| 2768 | GNA12 | P12T-E | Human | Esophagus | ESCC | 2.66e-05 | 8.00e-02 | 0.1122 |
| 2768 | GNA12 | P15T-E | Human | Esophagus | ESCC | 2.33e-06 | 1.34e-01 | 0.1149 |
| 2768 | GNA12 | P16T-E | Human | Esophagus | ESCC | 3.61e-02 | 5.81e-02 | 0.1153 |
| 2768 | GNA12 | P17T-E | Human | Esophagus | ESCC | 2.94e-03 | 1.81e-01 | 0.1278 |
| 2768 | GNA12 | P21T-E | Human | Esophagus | ESCC | 8.63e-04 | 1.46e-01 | 0.1617 |
| 2768 | GNA12 | P22T-E | Human | Esophagus | ESCC | 6.37e-08 | 8.22e-02 | 0.1236 |
| 2768 | GNA12 | P26T-E | Human | Esophagus | ESCC | 2.50e-02 | 4.91e-02 | 0.1276 |
| 2768 | GNA12 | P27T-E | Human | Esophagus | ESCC | 4.42e-06 | 8.36e-02 | 0.1055 |
| 2768 | GNA12 | P28T-E | Human | Esophagus | ESCC | 1.98e-07 | 1.64e-01 | 0.1149 |
| 2768 | GNA12 | P30T-E | Human | Esophagus | ESCC | 2.54e-03 | 2.14e-01 | 0.137 |
| 2768 | GNA12 | P31T-E | Human | Esophagus | ESCC | 5.40e-05 | 1.57e-01 | 0.1251 |
| 2768 | GNA12 | P32T-E | Human | Esophagus | ESCC | 5.92e-14 | 2.66e-01 | 0.1666 |
| 2768 | GNA12 | P37T-E | Human | Esophagus | ESCC | 4.71e-22 | 5.04e-01 | 0.1371 |
| 2768 | GNA12 | P40T-E | Human | Esophagus | ESCC | 1.47e-04 | 1.91e-01 | 0.109 |
| Page: 1 2 3 4 5 |
| Tissue | Expression Dynamics | Abbreviation |
| Esophagus |  | ESCC: Esophageal squamous cell carcinoma |
| HGIN: High-grade intraepithelial neoplasias | ||
| LGIN: Low-grade intraepithelial neoplasias | ||
| Liver | 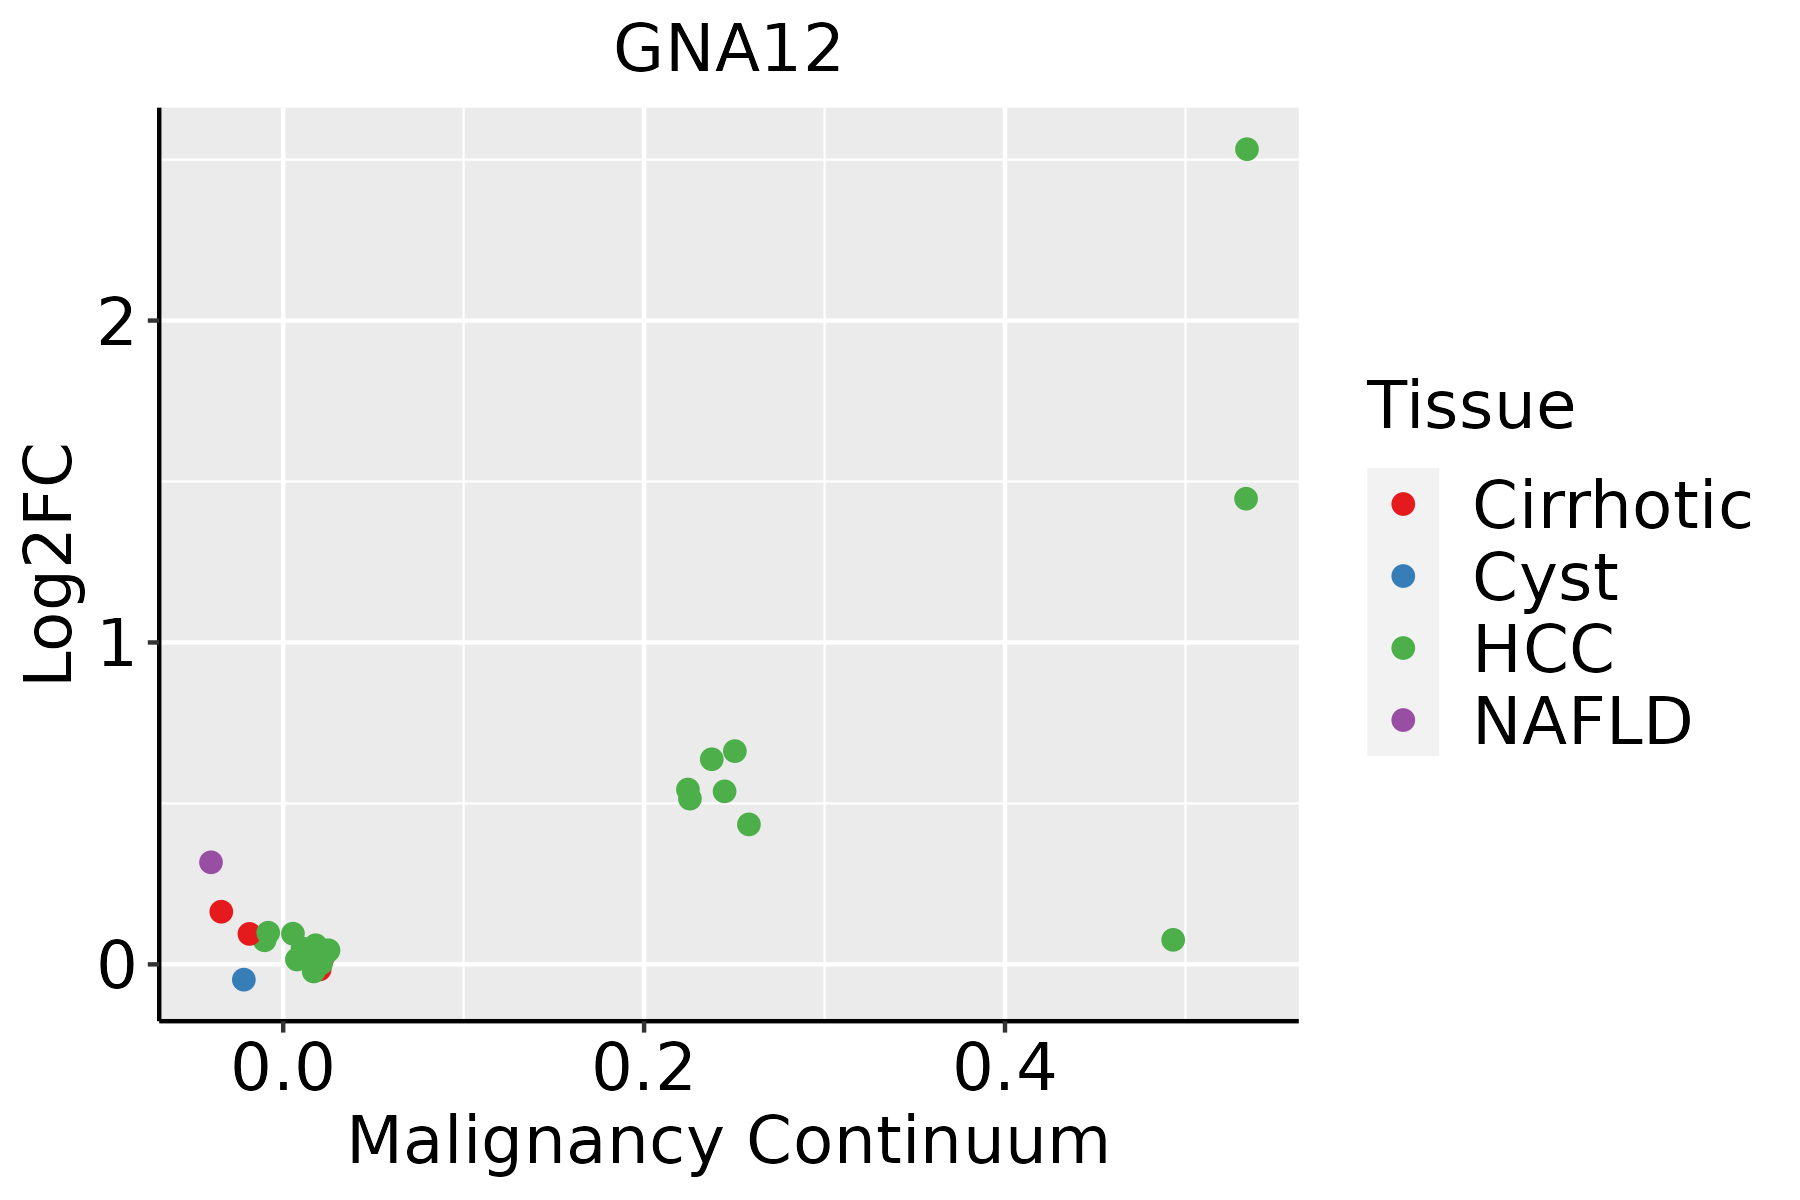 | HCC: Hepatocellular carcinoma |
| NAFLD: Non-alcoholic fatty liver disease | ||
| Oral Cavity | 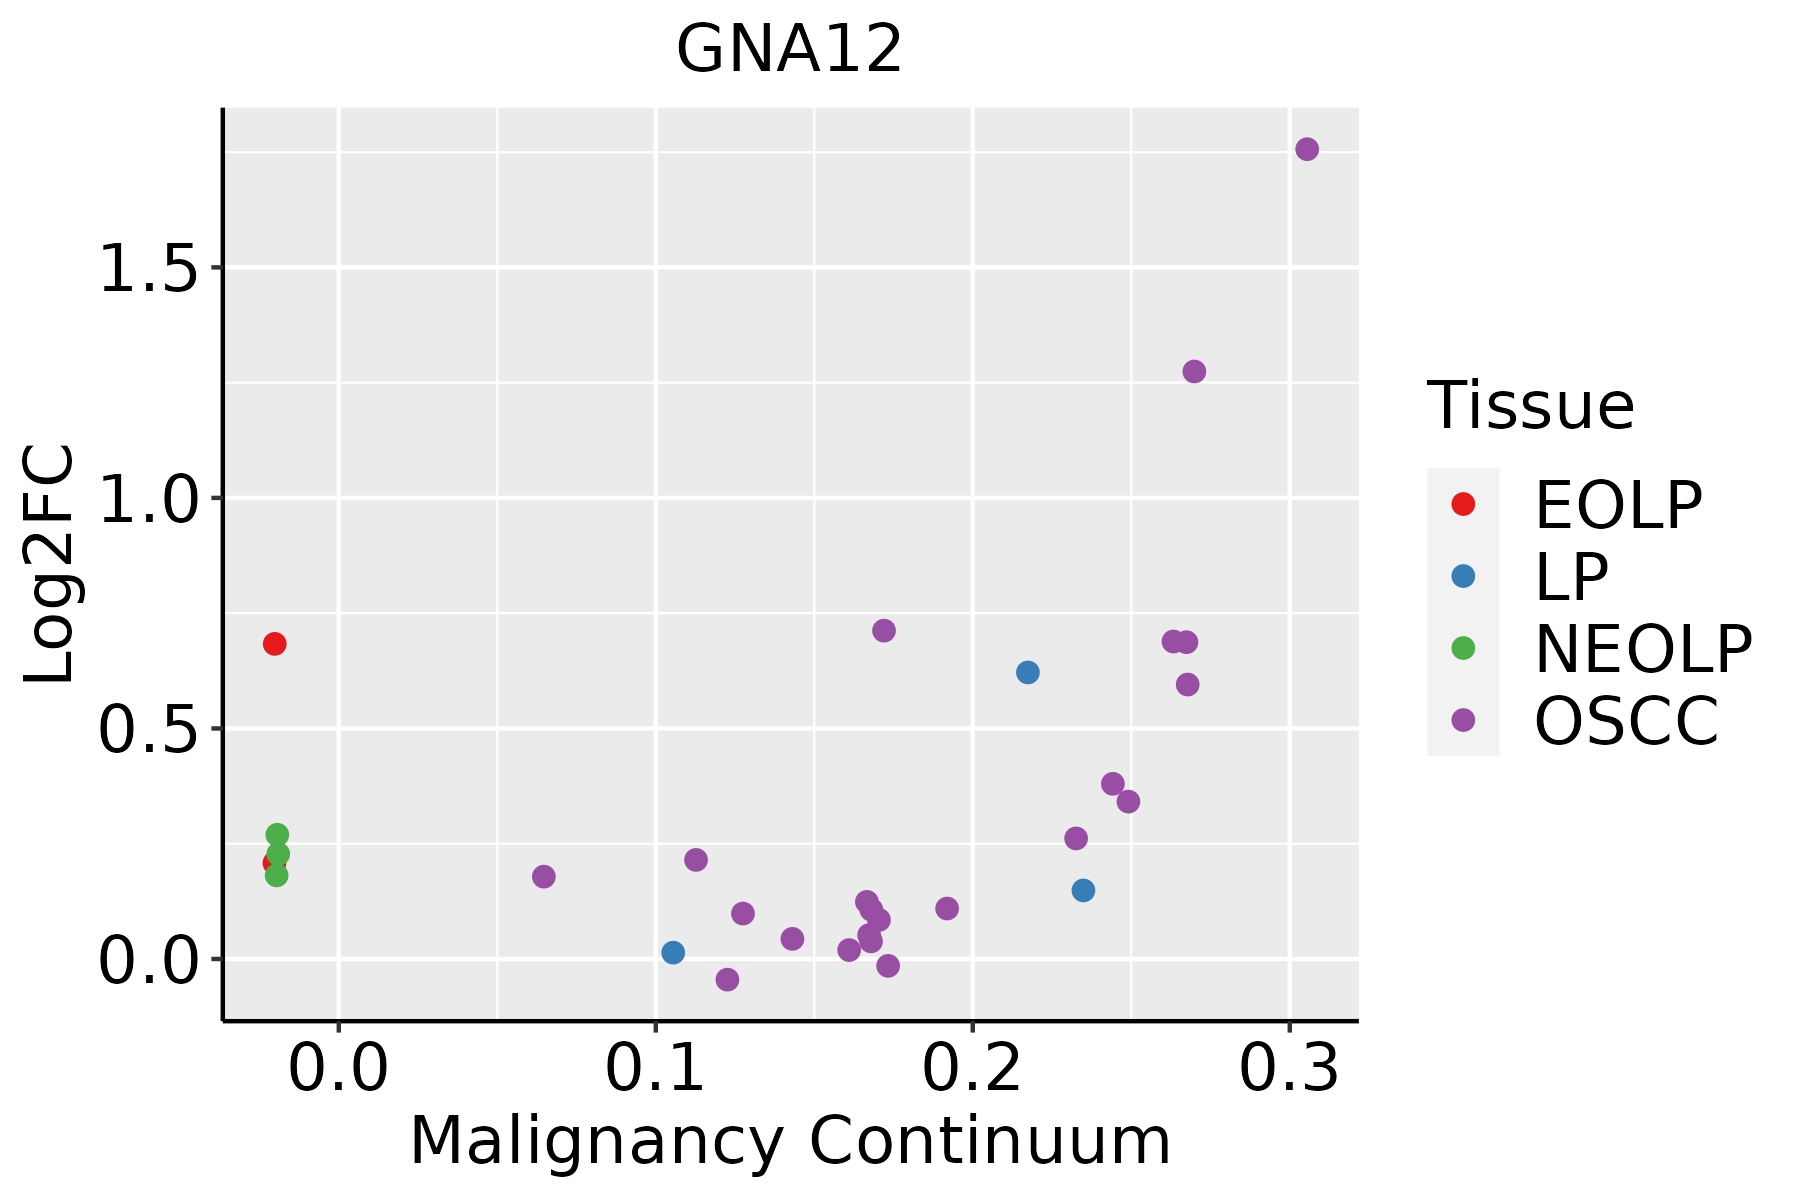 | EOLP: Erosive Oral lichen planus |
| LP: leukoplakia | ||
| NEOLP: Non-erosive oral lichen planus | ||
| OSCC: Oral squamous cell carcinoma | ||
| Thyroid | 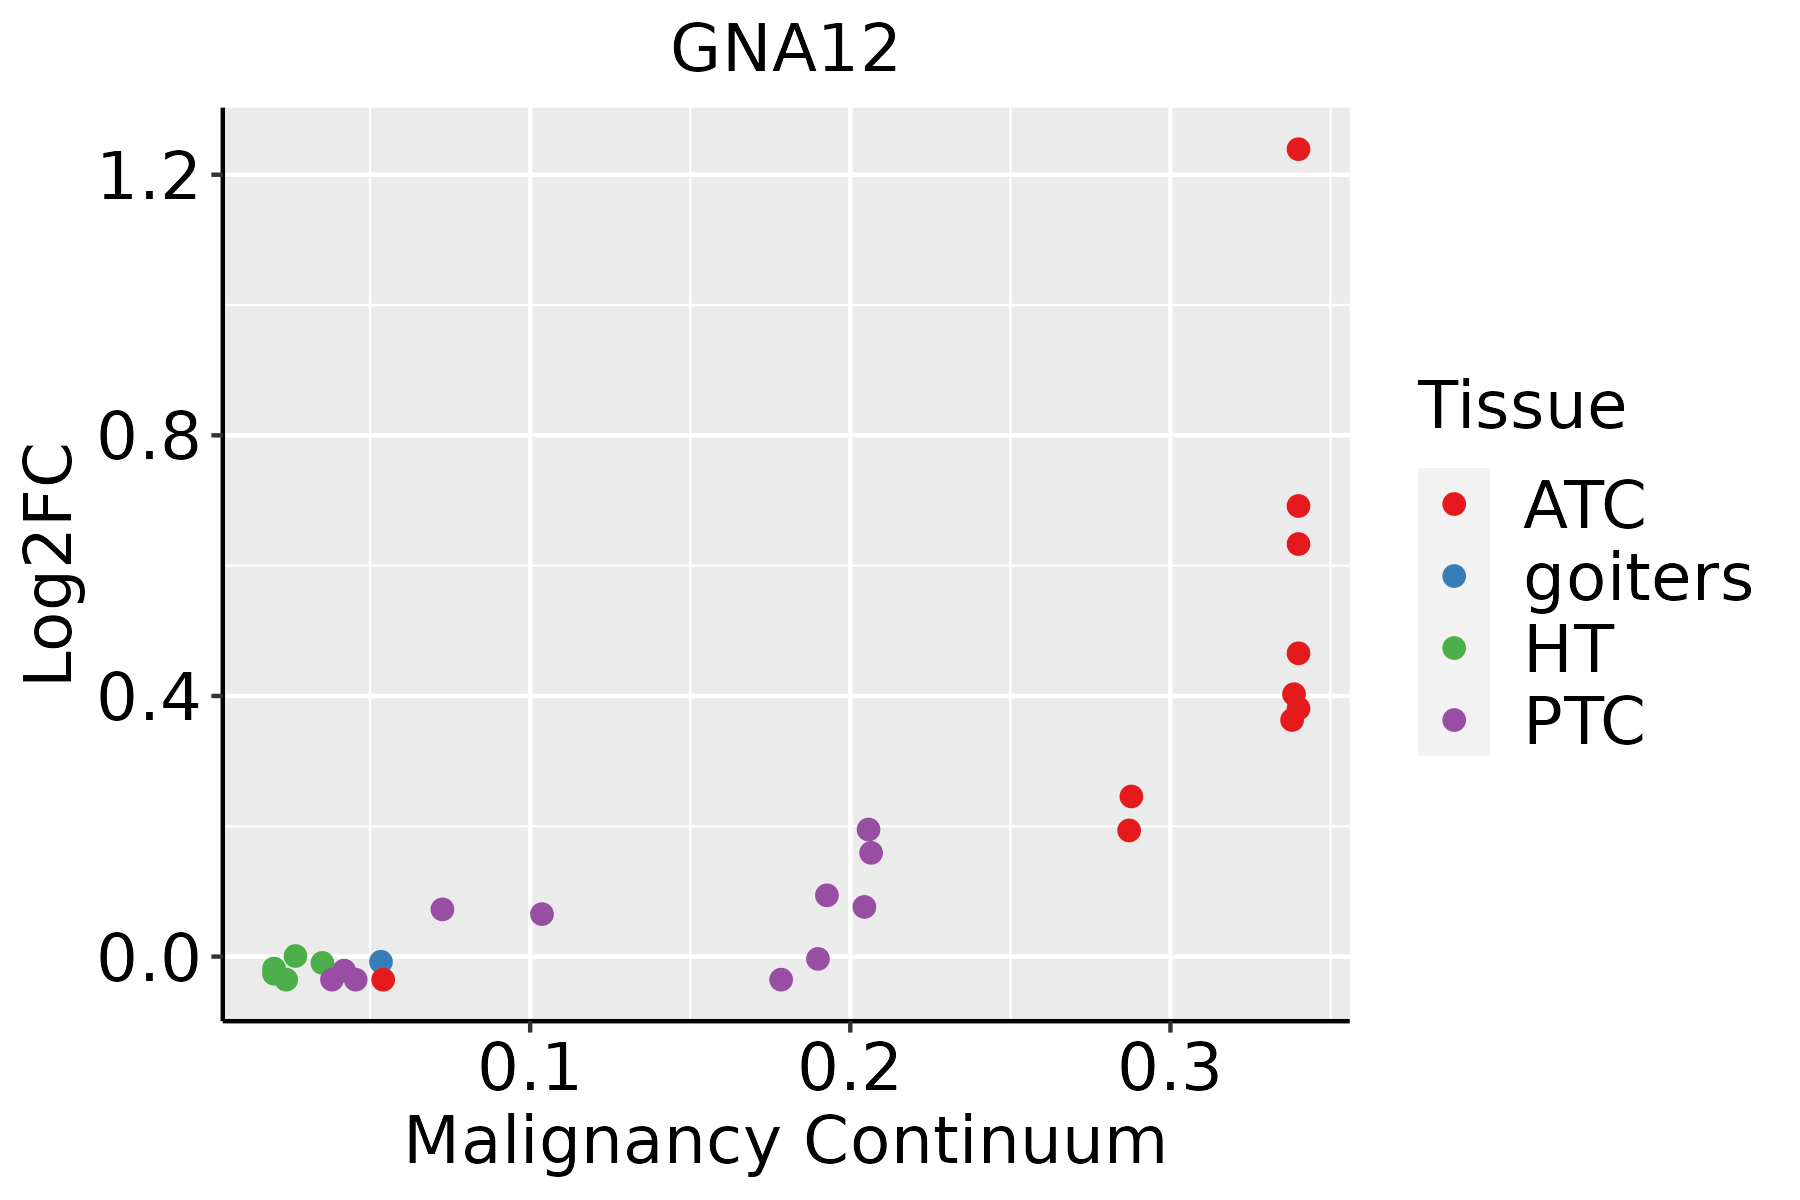 | ATC: Anaplastic thyroid cancer |
| HT: Hashimoto's thyroiditis | ||
| PTC: Papillary thyroid cancer |
| ∗log2FC in expression of this searched gene in stem-like cells from each diseased tissue sample relative to stem-like cells in normal samples in each tissue plotted against the malignancy continuum. Samples are colored based on if they are from different disease stage. |
Top |
Malignant transformation related pathway analysis |
| Find out the enriched GO biological processes and KEGG pathways involved in transition from healthy to precancer to cancer |
| Tissue | Disease Stage | Enriched GO biological Processes |
| Colorectum | AD |  |
| Colorectum | SER |  |
| Colorectum | MSS |  |
| Colorectum | MSI-H |  |
| Colorectum | FAP |  |
| ∗Top 15 enriched GO BP terms are showed in the bar plot of each disease state in each tissue. Each row represents a significant GO biological process which is colored according to the -log10(p.adjust). |
| Page: 1 2 3 4 5 6 7 8 9 |
| GO ID | Tissue | Disease Stage | Description | Gene Ratio | Bg Ratio | pvalue | p.adjust | Count |
| GO:004217622 | Liver | HCC | regulation of protein catabolic process | 267/7958 | 391/18723 | 2.45e-25 | 7.38e-23 | 267 |
| GO:190336222 | Liver | HCC | regulation of cellular protein catabolic process | 182/7958 | 255/18723 | 5.91e-21 | 8.52e-19 | 182 |
| GO:190305022 | Liver | HCC | regulation of proteolysis involved in cellular protein catabolic process | 157/7958 | 221/18723 | 5.93e-18 | 6.83e-16 | 157 |
| GO:006113622 | Liver | HCC | regulation of proteasomal protein catabolic process | 134/7958 | 187/18723 | 5.03e-16 | 4.09e-14 | 134 |
| GO:200005822 | Liver | HCC | regulation of ubiquitin-dependent protein catabolic process | 120/7958 | 164/18723 | 1.31e-15 | 9.74e-14 | 120 |
| GO:003243422 | Liver | HCC | regulation of proteasomal ubiquitin-dependent protein catabolic process | 100/7958 | 134/18723 | 3.67e-14 | 2.32e-12 | 100 |
| GO:000941022 | Liver | HCC | response to xenobiotic stimulus | 248/7958 | 462/18723 | 6.47e-07 | 1.02e-05 | 248 |
| GO:000726521 | Liver | HCC | Ras protein signal transduction | 187/7958 | 337/18723 | 8.89e-07 | 1.35e-05 | 187 |
| GO:00319291 | Liver | HCC | TOR signaling | 78/7958 | 126/18723 | 8.49e-06 | 9.97e-05 | 78 |
| GO:004206022 | Liver | HCC | wound healing | 219/7958 | 422/18723 | 5.34e-05 | 5.04e-04 | 219 |
| GO:00107612 | Liver | HCC | fibroblast migration | 33/7958 | 47/18723 | 1.12e-04 | 9.50e-04 | 33 |
| GO:0032006 | Liver | HCC | regulation of TOR signaling | 63/7958 | 104/18723 | 1.50e-04 | 1.20e-03 | 63 |
| GO:00075962 | Liver | HCC | blood coagulation | 118/7958 | 217/18723 | 2.63e-04 | 1.94e-03 | 118 |
| GO:00075992 | Liver | HCC | hemostasis | 119/7958 | 222/18723 | 5.25e-04 | 3.41e-03 | 119 |
| GO:00508172 | Liver | HCC | coagulation | 118/7958 | 222/18723 | 8.41e-04 | 5.03e-03 | 118 |
| GO:005087822 | Liver | HCC | regulation of body fluid levels | 191/7958 | 379/18723 | 1.06e-03 | 6.11e-03 | 191 |
| GO:000726621 | Liver | HCC | Rho protein signal transduction | 76/7958 | 137/18723 | 1.46e-03 | 7.75e-03 | 76 |
| GO:0010762 | Liver | HCC | regulation of fibroblast migration | 24/7958 | 36/18723 | 2.95e-03 | 1.38e-02 | 24 |
| GO:000166721 | Liver | HCC | ameboidal-type cell migration | 226/7958 | 475/18723 | 1.35e-02 | 4.81e-02 | 226 |
| GO:001049820 | Oral cavity | OSCC | proteasomal protein catabolic process | 336/7305 | 490/18723 | 5.45e-41 | 8.63e-38 | 336 |
| Page: 1 2 3 4 5 6 7 8 9 10 |
| Pathway ID | Tissue | Disease Stage | Description | Gene Ratio | Bg Ratio | pvalue | p.adjust | qvalue | Count |
| hsa05130211 | Esophagus | ESCC | Pathogenic Escherichia coli infection | 142/4205 | 197/8465 | 8.21e-11 | 1.06e-09 | 5.42e-10 | 142 |
| hsa05163210 | Esophagus | ESCC | Human cytomegalovirus infection | 148/4205 | 225/8465 | 5.73e-07 | 4.00e-06 | 2.05e-06 | 148 |
| hsa0407116 | Esophagus | ESCC | Sphingolipid signaling pathway | 85/4205 | 121/8465 | 3.04e-06 | 1.73e-05 | 8.84e-06 | 85 |
| hsa0492816 | Esophagus | ESCC | Parathyroid hormone synthesis, secretion and action | 66/4205 | 106/8465 | 5.86e-03 | 1.47e-02 | 7.51e-03 | 66 |
| hsa0481028 | Esophagus | ESCC | Regulation of actin cytoskeleton | 133/4205 | 229/8465 | 5.94e-03 | 1.48e-02 | 7.56e-03 | 133 |
| hsa05130310 | Esophagus | ESCC | Pathogenic Escherichia coli infection | 142/4205 | 197/8465 | 8.21e-11 | 1.06e-09 | 5.42e-10 | 142 |
| hsa0516338 | Esophagus | ESCC | Human cytomegalovirus infection | 148/4205 | 225/8465 | 5.73e-07 | 4.00e-06 | 2.05e-06 | 148 |
| hsa0407117 | Esophagus | ESCC | Sphingolipid signaling pathway | 85/4205 | 121/8465 | 3.04e-06 | 1.73e-05 | 8.84e-06 | 85 |
| hsa0492817 | Esophagus | ESCC | Parathyroid hormone synthesis, secretion and action | 66/4205 | 106/8465 | 5.86e-03 | 1.47e-02 | 7.51e-03 | 66 |
| hsa04810112 | Esophagus | ESCC | Regulation of actin cytoskeleton | 133/4205 | 229/8465 | 5.94e-03 | 1.48e-02 | 7.56e-03 | 133 |
| hsa0513014 | Liver | NAFLD | Pathogenic Escherichia coli infection | 45/1043 | 197/8465 | 2.31e-05 | 6.88e-04 | 5.54e-04 | 45 |
| hsa0481010 | Liver | NAFLD | Regulation of actin cytoskeleton | 50/1043 | 229/8465 | 3.01e-05 | 7.59e-04 | 6.11e-04 | 50 |
| hsa0513015 | Liver | NAFLD | Pathogenic Escherichia coli infection | 45/1043 | 197/8465 | 2.31e-05 | 6.88e-04 | 5.54e-04 | 45 |
| hsa0481011 | Liver | NAFLD | Regulation of actin cytoskeleton | 50/1043 | 229/8465 | 3.01e-05 | 7.59e-04 | 6.11e-04 | 50 |
| hsa0513042 | Liver | HCC | Pathogenic Escherichia coli infection | 129/4020 | 197/8465 | 2.02e-07 | 2.50e-06 | 1.39e-06 | 129 |
| hsa0481041 | Liver | HCC | Regulation of actin cytoskeleton | 134/4020 | 229/8465 | 4.48e-04 | 1.94e-03 | 1.08e-03 | 134 |
| hsa0516322 | Liver | HCC | Human cytomegalovirus infection | 131/4020 | 225/8465 | 6.86e-04 | 2.77e-03 | 1.54e-03 | 131 |
| hsa040718 | Liver | HCC | Sphingolipid signaling pathway | 72/4020 | 121/8465 | 5.01e-03 | 1.47e-02 | 8.18e-03 | 72 |
| hsa0513052 | Liver | HCC | Pathogenic Escherichia coli infection | 129/4020 | 197/8465 | 2.02e-07 | 2.50e-06 | 1.39e-06 | 129 |
| hsa0481051 | Liver | HCC | Regulation of actin cytoskeleton | 134/4020 | 229/8465 | 4.48e-04 | 1.94e-03 | 1.08e-03 | 134 |
| Page: 1 2 3 |
Top |
Cell-cell communication analysis |
| Identification of potential cell-cell interactions between two cell types and their ligand-receptor pairs for different disease states |
| Ligand | Receptor | LRpair | Pathway | Tissue | Disease Stage |
| Page: 1 |
Top |
Single-cell gene regulatory network inference analysis |
| Find out the significant the regulons (TFs) and the target genes of each regulon across cell types for different disease states |
| TF | Cell Type | Tissue | Disease Stage | Target Gene | RSS | Regulon Activity |
| ∗The dot plots of a searched regulon are shown for all cell subpopulations in each disease state of each tissue based on the regulon specific score inferred using pySCENIC and by calculating the average expression. |
| Page: 1 |
Top |
Somatic mutation of malignant transformation related genes |
| Annotation of somatic variants for genes involved in malignant transformation |
| Hugo Symbol | Variant Class | Variant Classification | dbSNP RS | HGVSc | HGVSp | HGVSp Short | SWISSPROT | BIOTYPE | SIFT | PolyPhen | Tumor Sample Barcode | Tissue | Histology | Sex | Age | Stage | Therapy Types | Drugs | Outcome |
| GNA12 | SNV | Missense_Mutation | rs774244411 | c.506G>A | p.Arg169Gln | p.R169Q | Q03113 | protein_coding | deleterious(0.05) | possibly_damaging(0.792) | TCGA-A2-A1FV-01 | Breast | breast invasive carcinoma | Female | >=65 | I/II | Chemotherapy | cyclophosphamide | SD |
| GNA12 | SNV | Missense_Mutation | rs768426522 | c.970N>A | p.Leu324Met | p.L324M | Q03113 | protein_coding | tolerated(0.07) | possibly_damaging(0.85) | TCGA-AC-A3QP-01 | Breast | breast invasive carcinoma | Female | >=65 | I/II | Hormone Therapy | femara | SD |
| GNA12 | SNV | Missense_Mutation | c.764N>A | p.Ser255Asn | p.S255N | Q03113 | protein_coding | tolerated(0.07) | possibly_damaging(0.626) | TCGA-D8-A27G-01 | Breast | breast invasive carcinoma | Female | >=65 | I/II | Unknown | Unknown | SD | |
| GNA12 | SNV | Missense_Mutation | rs768426522 | c.970N>A | p.Leu324Met | p.L324M | Q03113 | protein_coding | tolerated(0.07) | possibly_damaging(0.85) | TCGA-D8-A4Z1-01 | Breast | breast invasive carcinoma | Female | >=65 | I/II | Hormone Therapy | tamoxiphen | SD |
| GNA12 | SNV | Missense_Mutation | rs200756903 | c.1069N>A | p.Glu357Lys | p.E357K | Q03113 | protein_coding | deleterious(0.04) | probably_damaging(0.964) | TCGA-GM-A2D9-01 | Breast | breast invasive carcinoma | Female | >=65 | I/II | Hormone Therapy | arimidex | SD |
| GNA12 | deletion | Frame_Shift_Del | novel | c.661delN | p.Ile221SerfsTer54 | p.I221Sfs*54 | Q03113 | protein_coding | TCGA-EW-A2FV-01 | Breast | breast invasive carcinoma | Female | <65 | III/IV | Chemotherapy | docetaxel | SD | ||
| GNA12 | SNV | Missense_Mutation | c.240C>G | p.Ile80Met | p.I80M | Q03113 | protein_coding | deleterious(0) | probably_damaging(0.97) | TCGA-Q1-A73O-01 | Cervix | cervical & endocervical cancer | Female | <65 | I/II | Chemotherapy | cisplatin | CR | |
| GNA12 | SNV | Missense_Mutation | c.805N>T | p.Arg269Trp | p.R269W | Q03113 | protein_coding | deleterious(0) | probably_damaging(0.994) | TCGA-AD-5900-01 | Colorectum | colon adenocarcinoma | Male | >=65 | I/II | Unknown | Unknown | SD | |
| GNA12 | SNV | Missense_Mutation | rs140322696 | c.1025N>A | p.Arg342His | p.R342H | Q03113 | protein_coding | tolerated(0.06) | possibly_damaging(0.746) | TCGA-AY-6197-01 | Colorectum | colon adenocarcinoma | Male | <65 | I/II | Unknown | Unknown | SD |
| GNA12 | SNV | Missense_Mutation | c.805N>T | p.Arg269Trp | p.R269W | Q03113 | protein_coding | deleterious(0) | probably_damaging(0.994) | TCGA-CK-4951-01 | Colorectum | colon adenocarcinoma | Female | >=65 | I/II | Unknown | Unknown | PD |
| Page: 1 2 3 4 |
Top |
Related drugs of malignant transformation related genes |
| Identification of chemicals and drugs interact with genes involved in malignant transfromation |
| (DGIdb 4.0) |
| Entrez ID | Symbol | Category | Interaction Types | Drug Claim Name | Drug Name | PMIDs |
| Page: 1 |

Copyright 2023-Present -The University of Texas Health Science Center at Houston |