Schematic overview of the cellular and molecular mechanisms involved in the cancer progression, including the proposed cellular and molecular mechanisms in cancer cells trajectory. AT1: alveolar type 1 cells; AT2: alveolar type 2 cells; AAH: atypical adenomatous hyperplasia; AIS: adenocarcinoma in situ; MIA: minimally invasive adenocarcinoma; IA: invasive adenocarcinoma; EMT: epithelial-mesenchymal transition

Home

Download

Statistics

Help

Contact

Center for Computational Systems Medicine
leaf

Gene summary

leaf

Malignant transformation analysis

leaf

Malignant transformation related pathway analysis

leaf

Cell-cell communication analysis

leaf

Single-cell gene regulatory network inference analysis

leaf

Somatic mutation of malignant transformation related genes

leaf

Related drugs of malignant transformation related genes

Gene: FGF13

Gene summary for FGF13

check button Gene summary.

Gene informationSpeciesHuman
Gene symbol

FGF13

Gene ID

2258

Gene namefibroblast growth factor 13
Gene AliasDEE90
CytomapXq26.3-q27.1
Gene Typeprotein-coding
GO ID

GO:0000165

UniProtAcc

Q92913


Top

Malignant transformation analysis

check button Identification of the aberrant gene expression in precancerous and cancerous lesions by comparing the gene expression of stem-like cells in diseased tissues with normal stem cells
check button Malignant transformation involving gene list.
Entrez IDSymbolReplicatesSpeciesOrganTissueAdj P-valueLog2FCMalignancy
2258FGF13EEC-subject1HumanEndometriumEEC2.38e-136.07e-01-0.2682
2258FGF13EEC-subject3HumanEndometriumEEC6.18e-031.30e-01-0.2525
2258FGF13GSM6177621_NYU_UCEC2_lib1_lib1HumanEndometriumEEC1.31e-04-8.45e-02-0.1934
2258FGF13GSM6177622_NYU_UCEC3_lib1_lib1HumanEndometriumEEC3.87e-05-1.04e-01-0.1917
2258FGF13GSM6177622_NYU_UCEC3_lib2_lib2HumanEndometriumEEC8.54e-03-1.04e-01-0.1916
2258FGF13P1T-EHumanEsophagusESCC2.49e-052.01e-010.0875
2258FGF13P8T-EHumanEsophagusESCC1.20e-059.57e-020.0889
2258FGF13P9T-EHumanEsophagusESCC9.40e-061.93e-010.1131
2258FGF13P10T-EHumanEsophagusESCC5.42e-234.68e-010.116
2258FGF13P12T-EHumanEsophagusESCC2.93e-245.20e-010.1122
2258FGF13P19T-EHumanEsophagusESCC1.37e-054.69e-010.1662
2258FGF13P22T-EHumanEsophagusESCC5.48e-035.02e-020.1236
2258FGF13P23T-EHumanEsophagusESCC9.69e-061.85e-010.108
2258FGF13P28T-EHumanEsophagusESCC7.83e-067.03e-020.1149
2258FGF13P31T-EHumanEsophagusESCC8.24e-193.66e-010.1251
2258FGF13P32T-EHumanEsophagusESCC1.77e-038.95e-020.1666
2258FGF13P39T-EHumanEsophagusESCC2.05e-047.86e-020.0894
2258FGF13P61T-EHumanEsophagusESCC5.80e-046.43e-020.099
2258FGF13P76T-EHumanEsophagusESCC2.56e-028.51e-020.1207
2258FGF13P84T-EHumanEsophagusESCC4.71e-021.54e-010.0933
Page: 1 2 

check button Transcriptomic changes along malignancy continuum.
TissueExpression DynamicsAbbreviation
EndometriumThe image shows the transcriptomic changes along malignancy continuum.log2FC in expression of this searched gene in stem-like cells from each diseased tissue sample relative to stem-like cells in normal samples in each tissue plotted against the malignancy continuum. Samples are colored based on if they are from different disease stage.
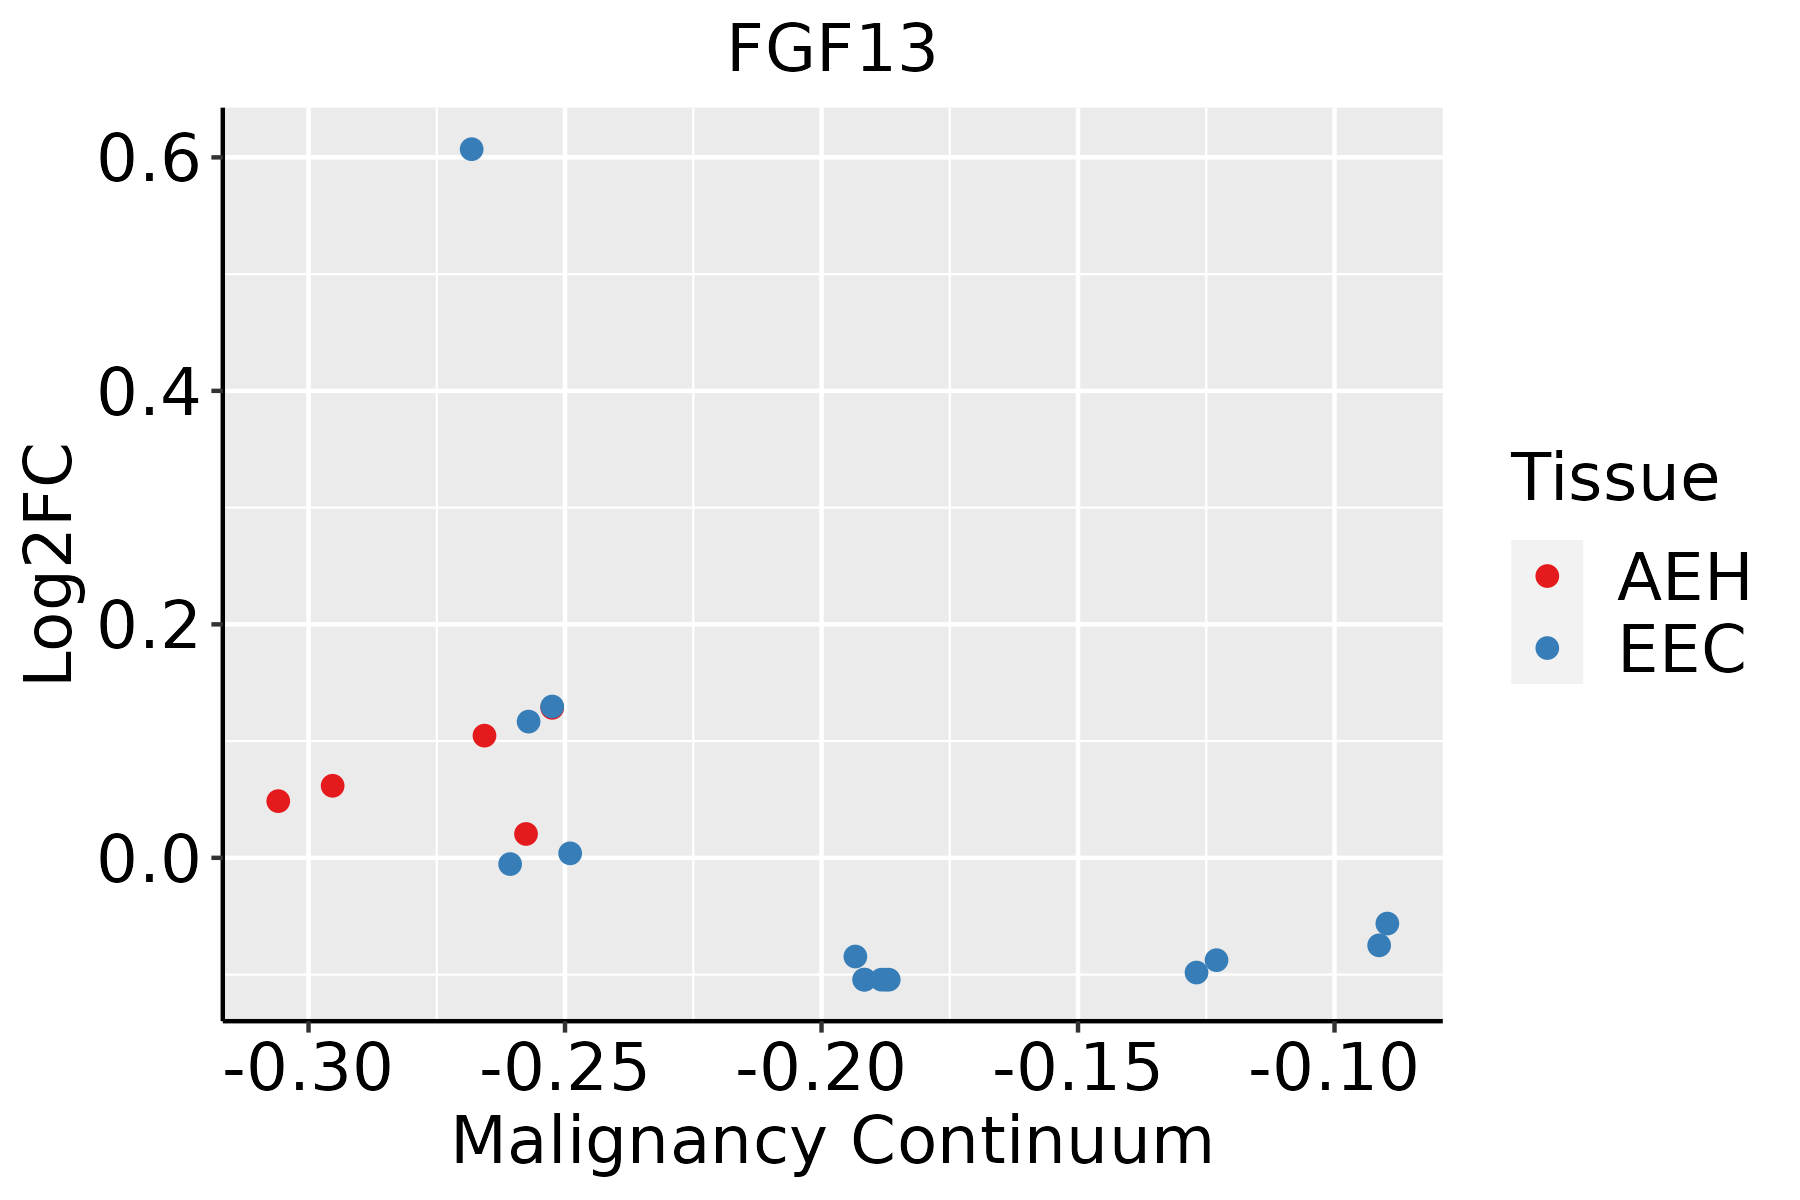
AEH: Atypical endometrial hyperplasia
EEC: Endometrioid Cancer
EsophagusThe image shows the transcriptomic changes along malignancy continuum.log2FC in expression of this searched gene in stem-like cells from each diseased tissue sample relative to stem-like cells in normal samples in each tissue plotted against the malignancy continuum. Samples are colored based on if they are from different disease stage.ESCC: Esophageal squamous cell carcinoma
HGIN: High-grade intraepithelial neoplasias
LGIN: Low-grade intraepithelial neoplasias
LiverThe image shows the transcriptomic changes along malignancy continuum.log2FC in expression of this searched gene in stem-like cells from each diseased tissue sample relative to stem-like cells in normal samples in each tissue plotted against the malignancy continuum. Samples are colored based on if they are from different disease stage.
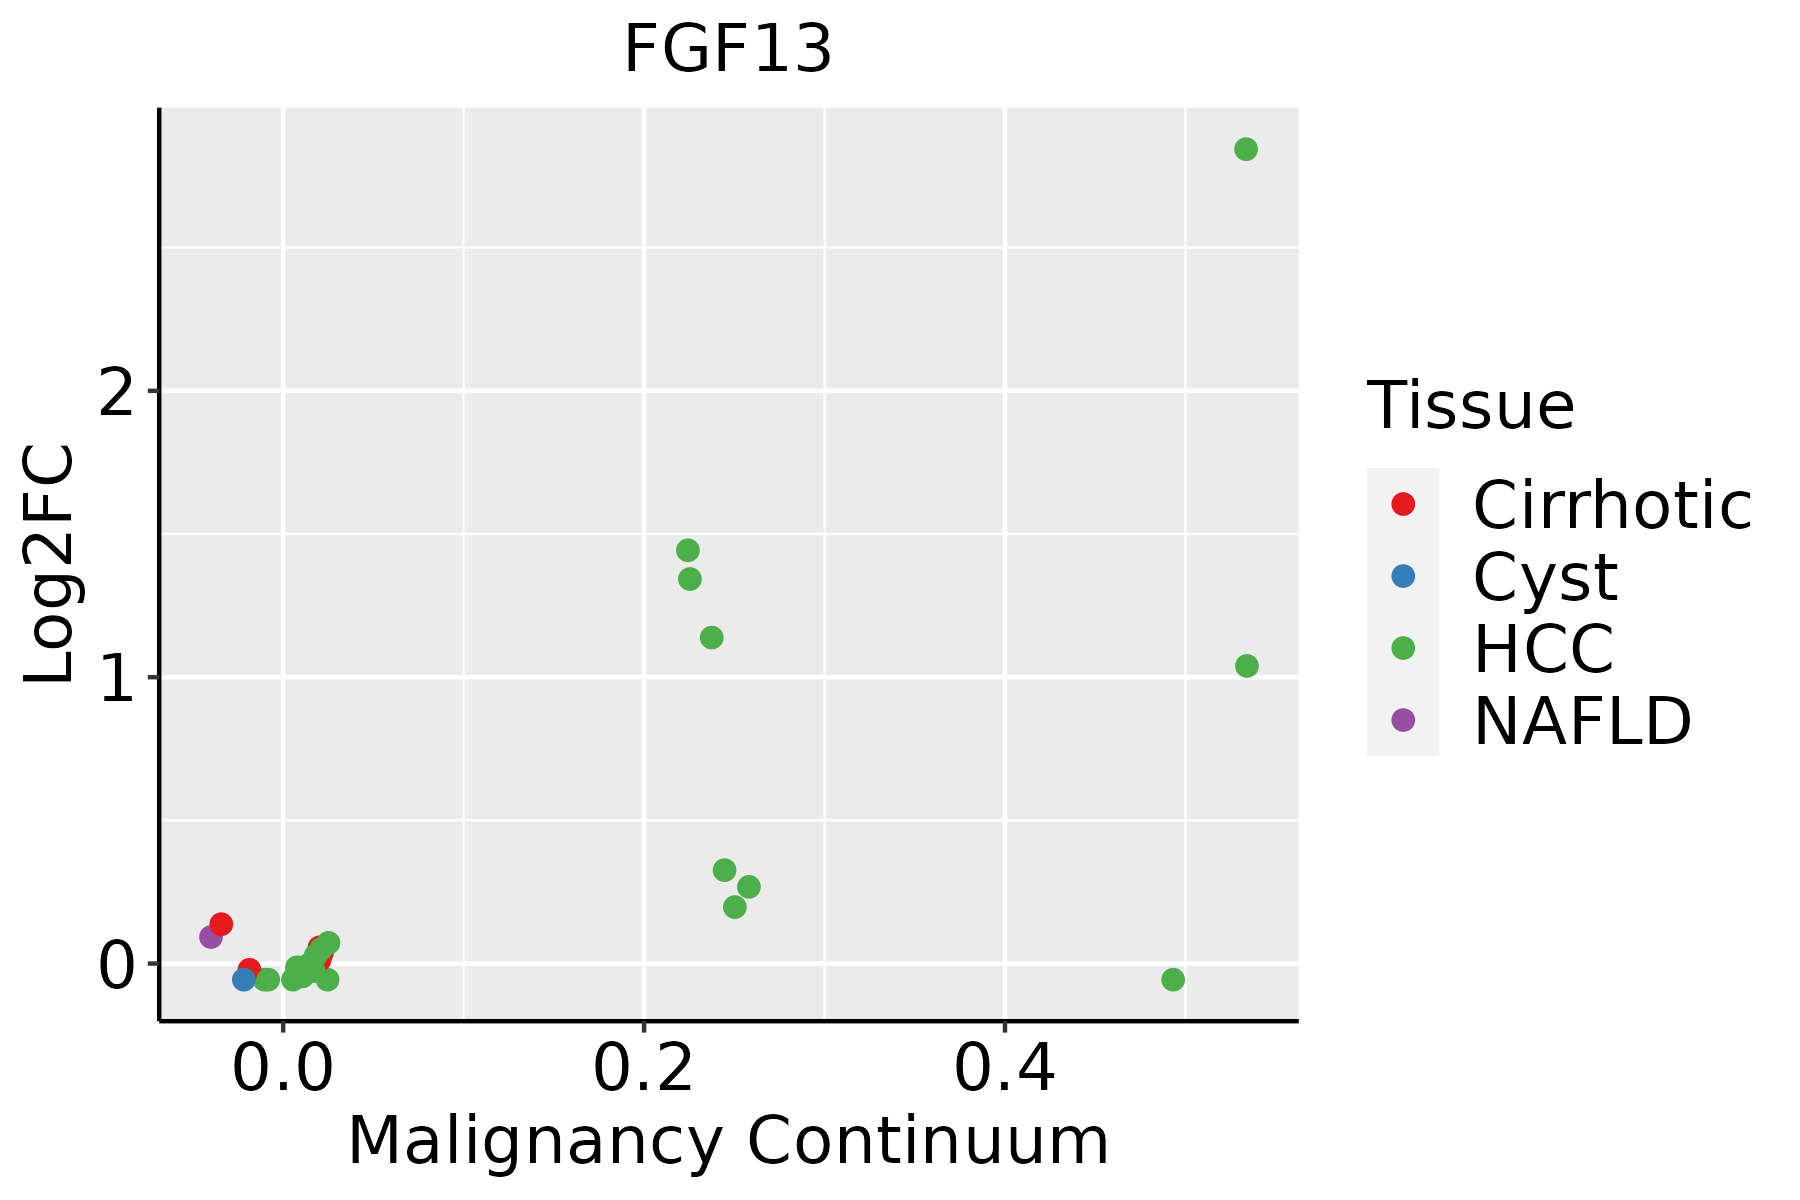
HCC: Hepatocellular carcinoma
NAFLD: Non-alcoholic fatty liver disease
LungThe image shows the transcriptomic changes along malignancy continuum.log2FC in expression of this searched gene in stem-like cells from each diseased tissue sample relative to stem-like cells in normal samples in each tissue plotted against the malignancy continuum. Samples are colored based on if they are from different disease stage.
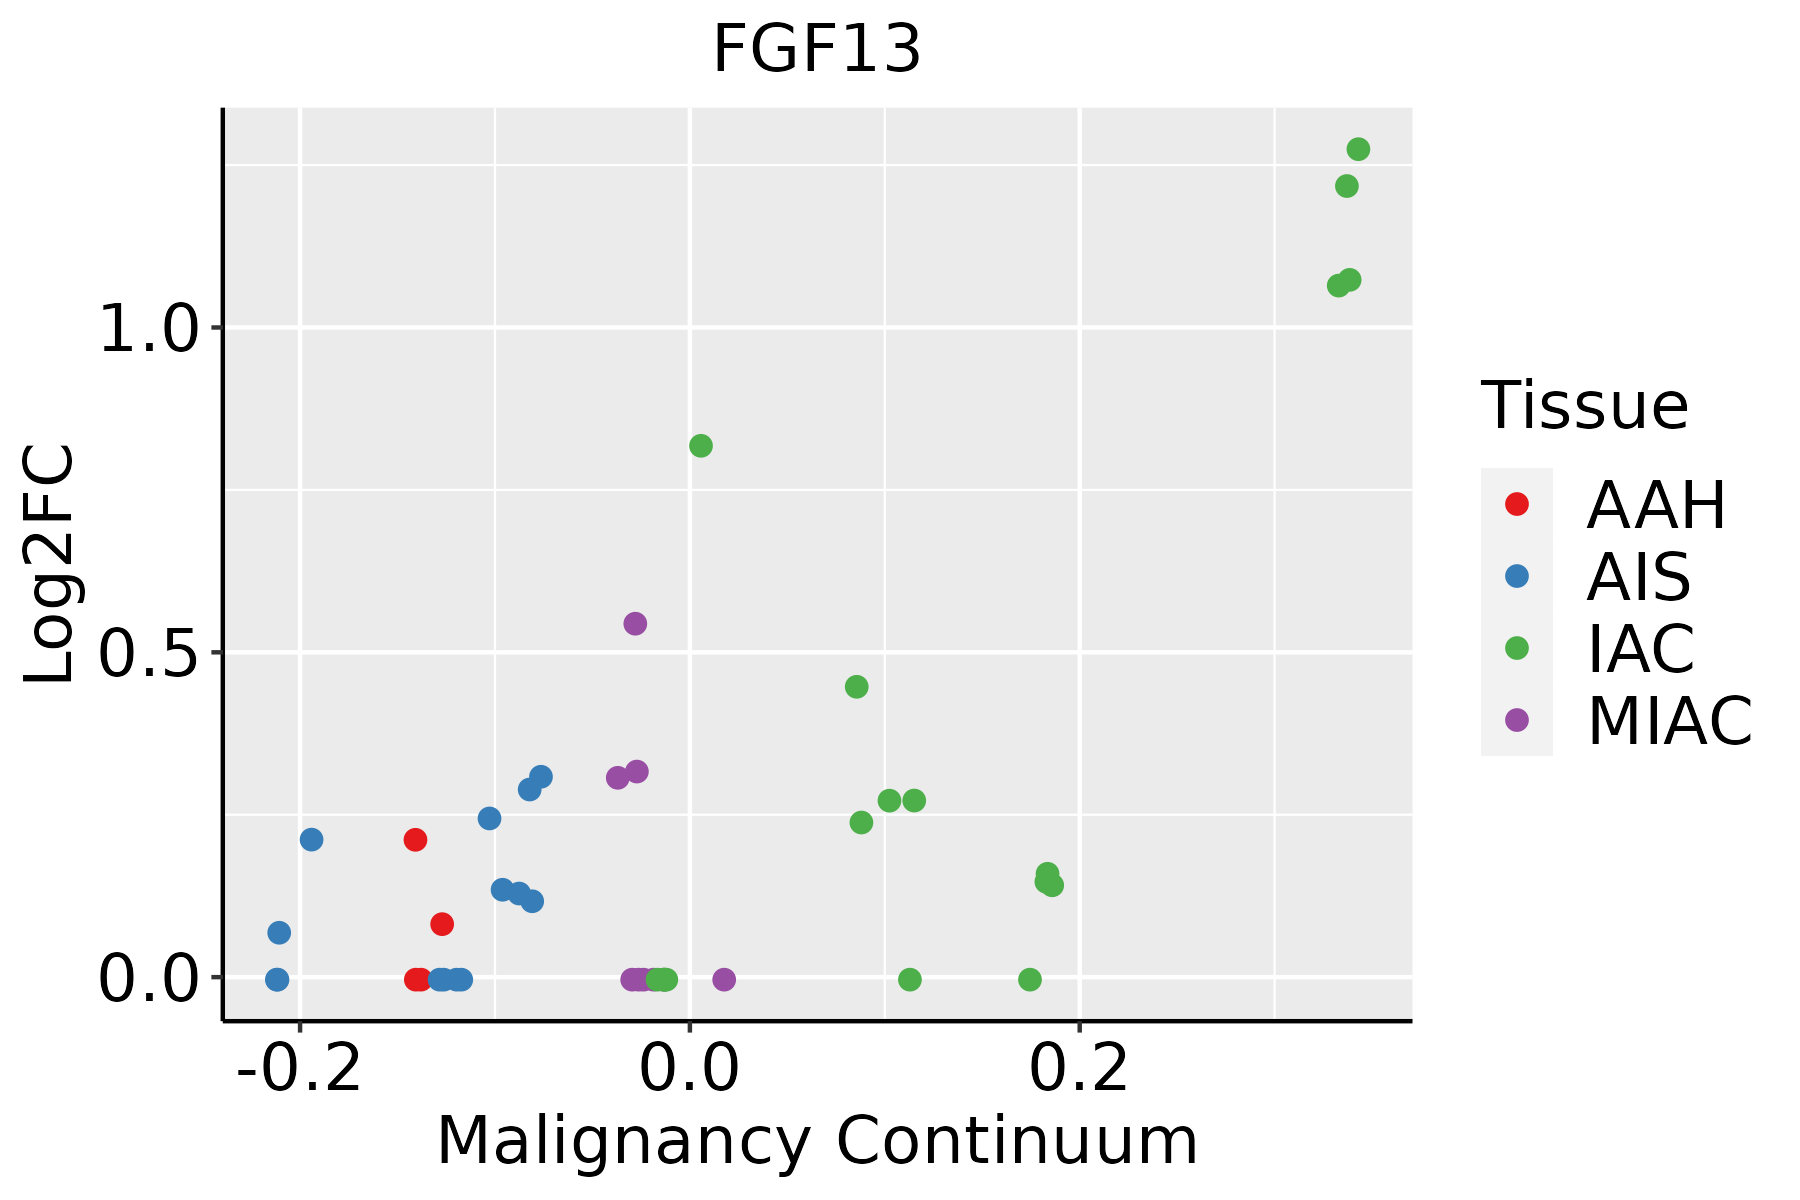
AAH: Atypical adenomatous hyperplasia
AIS: Adenocarcinoma in situ
IAC: Invasive lung adenocarcinoma
MIA: Minimally invasive adenocarcinoma
ProstateThe image shows the transcriptomic changes along malignancy continuum.log2FC in expression of this searched gene in stem-like cells from each diseased tissue sample relative to stem-like cells in normal samples in each tissue plotted against the malignancy continuum. Samples are colored based on if they are from different disease stage.
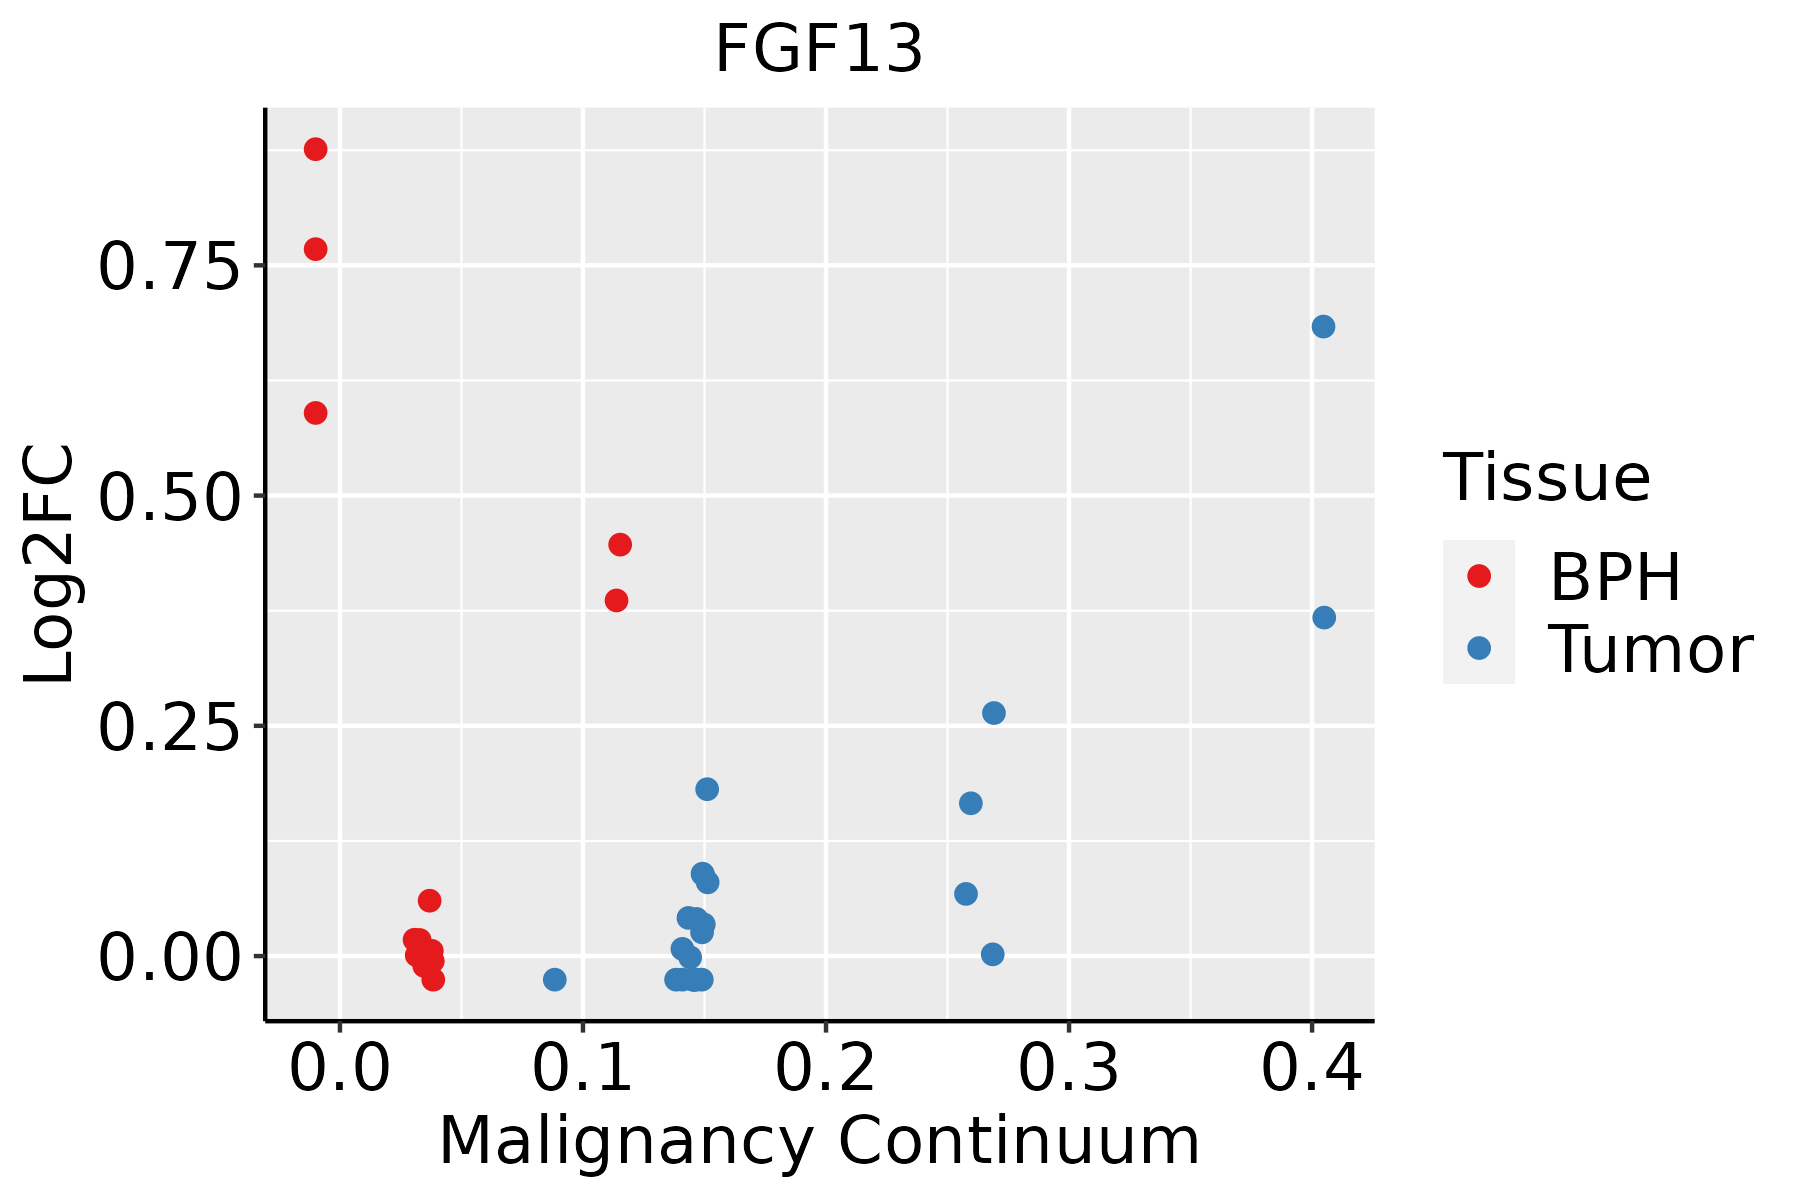
BPH: Benign Prostatic Hyperplasia
∗log2FC in expression of this searched gene in stem-like cells from each diseased tissue sample relative to stem-like cells in normal samples in each tissue plotted against the malignancy continuum. Samples are colored based on if they are from different disease stage.

Top

Malignant transformation related pathway analysis

check buttonFind out the enriched GO biological processes and KEGG pathways involved in transition from healthy to precancer to cancer
check button Figure of enriched GO biological processes.
TissueDisease StageEnriched GO biological Processes
ColorectumADGO analysis - Figure of enriched GO biological processes: Top 15 enriched GO BP terms are showed in the bar plot of each disease state in each tissue. Each row represents a significant GO biological process which is colored according to the -log10(p.adjust).
ColorectumSERGO analysis - Figure of enriched GO biological processes: Top 15 enriched GO BP terms are showed in the bar plot of each disease state in each tissue. Each row represents a significant GO biological process which is colored according to the -log10(p.adjust).
ColorectumMSSGO analysis - Figure of enriched GO biological processes: Top 15 enriched GO BP terms are showed in the bar plot of each disease state in each tissue. Each row represents a significant GO biological process which is colored according to the -log10(p.adjust).
ColorectumMSI-HGO analysis - Figure of enriched GO biological processes: Top 15 enriched GO BP terms are showed in the bar plot of each disease state in each tissue. Each row represents a significant GO biological process which is colored according to the -log10(p.adjust).
ColorectumFAPGO analysis - Figure of enriched GO biological processes: Top 15 enriched GO BP terms are showed in the bar plot of each disease state in each tissue. Each row represents a significant GO biological process which is colored according to the -log10(p.adjust).
∗Top 15 enriched GO BP terms are showed in the bar plot of each disease state in each tissue. Each row represents a significant GO biological process which is colored according to the -log10(p.adjust).
Page: 1 2 3 4 5 6 7 8 9 

check button Enriched GO biological processes.
GO IDTissueDisease StageDescriptionGene RatioBg Ratiopvaluep.adjustCount
GO:007050713EndometriumEECregulation of microtubule cytoskeleton organization29/2168148/187233.07e-032.13e-0229
GO:009890011EndometriumEECregulation of action potential14/216855/187233.28e-032.23e-0214
GO:009025712EndometriumEECregulation of muscle system process44/2168252/187233.51e-032.36e-0244
GO:005080812EndometriumEECsynapse organization68/2168426/187233.73e-032.49e-0268
GO:190230513EndometriumEECregulation of sodium ion transmembrane transport16/216868/187234.08e-032.68e-0216
GO:00219874EndometriumEECcerebral cortex development23/2168114/187235.41e-033.32e-0223
GO:000694211EndometriumEECregulation of striated muscle contraction20/216895/187235.59e-033.38e-0220
GO:000693711EndometriumEECregulation of muscle contraction31/2168169/187236.29e-033.71e-0231
GO:007025212EndometriumEECactin-mediated cell contraction20/216897/187237.11e-034.07e-0220
GO:008600312EndometriumEECcardiac muscle cell contraction16/216873/187238.40e-034.60e-0216
GO:00107213EndometriumEECnegative regulation of cell development32/2168180/187238.88e-034.78e-0232
GO:0022411111EsophagusESCCcellular component disassembly305/8552443/187231.94e-234.57e-21305
GO:0072659110EsophagusESCCprotein localization to plasma membrane193/8552284/187231.95e-141.03e-12193
GO:199077819EsophagusESCCprotein localization to cell periphery217/8552333/187234.08e-131.88e-11217
GO:003298416EsophagusESCCprotein-containing complex disassembly151/8552224/187233.45e-111.15e-09151
GO:1902903111EsophagusESCCregulation of supramolecular fiber organization237/8552383/187239.06e-112.75e-09237
GO:0016049110EsophagusESCCcell growth289/8552482/187231.29e-103.77e-09289
GO:0010639110EsophagusESCCnegative regulation of organelle organization215/8552348/187238.20e-102.01e-08215
GO:000716320EsophagusESCCestablishment or maintenance of cell polarity143/8552218/187232.05e-094.65e-08143
GO:000155819EsophagusESCCregulation of cell growth248/8552414/187232.97e-096.45e-08248
Page: 1 2 3 4 5 6 7 8 9 10 11 12 13 14 

check button Enriched KEGG pathways.
Pathway IDTissueDisease StageDescriptionGene RatioBg Ratiopvaluep.adjustqvalueCount
Page: 1 

Top

Cell-cell communication analysis

check buttonIdentification of potential cell-cell interactions between two cell types and their ligand-receptor pairs for different disease states
LigandReceptorLRpairPathwayTissueDisease Stage
Page: 1 

Top

Single-cell gene regulatory network inference analysis

check buttonFind out the significant the regulons (TFs) and the target genes of each regulon across cell types for different disease states
TFCell TypeTissueDisease StageTarget GeneRSSRegulon Activity
∗The dot plots of a searched regulon are shown for all cell subpopulations in each disease state of each tissue based on the regulon specific score inferred using pySCENIC and by calculating the average expression.
Page: 1 

Top

Somatic mutation of malignant transformation related genes

check buttonAnnotation of somatic variants for genes involved in malignant transformation
Hugo SymbolVariant ClassVariant ClassificationdbSNP RSHGVScHGVSpHGVSp ShortSWISSPROTBIOTYPESIFTPolyPhenTumor Sample BarcodeTissueHistologySexAgeStageTherapy TypesDrugsOutcome
FGF13SNVMissense_Mutationc.500N>Tp.Ser167Leup.S167LQ92913protein_codingdeleterious(0)probably_damaging(1)TCGA-BH-A18P-01Breastbreast invasive carcinomaFemale<65I/IIUnknownUnknownPD
FGF13SNVMissense_Mutationc.705N>Cp.Lys235Asnp.K235NQ92913protein_codingdeleterious_low_confidence(0.01)possibly_damaging(0.696)TCGA-C8-A275-01Breastbreast invasive carcinomaFemale<65I/IIUnknownUnknownSD
FGF13insertionFrame_Shift_Insnovelc.26_27insGTGCATGTGTGTGCGTGTGCGCGAGTGTGCATp.Glu10CysfsTer11p.E10Cfs*11Q92913protein_codingTCGA-E9-A1NC-01Breastbreast invasive carcinomaFemale<65I/IIChemotherapydoxorubicinCR
FGF13deletionFrame_Shift_Delnovelc.555delAp.Glu186LysfsTer5p.E186Kfs*5Q92913protein_codingTCGA-EW-A2FV-01Breastbreast invasive carcinomaFemale<65III/IVChemotherapydocetaxelSD
FGF13SNVMissense_Mutationnovelc.8G>Ap.Gly3Glup.G3EQ92913protein_codingdeleterious_low_confidence(0)benign(0.066)TCGA-VS-A958-01Cervixcervical & endocervical cancerFemale<65I/IIChemotherapycisplatinCR
FGF13SNVMissense_Mutationc.604N>Tp.Ala202Serp.A202SQ92913protein_codingtolerated(0.46)possibly_damaging(0.505)TCGA-A6-5665-01Colorectumcolon adenocarcinomaFemale>=65I/IIUnknownUnknownPD
FGF13SNVMissense_Mutationnovelc.190N>Ap.His64Asnp.H64NQ92913protein_codingtolerated(0.55)benign(0.046)TCGA-AA-3855-01Colorectumcolon adenocarcinomaMale>=65I/IIUnknownUnknownSD
FGF13SNVMissense_Mutationrs762632439c.680N>Ap.Arg227Glnp.R227QQ92913protein_codingtolerated_low_confidence(0.27)possibly_damaging(0.815)TCGA-AA-A010-01Colorectumcolon adenocarcinomaFemale<65I/IIChemotherapyfolinicCR
FGF13SNVMissense_Mutationc.550N>Gp.Asn184Aspp.N184DQ92913protein_codingtolerated(0.08)possibly_damaging(0.448)TCGA-AD-6964-01Colorectumcolon adenocarcinomaMale<65III/IVChemotherapyfolfoxPD
FGF13SNVMissense_Mutationnovelc.605N>Tp.Ala202Valp.A202VQ92913protein_codingdeleterious(0.04)probably_damaging(0.947)TCGA-AZ-6598-01Colorectumcolon adenocarcinomaFemale>=65I/IIUnknownUnknownSD
Page: 1 2 3 4 5 6 

Top

Related drugs of malignant transformation related genes

check buttonIdentification of chemicals and drugs interact with genes involved in malignant transfromation
(DGIdb 4.0)
Entrez IDSymbolCategoryInteraction TypesDrug Claim NameDrug NamePMIDs
Page: 1