
|
|||||
|
 | |
| |
| |
| |
| |
| |
|
Gene: FARP2 |
Gene summary for FARP2 |
| Gene information | Species | Human | Gene symbol | FARP2 | Gene ID | 9855 |
| Gene name | FERM, ARH/RhoGEF and pleckstrin domain protein 2 | |
| Gene Alias | FIR | |
| Cytomap | 2q37.3 | |
| Gene Type | protein-coding | GO ID | GO:0002376 | UniProtAcc | O94887 |
Top |
Malignant transformation analysis |
| Identification of the aberrant gene expression in precancerous and cancerous lesions by comparing the gene expression of stem-like cells in diseased tissues with normal stem cells |
| Entrez ID | Symbol | Replicates | Species | Organ | Tissue | Adj P-value | Log2FC | Malignancy |
| 9855 | FARP2 | HTA11_3410_2000001011 | Human | Colorectum | AD | 5.11e-09 | -4.04e-01 | 0.0155 |
| 9855 | FARP2 | HTA11_347_2000001011 | Human | Colorectum | AD | 2.47e-07 | 5.33e-01 | -0.1954 |
| 9855 | FARP2 | HTA11_411_2000001011 | Human | Colorectum | SER | 1.32e-02 | 4.61e-01 | -0.2602 |
| 9855 | FARP2 | HTA11_99999970781_79442 | Human | Colorectum | MSS | 1.33e-07 | -4.58e-01 | 0.294 |
| 9855 | FARP2 | HTA11_99999965062_69753 | Human | Colorectum | MSI-H | 1.51e-02 | 5.99e-01 | 0.3487 |
| 9855 | FARP2 | HTA11_99999974143_84620 | Human | Colorectum | MSS | 2.73e-07 | -4.65e-01 | 0.3005 |
| 9855 | FARP2 | F007 | Human | Colorectum | FAP | 3.54e-06 | -3.81e-01 | 0.1176 |
| 9855 | FARP2 | A001-C-207 | Human | Colorectum | FAP | 1.38e-06 | -3.73e-01 | 0.1278 |
| 9855 | FARP2 | A015-C-203 | Human | Colorectum | FAP | 4.73e-36 | -5.57e-01 | -0.1294 |
| 9855 | FARP2 | A015-C-204 | Human | Colorectum | FAP | 8.92e-09 | -3.71e-01 | -0.0228 |
| 9855 | FARP2 | A014-C-040 | Human | Colorectum | FAP | 2.46e-10 | -6.89e-01 | -0.1184 |
| 9855 | FARP2 | A002-C-201 | Human | Colorectum | FAP | 9.32e-23 | -4.15e-01 | 0.0324 |
| 9855 | FARP2 | A002-C-203 | Human | Colorectum | FAP | 6.86e-03 | -1.99e-01 | 0.2786 |
| 9855 | FARP2 | A001-C-119 | Human | Colorectum | FAP | 2.10e-13 | -6.22e-01 | -0.1557 |
| 9855 | FARP2 | A001-C-108 | Human | Colorectum | FAP | 8.58e-24 | -4.39e-01 | -0.0272 |
| 9855 | FARP2 | A002-C-205 | Human | Colorectum | FAP | 5.19e-37 | -6.25e-01 | -0.1236 |
| 9855 | FARP2 | A001-C-104 | Human | Colorectum | FAP | 6.98e-07 | -2.94e-01 | 0.0184 |
| 9855 | FARP2 | A015-C-005 | Human | Colorectum | FAP | 3.22e-09 | -4.31e-01 | -0.0336 |
| 9855 | FARP2 | A015-C-006 | Human | Colorectum | FAP | 6.96e-26 | -6.30e-01 | -0.0994 |
| 9855 | FARP2 | A015-C-106 | Human | Colorectum | FAP | 4.77e-15 | -4.31e-01 | -0.0511 |
| Page: 1 2 3 4 5 6 |
| Tissue | Expression Dynamics | Abbreviation |
| Colorectum (GSE201348) |  | FAP: Familial adenomatous polyposis |
| CRC: Colorectal cancer | ||
| Colorectum (HTA11) |  | AD: Adenomas |
| SER: Sessile serrated lesions | ||
| MSI-H: Microsatellite-high colorectal cancer | ||
| MSS: Microsatellite stable colorectal cancer | ||
| Esophagus | 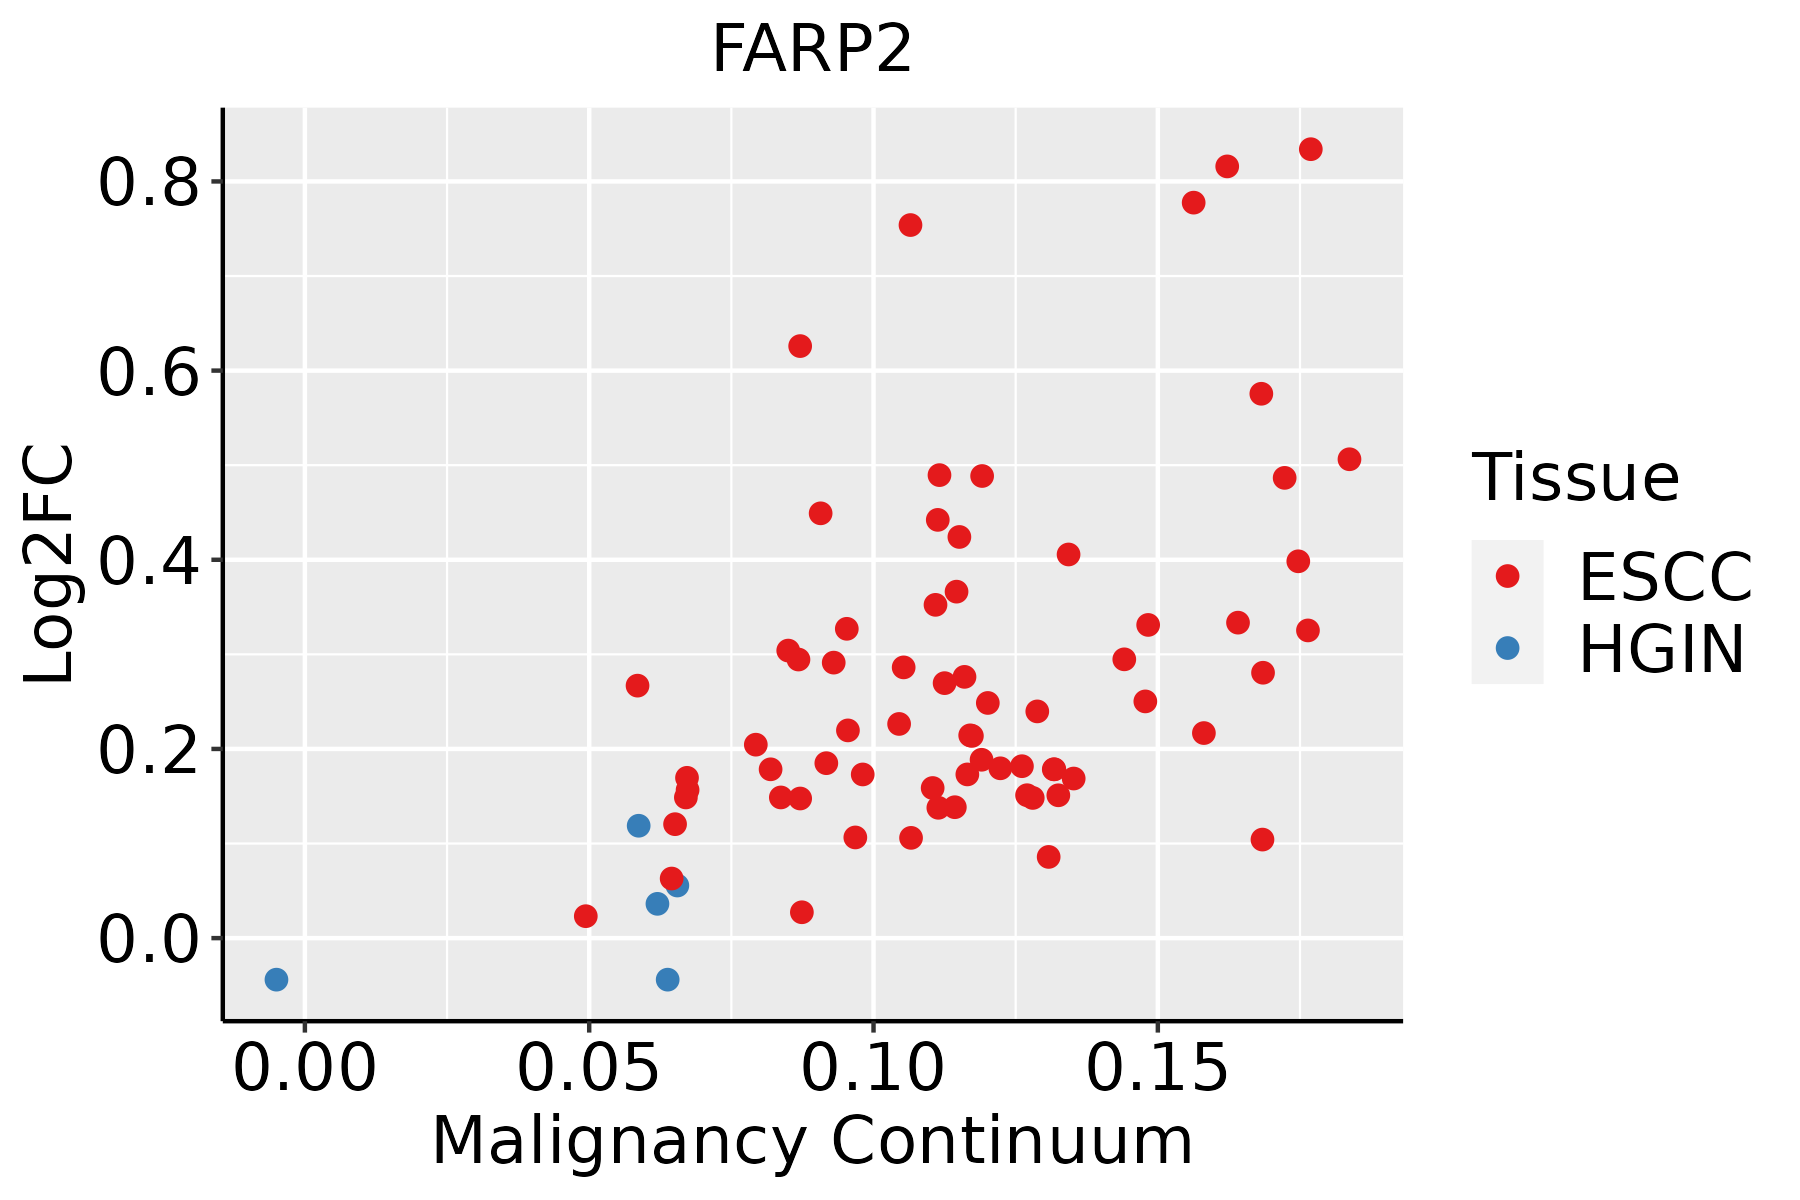 | ESCC: Esophageal squamous cell carcinoma |
| HGIN: High-grade intraepithelial neoplasias | ||
| LGIN: Low-grade intraepithelial neoplasias | ||
| Prostate | 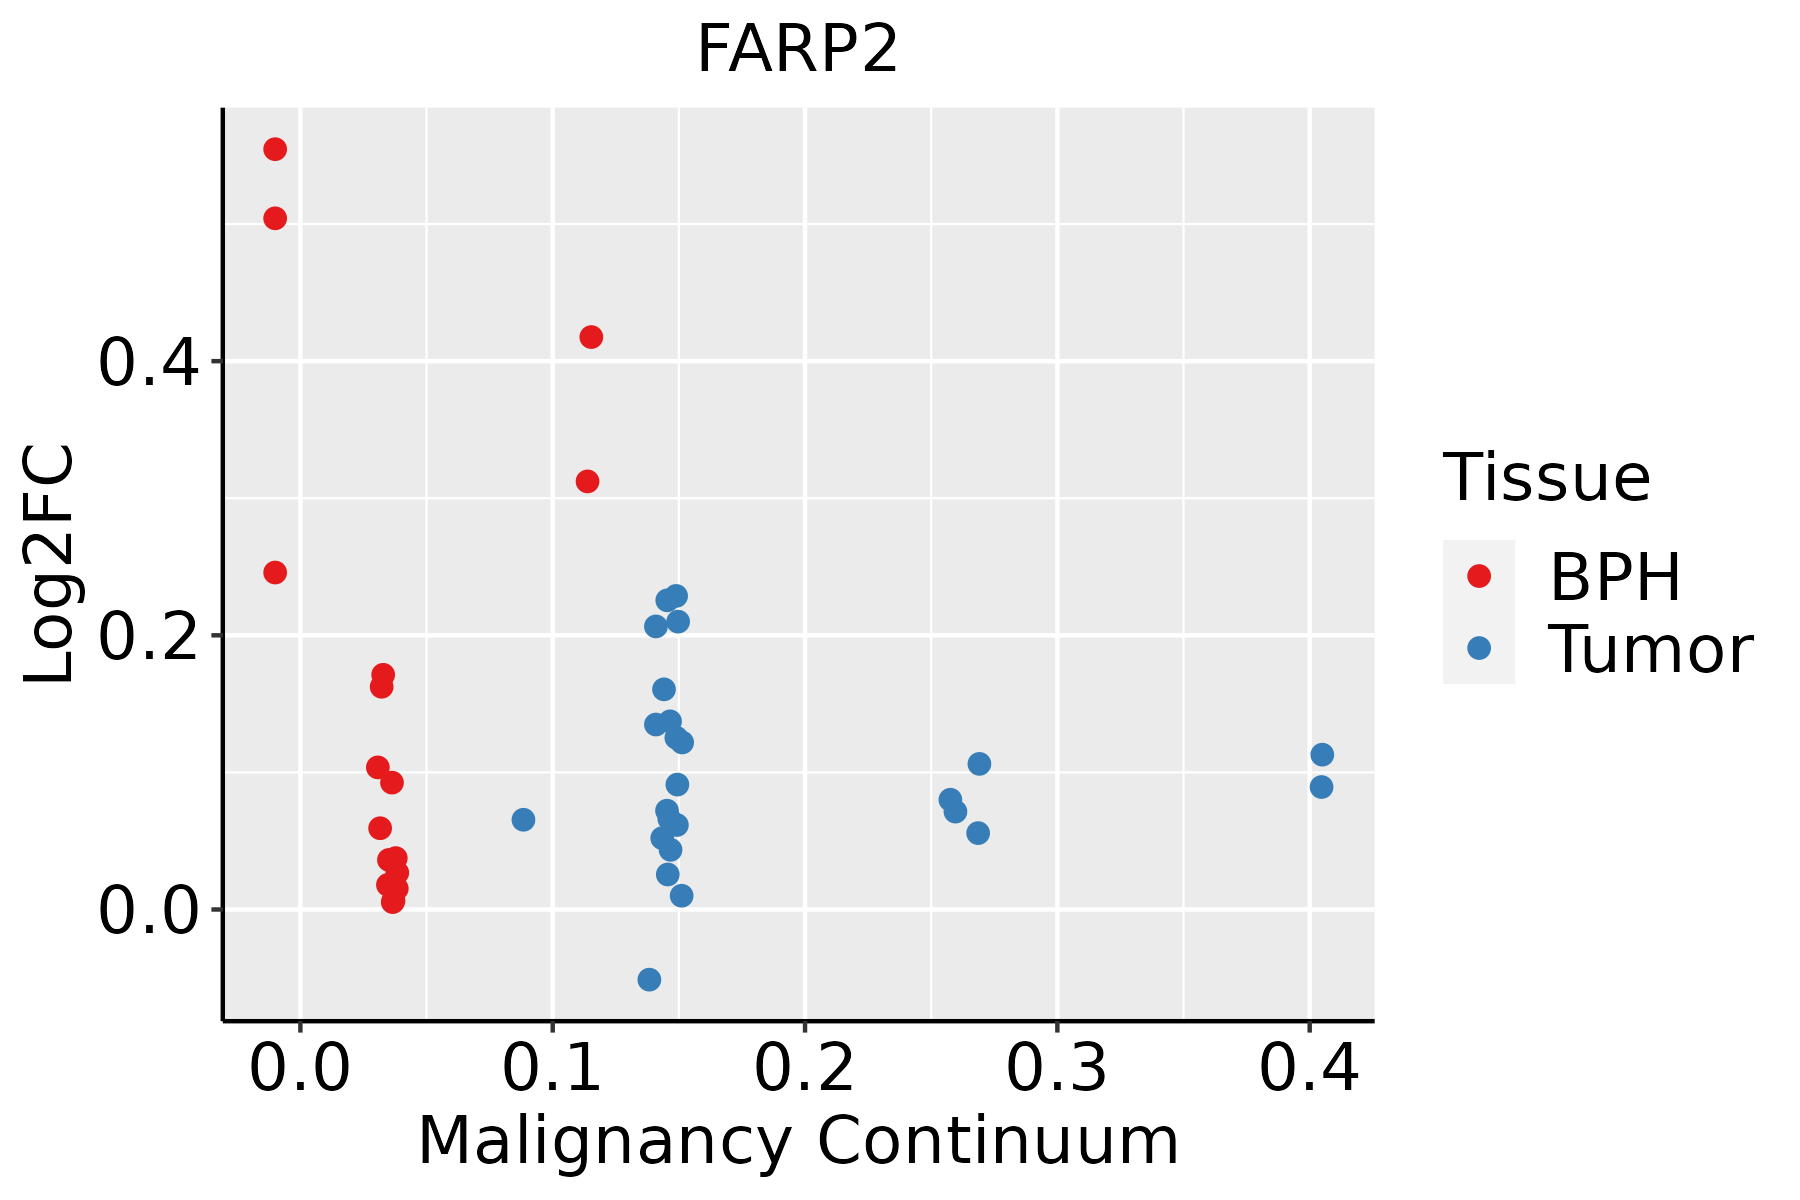 | BPH: Benign Prostatic Hyperplasia |
| ∗log2FC in expression of this searched gene in stem-like cells from each diseased tissue sample relative to stem-like cells in normal samples in each tissue plotted against the malignancy continuum. Samples are colored based on if they are from different disease stage. |
Top |
Malignant transformation related pathway analysis |
| Find out the enriched GO biological processes and KEGG pathways involved in transition from healthy to precancer to cancer |
| Tissue | Disease Stage | Enriched GO biological Processes |
| Colorectum | AD |  |
| Colorectum | SER |  |
| Colorectum | MSS |  |
| Colorectum | MSI-H |  |
| Colorectum | FAP |  |
| ∗Top 15 enriched GO BP terms are showed in the bar plot of each disease state in each tissue. Each row represents a significant GO biological process which is colored according to the -log10(p.adjust). |
| Page: 1 2 3 4 5 6 7 8 9 |
| GO ID | Tissue | Disease Stage | Description | Gene Ratio | Bg Ratio | pvalue | p.adjust | Count |
| GO:000257317 | Esophagus | ESCC | myeloid leukocyte differentiation | 128/8552 | 208/18723 | 2.75e-06 | 3.15e-05 | 128 |
| GO:003153218 | Esophagus | ESCC | actin cytoskeleton reorganization | 72/8552 | 107/18723 | 5.03e-06 | 5.31e-05 | 72 |
| GO:00166019 | Esophagus | ESCC | Rac protein signal transduction | 33/8552 | 42/18723 | 1.35e-05 | 1.23e-04 | 33 |
| GO:00224043 | Esophagus | ESCC | molting cycle process | 53/8552 | 84/18723 | 9.62e-04 | 4.88e-03 | 53 |
| GO:00224053 | Esophagus | ESCC | hair cycle process | 53/8552 | 84/18723 | 9.62e-04 | 4.88e-03 | 53 |
| GO:00718001 | Esophagus | ESCC | podosome assembly | 15/8552 | 18/18723 | 1.20e-03 | 5.88e-03 | 15 |
| GO:00423033 | Esophagus | ESCC | molting cycle | 64/8552 | 107/18723 | 2.24e-03 | 9.85e-03 | 64 |
| GO:00426333 | Esophagus | ESCC | hair cycle | 64/8552 | 107/18723 | 2.24e-03 | 9.85e-03 | 64 |
| GO:00303165 | Esophagus | ESCC | osteoclast differentiation | 54/8552 | 94/18723 | 1.43e-02 | 4.65e-02 | 54 |
| GO:004325418 | Prostate | BPH | regulation of protein-containing complex assembly | 133/3107 | 428/18723 | 5.40e-14 | 6.08e-12 | 133 |
| GO:003009918 | Prostate | BPH | myeloid cell differentiation | 115/3107 | 381/18723 | 2.22e-11 | 1.51e-09 | 115 |
| GO:00072658 | Prostate | BPH | Ras protein signal transduction | 101/3107 | 337/18723 | 5.64e-10 | 2.79e-08 | 101 |
| GO:003153210 | Prostate | BPH | actin cytoskeleton reorganization | 40/3107 | 107/18723 | 1.82e-07 | 4.04e-06 | 40 |
| GO:00025739 | Prostate | BPH | myeloid leukocyte differentiation | 58/3107 | 208/18723 | 2.76e-05 | 3.24e-04 | 58 |
| GO:00166017 | Prostate | BPH | Rac protein signal transduction | 16/3107 | 42/18723 | 6.86e-04 | 4.58e-03 | 16 |
| GO:00423032 | Prostate | BPH | molting cycle | 28/3107 | 107/18723 | 7.85e-03 | 3.43e-02 | 28 |
| GO:00426332 | Prostate | BPH | hair cycle | 28/3107 | 107/18723 | 7.85e-03 | 3.43e-02 | 28 |
| GO:00303163 | Prostate | BPH | osteoclast differentiation | 25/3107 | 94/18723 | 9.36e-03 | 3.98e-02 | 25 |
| GO:004325419 | Prostate | Tumor | regulation of protein-containing complex assembly | 132/3246 | 428/18723 | 3.32e-12 | 2.78e-10 | 132 |
| GO:003009919 | Prostate | Tumor | myeloid cell differentiation | 120/3246 | 381/18723 | 6.96e-12 | 5.62e-10 | 120 |
| Page: 1 2 3 4 |
| Pathway ID | Tissue | Disease Stage | Description | Gene Ratio | Bg Ratio | pvalue | p.adjust | qvalue | Count |
| hsa04520 | Colorectum | AD | Adherens junction | 50/2092 | 93/8465 | 1.52e-09 | 2.83e-08 | 1.81e-08 | 50 |
| hsa04015 | Colorectum | AD | Rap1 signaling pathway | 71/2092 | 210/8465 | 1.72e-03 | 9.68e-03 | 6.18e-03 | 71 |
| hsa045201 | Colorectum | AD | Adherens junction | 50/2092 | 93/8465 | 1.52e-09 | 2.83e-08 | 1.81e-08 | 50 |
| hsa040151 | Colorectum | AD | Rap1 signaling pathway | 71/2092 | 210/8465 | 1.72e-03 | 9.68e-03 | 6.18e-03 | 71 |
| hsa045202 | Colorectum | SER | Adherens junction | 37/1580 | 93/8465 | 1.54e-06 | 2.35e-05 | 1.71e-05 | 37 |
| hsa040152 | Colorectum | SER | Rap1 signaling pathway | 54/1580 | 210/8465 | 6.55e-03 | 3.68e-02 | 2.67e-02 | 54 |
| hsa045203 | Colorectum | SER | Adherens junction | 37/1580 | 93/8465 | 1.54e-06 | 2.35e-05 | 1.71e-05 | 37 |
| hsa040153 | Colorectum | SER | Rap1 signaling pathway | 54/1580 | 210/8465 | 6.55e-03 | 3.68e-02 | 2.67e-02 | 54 |
| hsa045204 | Colorectum | MSS | Adherens junction | 42/1875 | 93/8465 | 6.18e-07 | 9.01e-06 | 5.52e-06 | 42 |
| hsa040154 | Colorectum | MSS | Rap1 signaling pathway | 66/1875 | 210/8465 | 1.03e-03 | 5.94e-03 | 3.64e-03 | 66 |
| hsa045205 | Colorectum | MSS | Adherens junction | 42/1875 | 93/8465 | 6.18e-07 | 9.01e-06 | 5.52e-06 | 42 |
| hsa040155 | Colorectum | MSS | Rap1 signaling pathway | 66/1875 | 210/8465 | 1.03e-03 | 5.94e-03 | 3.64e-03 | 66 |
| hsa045206 | Colorectum | MSI-H | Adherens junction | 22/797 | 93/8465 | 3.71e-05 | 5.47e-04 | 4.58e-04 | 22 |
| hsa045207 | Colorectum | MSI-H | Adherens junction | 22/797 | 93/8465 | 3.71e-05 | 5.47e-04 | 4.58e-04 | 22 |
| hsa045208 | Colorectum | FAP | Adherens junction | 45/1404 | 93/8465 | 8.66e-13 | 2.89e-10 | 1.76e-10 | 45 |
| hsa040156 | Colorectum | FAP | Rap1 signaling pathway | 53/1404 | 210/8465 | 7.93e-04 | 5.14e-03 | 3.13e-03 | 53 |
| hsa045209 | Colorectum | FAP | Adherens junction | 45/1404 | 93/8465 | 8.66e-13 | 2.89e-10 | 1.76e-10 | 45 |
| hsa040157 | Colorectum | FAP | Rap1 signaling pathway | 53/1404 | 210/8465 | 7.93e-04 | 5.14e-03 | 3.13e-03 | 53 |
| hsa0452010 | Colorectum | CRC | Adherens junction | 37/1091 | 93/8465 | 5.72e-11 | 6.37e-09 | 4.32e-09 | 37 |
| hsa040158 | Colorectum | CRC | Rap1 signaling pathway | 48/1091 | 210/8465 | 4.00e-05 | 8.70e-04 | 5.90e-04 | 48 |
| Page: 1 2 |
Top |
Cell-cell communication analysis |
| Identification of potential cell-cell interactions between two cell types and their ligand-receptor pairs for different disease states |
| Ligand | Receptor | LRpair | Pathway | Tissue | Disease Stage |
| Page: 1 |
Top |
Single-cell gene regulatory network inference analysis |
| Find out the significant the regulons (TFs) and the target genes of each regulon across cell types for different disease states |
| TF | Cell Type | Tissue | Disease Stage | Target Gene | RSS | Regulon Activity |
| ∗The dot plots of a searched regulon are shown for all cell subpopulations in each disease state of each tissue based on the regulon specific score inferred using pySCENIC and by calculating the average expression. |
| Page: 1 |
Top |
Somatic mutation of malignant transformation related genes |
| Annotation of somatic variants for genes involved in malignant transformation |
| Hugo Symbol | Variant Class | Variant Classification | dbSNP RS | HGVSc | HGVSp | HGVSp Short | SWISSPROT | BIOTYPE | SIFT | PolyPhen | Tumor Sample Barcode | Tissue | Histology | Sex | Age | Stage | Therapy Types | Drugs | Outcome |
| FARP2 | SNV | Missense_Mutation | rs777159772 | c.1451N>A | p.Arg484Gln | p.R484Q | O94887 | protein_coding | tolerated(0.7) | benign(0) | TCGA-A2-A0EV-01 | Breast | breast invasive carcinoma | Female | >=65 | I/II | Unknown | Unknown | SD |
| FARP2 | SNV | Missense_Mutation | c.1772N>A | p.Arg591Lys | p.R591K | O94887 | protein_coding | tolerated(0.43) | possibly_damaging(0.484) | TCGA-AC-A2B8-01 | Breast | breast invasive carcinoma | Female | >=65 | I/II | Chemotherapy | chemo | PD | |
| FARP2 | SNV | Missense_Mutation | c.529N>A | p.Glu177Lys | p.E177K | O94887 | protein_coding | deleterious(0) | possibly_damaging(0.808) | TCGA-C8-A26Y-01 | Breast | breast invasive carcinoma | Female | >=65 | I/II | Unknown | Unknown | SD | |
| FARP2 | SNV | Missense_Mutation | c.599N>A | p.Ile200Lys | p.I200K | O94887 | protein_coding | deleterious(0) | probably_damaging(0.957) | TCGA-D8-A1XK-01 | Breast | breast invasive carcinoma | Female | <65 | I/II | Chemotherapy | doxorubicine+cyclophosphamide | SD | |
| FARP2 | SNV | Missense_Mutation | c.2635N>C | p.Glu879Gln | p.E879Q | O94887 | protein_coding | tolerated(0.07) | probably_damaging(0.998) | TCGA-DR-A0ZM-01 | Cervix | cervical & endocervical cancer | Female | <65 | III/IV | Unspecific | Cisplatin | SD | |
| FARP2 | SNV | Missense_Mutation | c.2565G>C | p.Lys855Asn | p.K855N | O94887 | protein_coding | tolerated(0.06) | benign(0.086) | TCGA-EK-A3GK-01 | Cervix | cervical & endocervical cancer | Female | <65 | I/II | Unknown | Unknown | SD | |
| FARP2 | SNV | Missense_Mutation | rs763386574 | c.1783C>T | p.Arg595Cys | p.R595C | O94887 | protein_coding | tolerated(0.13) | benign(0.007) | TCGA-AA-3949-01 | Colorectum | colon adenocarcinoma | Female | >=65 | III/IV | Unknown | Unknown | SD |
| FARP2 | SNV | Missense_Mutation | rs369372470 | c.1333N>T | p.Arg445Cys | p.R445C | O94887 | protein_coding | deleterious(0.04) | benign(0.003) | TCGA-AA-A010-01 | Colorectum | colon adenocarcinoma | Female | <65 | I/II | Chemotherapy | folinic | CR |
| FARP2 | SNV | Missense_Mutation | c.352N>T | p.Arg118Cys | p.R118C | O94887 | protein_coding | deleterious(0) | probably_damaging(0.987) | TCGA-AA-A022-01 | Colorectum | colon adenocarcinoma | Female | >=65 | I/II | Unknown | Unknown | SD | |
| FARP2 | SNV | Missense_Mutation | c.1315N>G | p.Ser439Gly | p.S439G | O94887 | protein_coding | tolerated(0.2) | benign(0.015) | TCGA-AD-6889-01 | Colorectum | colon adenocarcinoma | Male | >=65 | I/II | Chemotherapy | xeloda | PD |
| Page: 1 2 3 4 5 6 7 8 9 |
Top |
Related drugs of malignant transformation related genes |
| Identification of chemicals and drugs interact with genes involved in malignant transfromation |
| (DGIdb 4.0) |
| Entrez ID | Symbol | Category | Interaction Types | Drug Claim Name | Drug Name | PMIDs |
| 9855 | FARP2 | NA | methylphenidate | METHYLPHENIDATE | 29382897 |
| Page: 1 |

Copyright 2023-Present -The University of Texas Health Science Center at Houston |