
|
|||||
|
 | |
| |
| |
| |
| |
| |
|
Gene: FAR1 |
Gene summary for FAR1 |
| Gene information | Species | Human | Gene symbol | FAR1 | Gene ID | 84188 |
| Gene name | fatty acyl-CoA reductase 1 | |
| Gene Alias | CSPSD | |
| Cytomap | 11p15.3 | |
| Gene Type | protein-coding | GO ID | GO:0006139 | UniProtAcc | Q8WVX9 |
Top |
Malignant transformation analysis |
| Identification of the aberrant gene expression in precancerous and cancerous lesions by comparing the gene expression of stem-like cells in diseased tissues with normal stem cells |
| Entrez ID | Symbol | Replicates | Species | Organ | Tissue | Adj P-value | Log2FC | Malignancy |
| 84188 | FAR1 | HTA11_3410_2000001011 | Human | Colorectum | AD | 2.49e-35 | -8.14e-01 | 0.0155 |
| 84188 | FAR1 | HTA11_2487_2000001011 | Human | Colorectum | SER | 1.83e-14 | -7.21e-01 | -0.1808 |
| 84188 | FAR1 | HTA11_2951_2000001011 | Human | Colorectum | AD | 2.55e-05 | -9.06e-01 | 0.0216 |
| 84188 | FAR1 | HTA11_1938_2000001011 | Human | Colorectum | AD | 1.29e-02 | -4.56e-01 | -0.0811 |
| 84188 | FAR1 | HTA11_3361_2000001011 | Human | Colorectum | AD | 5.98e-10 | -7.38e-01 | -0.1207 |
| 84188 | FAR1 | HTA11_696_2000001011 | Human | Colorectum | AD | 1.70e-28 | -6.48e-01 | -0.1464 |
| 84188 | FAR1 | HTA11_866_2000001011 | Human | Colorectum | AD | 1.06e-16 | -5.81e-01 | -0.1001 |
| 84188 | FAR1 | HTA11_1391_2000001011 | Human | Colorectum | AD | 3.39e-05 | -4.69e-01 | -0.059 |
| 84188 | FAR1 | HTA11_2992_2000001011 | Human | Colorectum | SER | 3.17e-02 | -5.93e-01 | -0.1706 |
| 84188 | FAR1 | HTA11_5212_2000001011 | Human | Colorectum | AD | 4.18e-04 | -6.54e-01 | -0.2061 |
| 84188 | FAR1 | HTA11_5216_2000001011 | Human | Colorectum | SER | 2.12e-04 | -7.01e-01 | -0.1462 |
| 84188 | FAR1 | HTA11_9341_2000001011 | Human | Colorectum | SER | 1.32e-03 | -9.04e-01 | -0.00410000000000005 |
| 84188 | FAR1 | HTA11_7862_2000001011 | Human | Colorectum | AD | 6.34e-05 | -5.39e-01 | -0.0179 |
| 84188 | FAR1 | HTA11_866_3004761011 | Human | Colorectum | AD | 3.02e-33 | -8.83e-01 | 0.096 |
| 84188 | FAR1 | HTA11_4255_2000001011 | Human | Colorectum | SER | 3.00e-03 | -6.74e-01 | 0.0446 |
| 84188 | FAR1 | HTA11_8622_2000001021 | Human | Colorectum | SER | 2.69e-10 | -9.42e-01 | 0.0528 |
| 84188 | FAR1 | HTA11_10711_2000001011 | Human | Colorectum | AD | 2.75e-17 | -7.35e-01 | 0.0338 |
| 84188 | FAR1 | HTA11_7696_3000711011 | Human | Colorectum | AD | 1.77e-37 | -7.41e-01 | 0.0674 |
| 84188 | FAR1 | HTA11_6818_2000001011 | Human | Colorectum | AD | 2.69e-08 | -7.99e-01 | 0.0112 |
| 84188 | FAR1 | HTA11_11156_2000001011 | Human | Colorectum | AD | 4.76e-04 | -9.88e-01 | 0.0397 |
| Page: 1 2 3 4 5 6 7 8 9 |
| Tissue | Expression Dynamics | Abbreviation |
| Colorectum (GSE201348) | 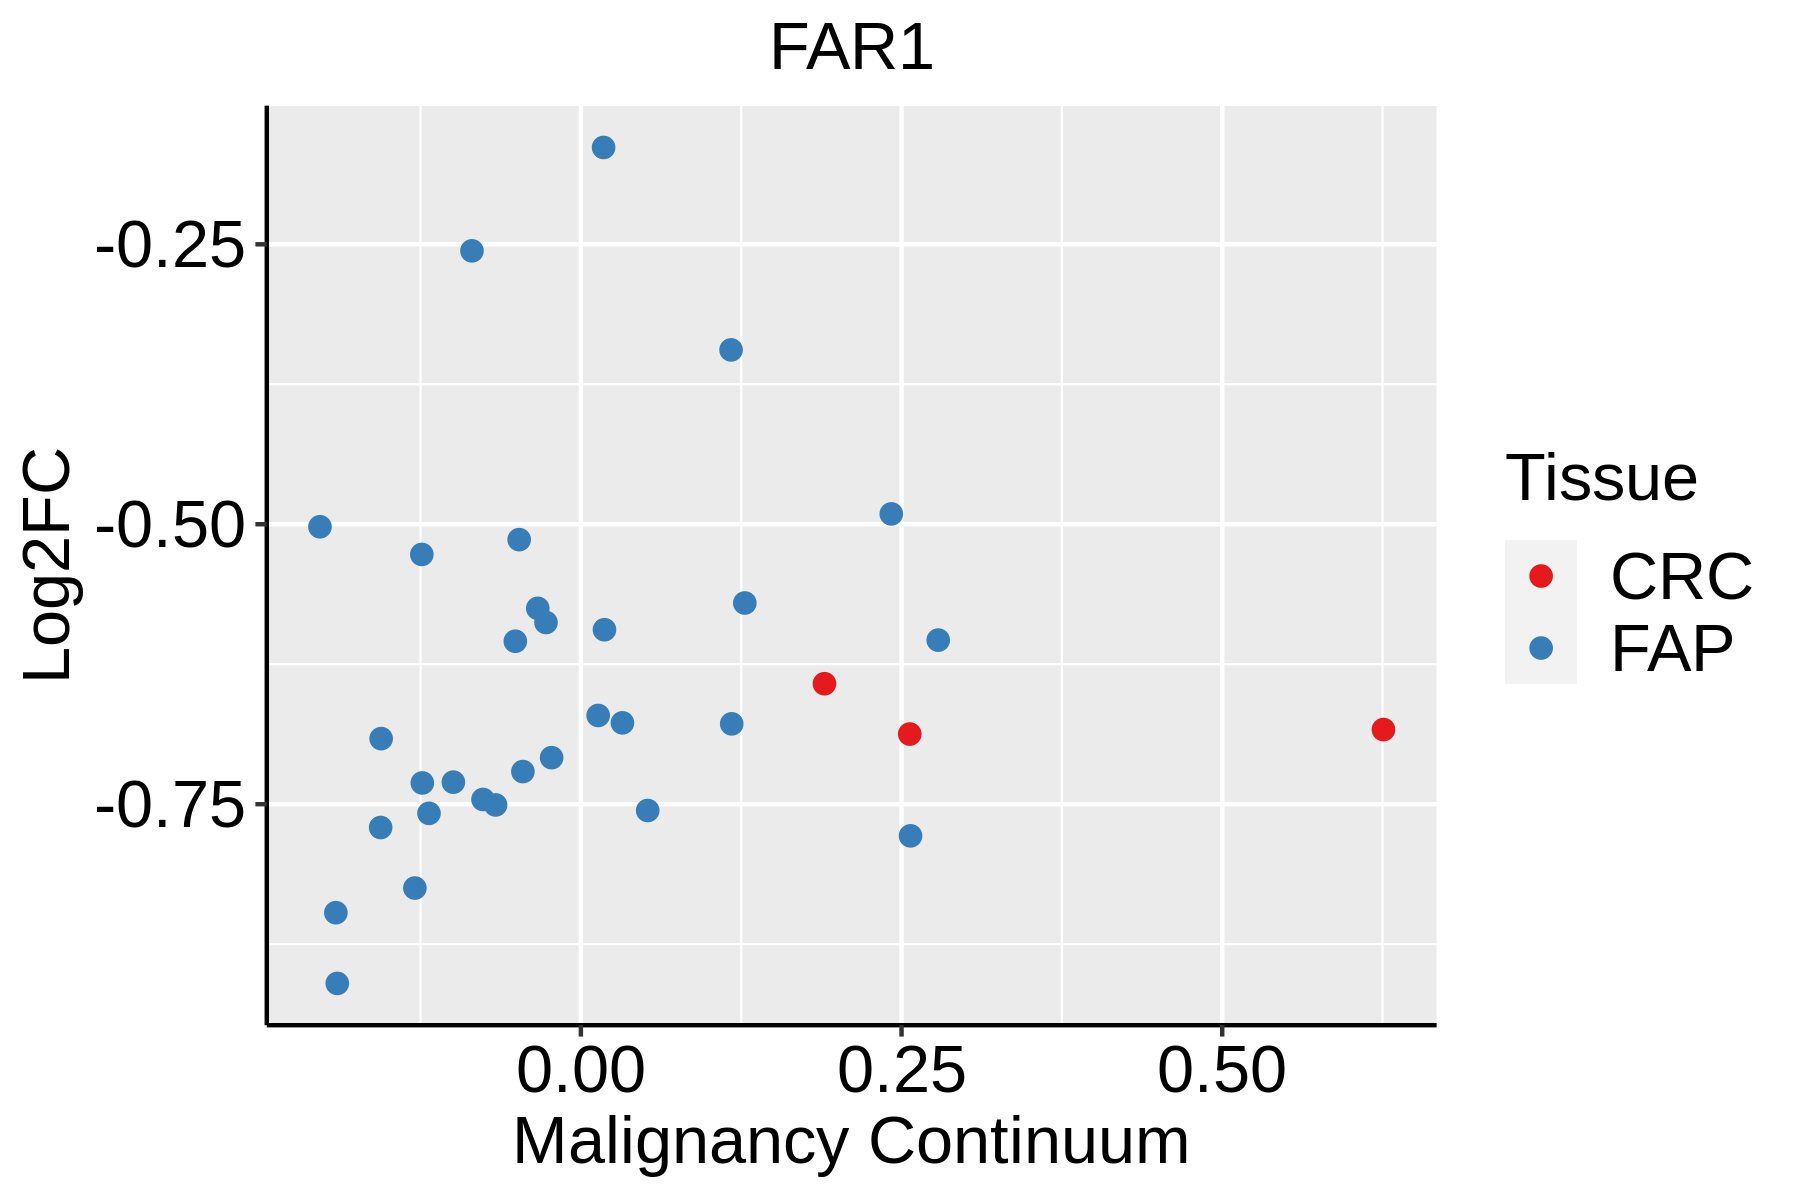 | FAP: Familial adenomatous polyposis |
| CRC: Colorectal cancer | ||
| Colorectum (HTA11) |  | AD: Adenomas |
| SER: Sessile serrated lesions | ||
| MSI-H: Microsatellite-high colorectal cancer | ||
| MSS: Microsatellite stable colorectal cancer | ||
| Esophagus |  | ESCC: Esophageal squamous cell carcinoma |
| HGIN: High-grade intraepithelial neoplasias | ||
| LGIN: Low-grade intraepithelial neoplasias | ||
| Oral Cavity | 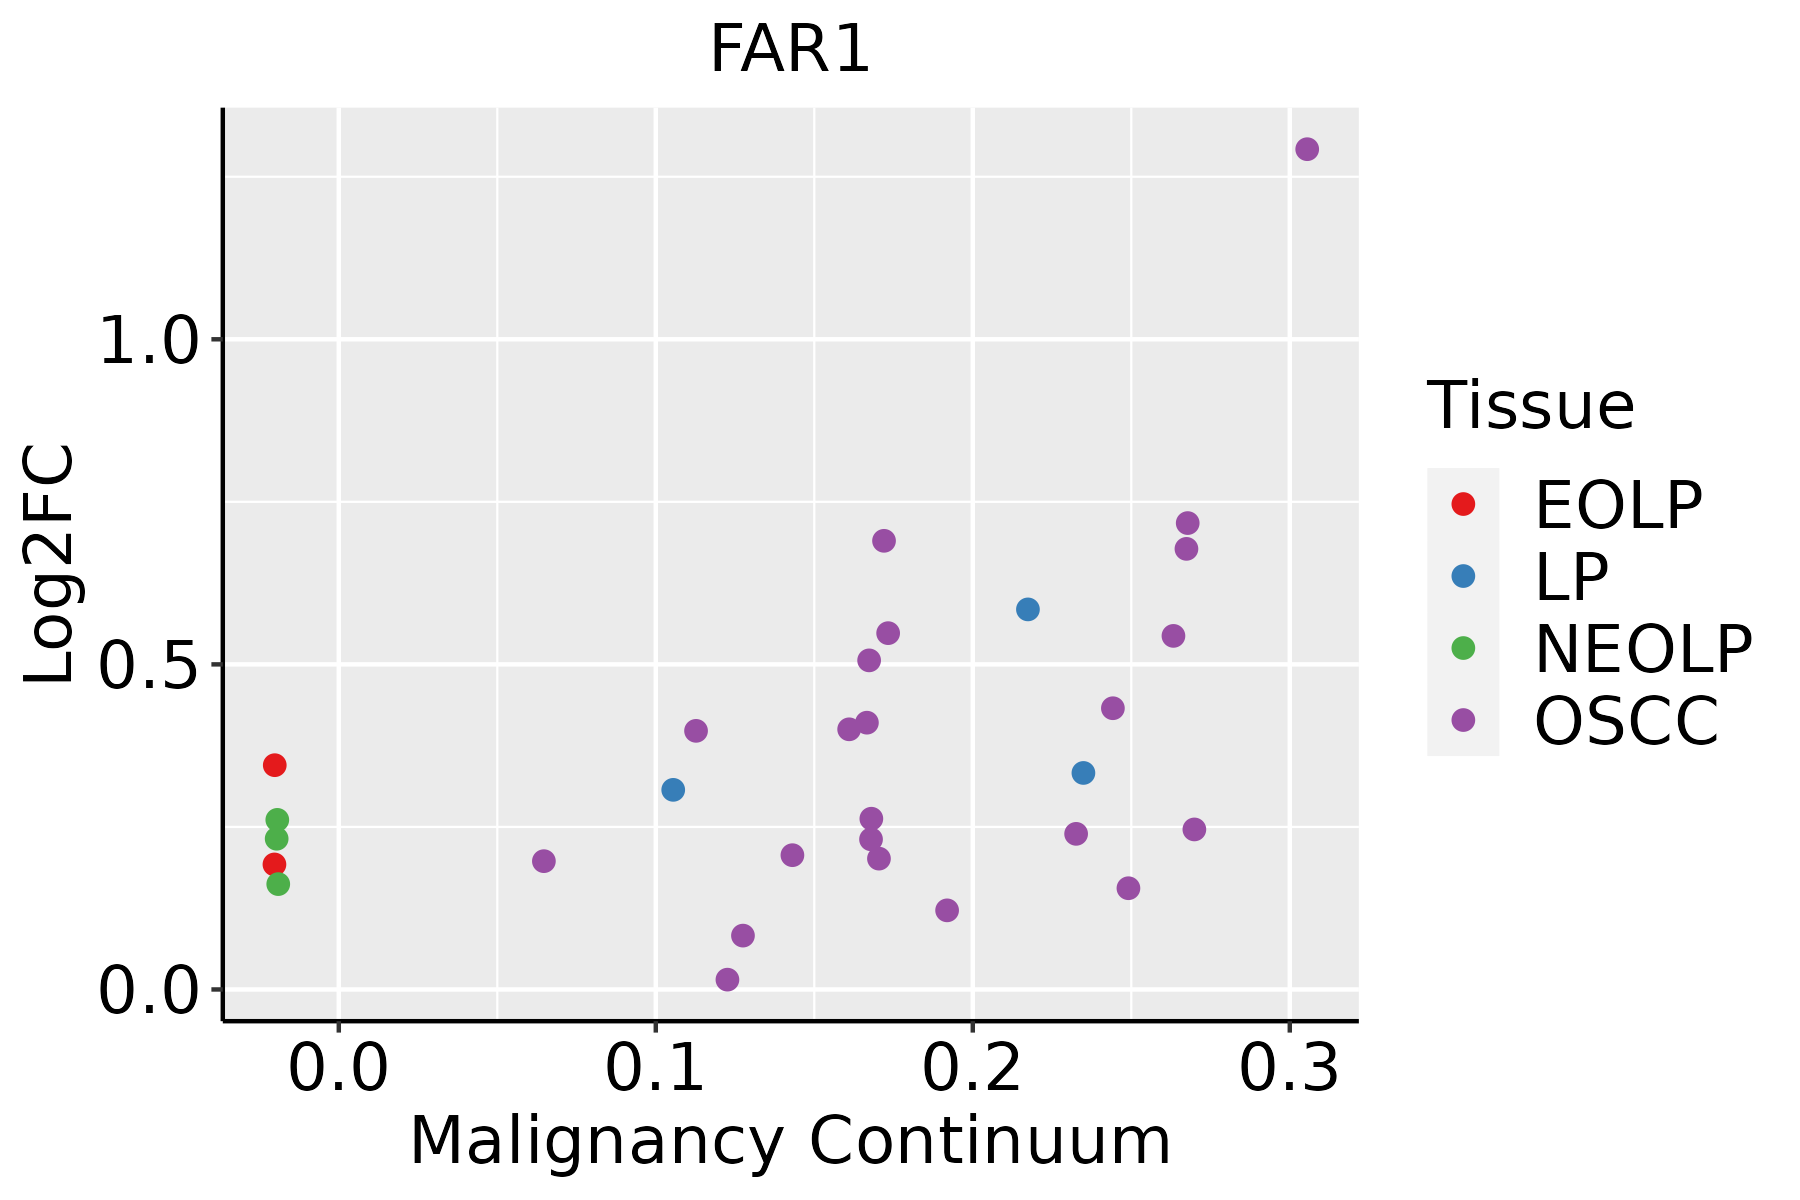 | EOLP: Erosive Oral lichen planus |
| LP: leukoplakia | ||
| NEOLP: Non-erosive oral lichen planus | ||
| OSCC: Oral squamous cell carcinoma | ||
| Prostate | 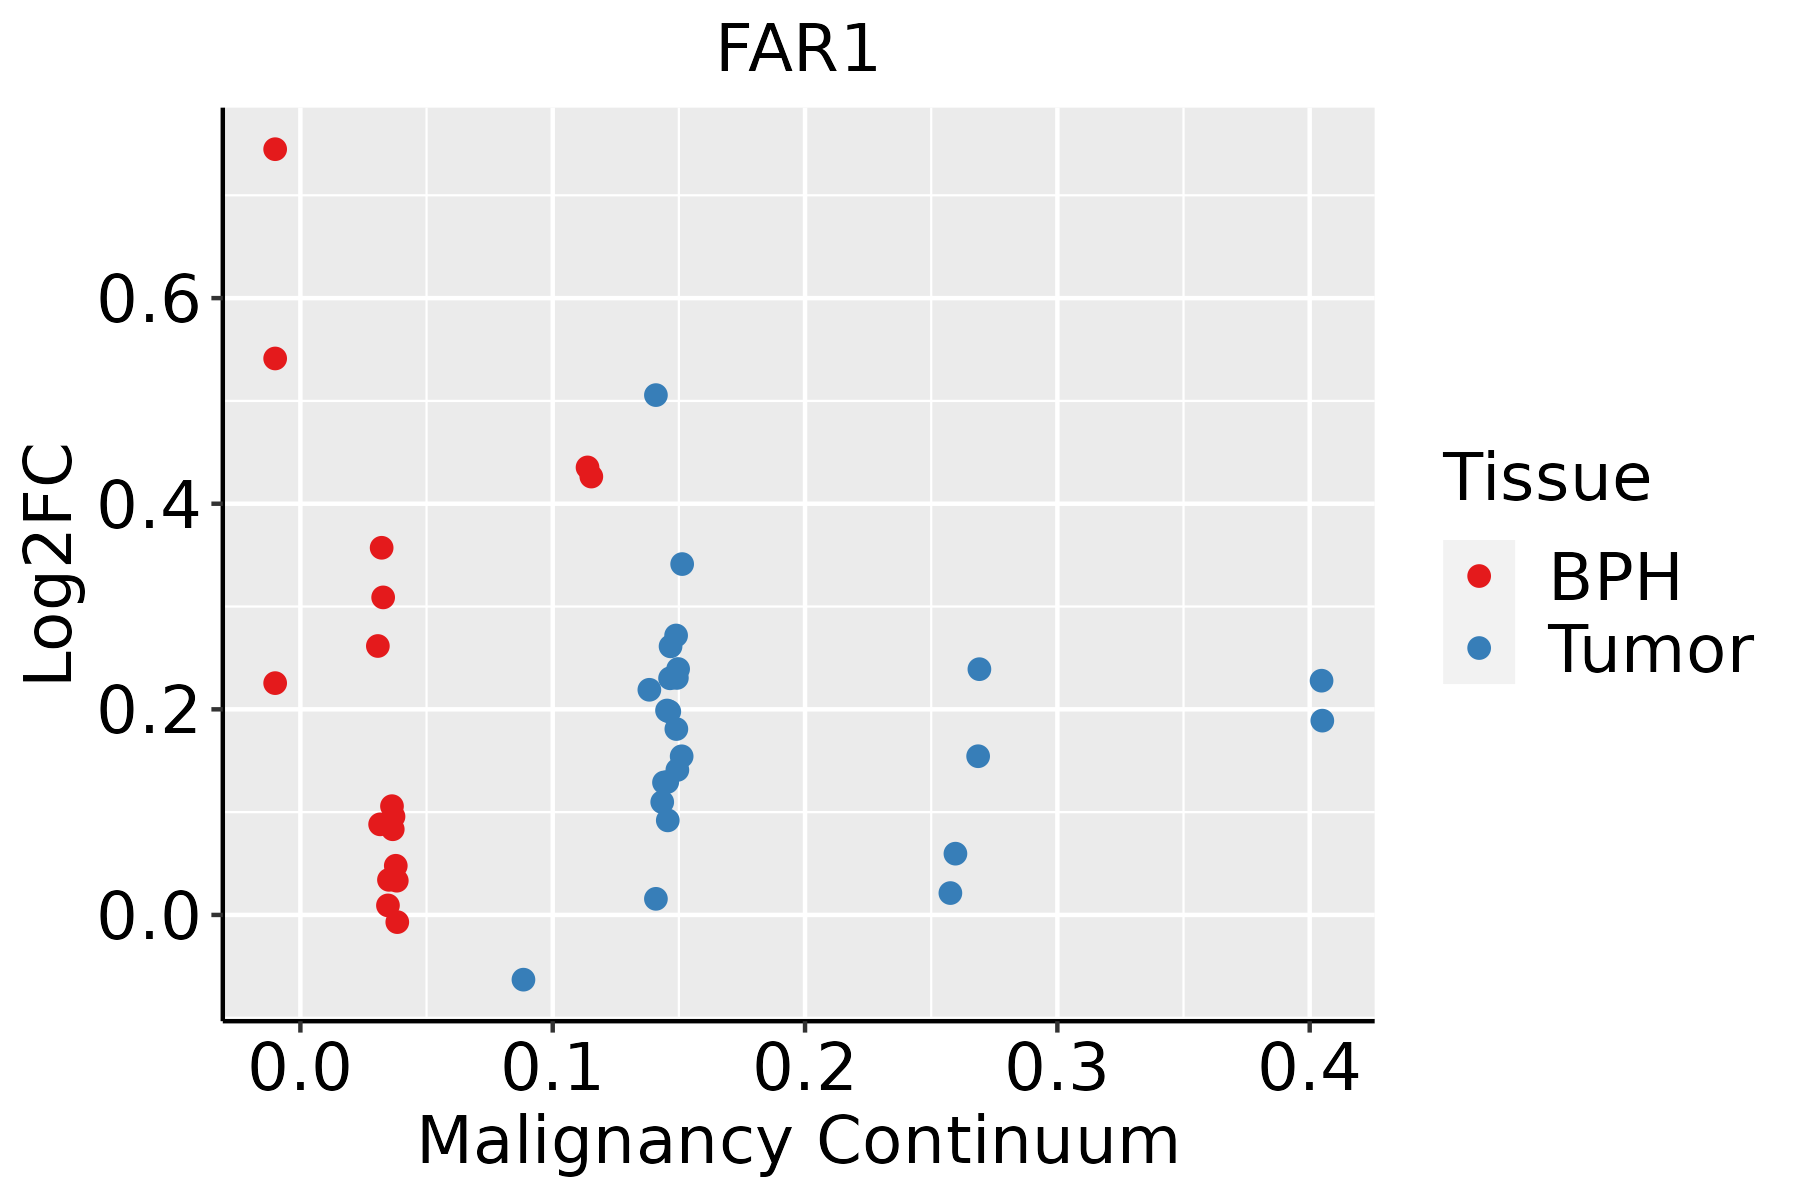 | BPH: Benign Prostatic Hyperplasia |
| Skin | 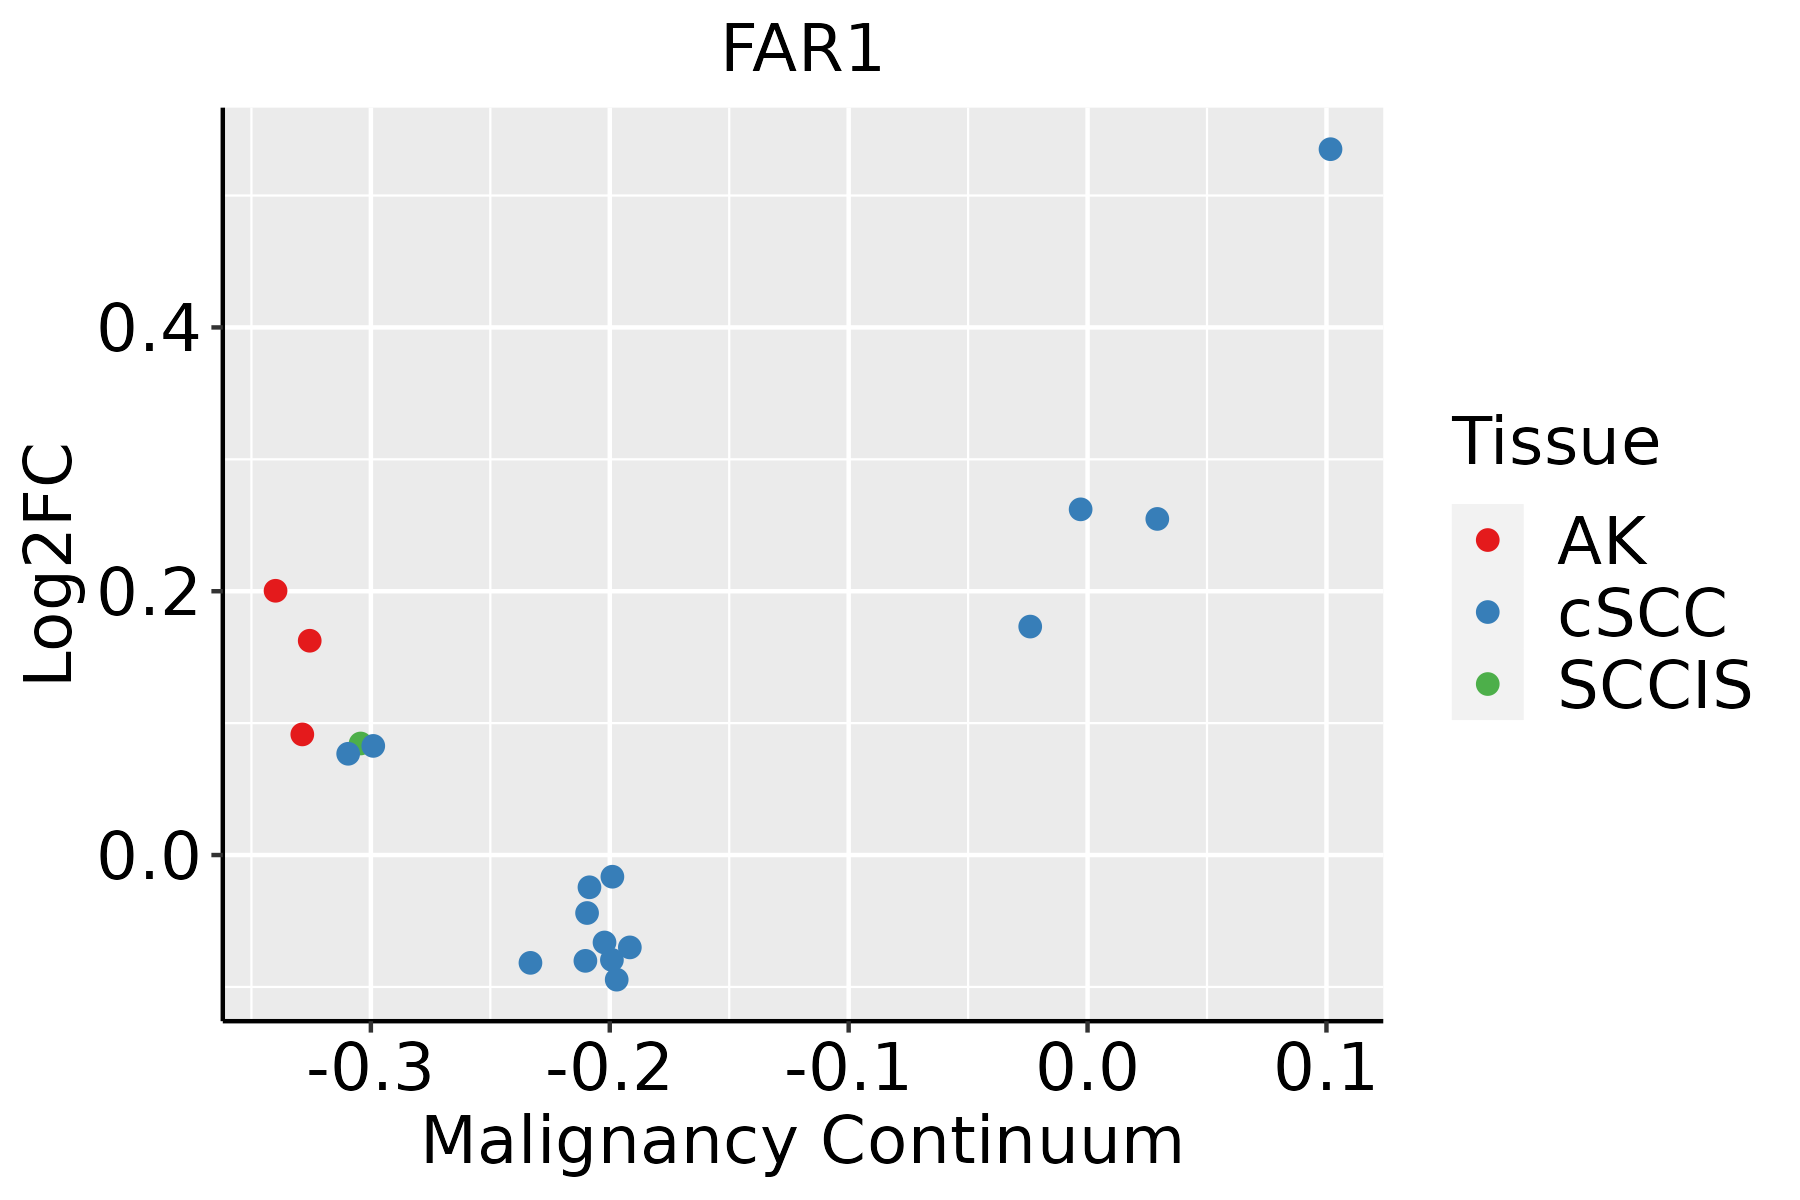 | AK: Actinic keratosis |
| cSCC: Cutaneous squamous cell carcinoma | ||
| SCCIS:squamous cell carcinoma in situ | ||
| Thyroid | 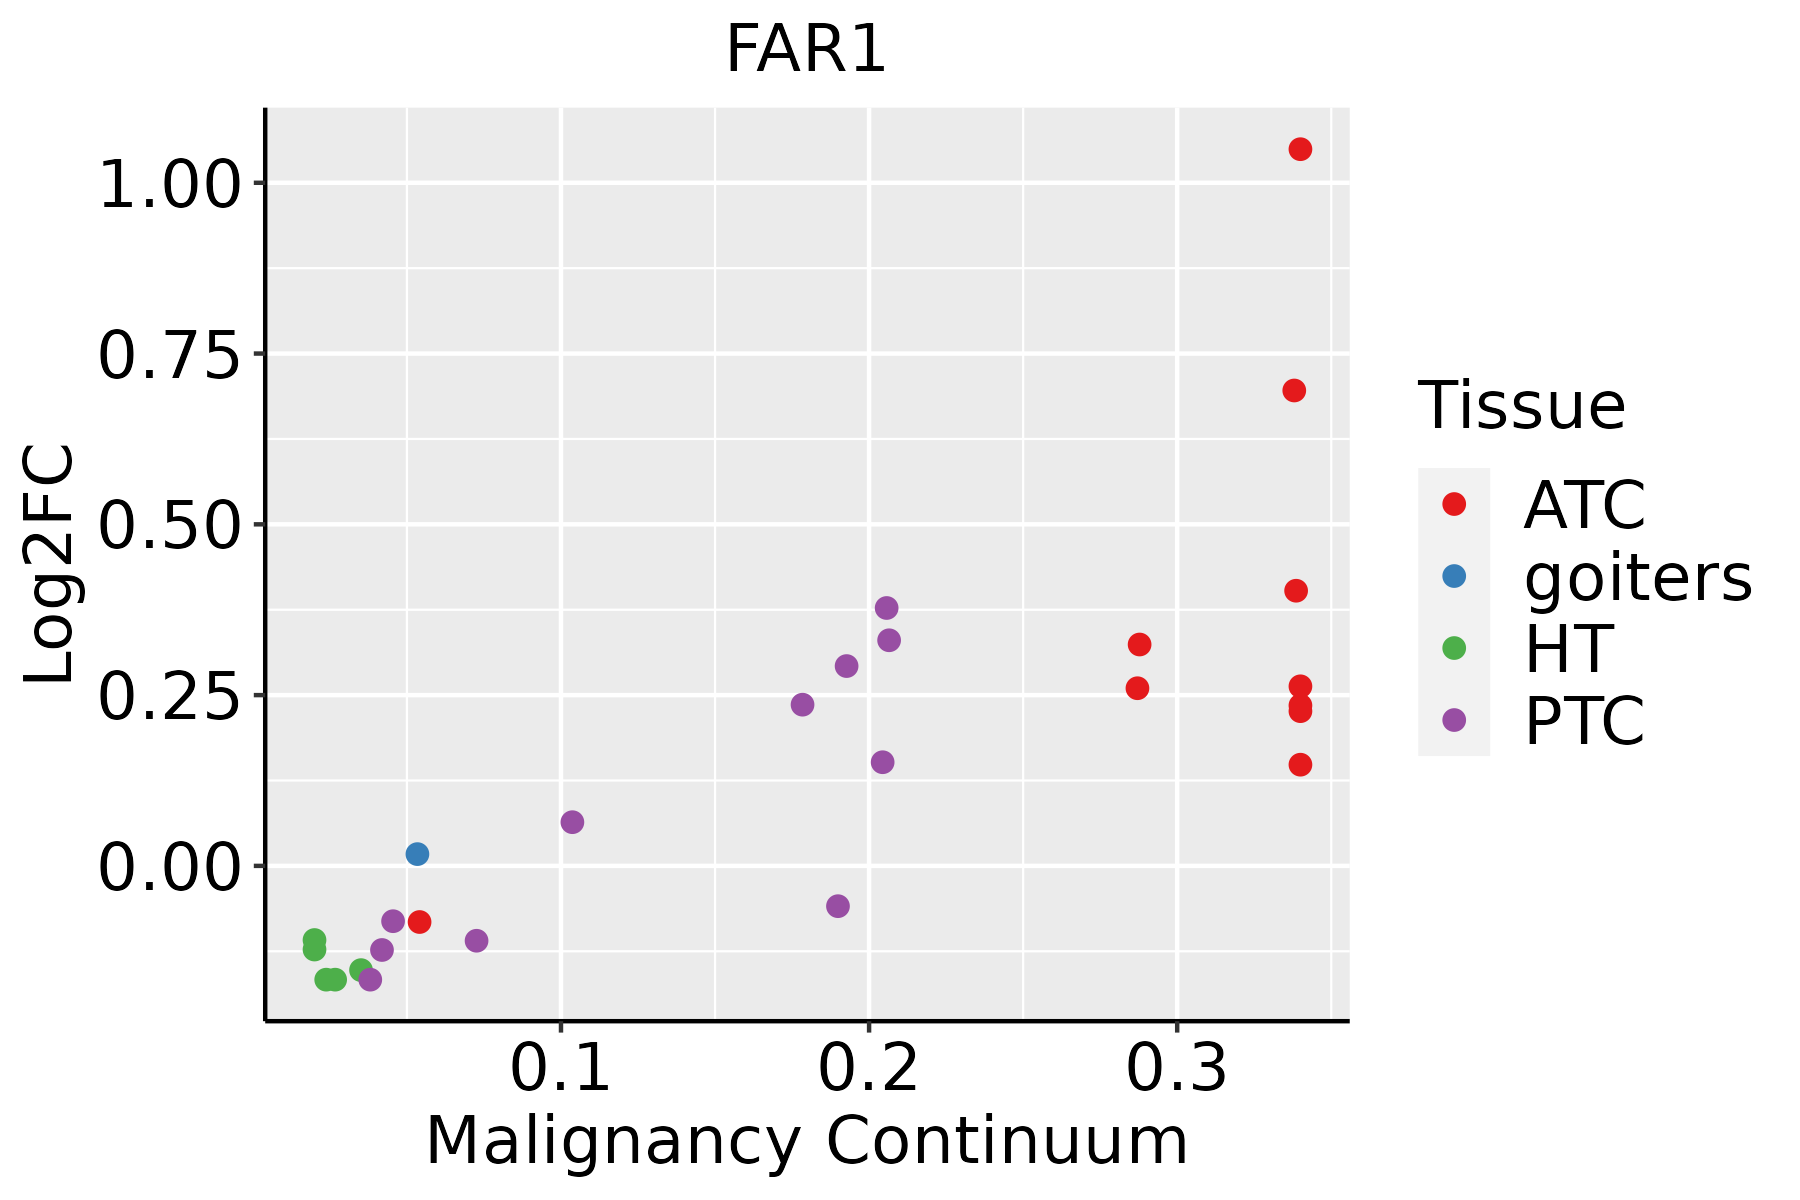 | ATC: Anaplastic thyroid cancer |
| HT: Hashimoto's thyroiditis | ||
| PTC: Papillary thyroid cancer |
| ∗log2FC in expression of this searched gene in stem-like cells from each diseased tissue sample relative to stem-like cells in normal samples in each tissue plotted against the malignancy continuum. Samples are colored based on if they are from different disease stage. |
Top |
Malignant transformation related pathway analysis |
| Find out the enriched GO biological processes and KEGG pathways involved in transition from healthy to precancer to cancer |
| Tissue | Disease Stage | Enriched GO biological Processes |
| Colorectum | AD |  |
| Colorectum | SER |  |
| Colorectum | MSS |  |
| Colorectum | MSI-H |  |
| Colorectum | FAP |  |
| ∗Top 15 enriched GO BP terms are showed in the bar plot of each disease state in each tissue. Each row represents a significant GO biological process which is colored according to the -log10(p.adjust). |
| Page: 1 2 3 4 5 6 7 8 9 |
| GO ID | Tissue | Disease Stage | Description | Gene Ratio | Bg Ratio | pvalue | p.adjust | Count |
| GO:00061634 | Colorectum | FAP | purine nucleotide metabolic process | 100/2622 | 396/18723 | 1.45e-09 | 2.77e-07 | 100 |
| GO:00092593 | Colorectum | FAP | ribonucleotide metabolic process | 97/2622 | 385/18723 | 2.90e-09 | 5.07e-07 | 97 |
| GO:00725214 | Colorectum | FAP | purine-containing compound metabolic process | 101/2622 | 416/18723 | 1.11e-08 | 1.33e-06 | 101 |
| GO:00196933 | Colorectum | FAP | ribose phosphate metabolic process | 97/2622 | 396/18723 | 1.35e-08 | 1.51e-06 | 97 |
| GO:00091174 | Colorectum | FAP | nucleotide metabolic process | 105/2622 | 489/18723 | 3.52e-06 | 1.25e-04 | 105 |
| GO:00067534 | Colorectum | FAP | nucleoside phosphate metabolic process | 105/2622 | 497/18723 | 7.47e-06 | 2.25e-04 | 105 |
| GO:0008654 | Colorectum | FAP | phospholipid biosynthetic process | 54/2622 | 253/18723 | 8.88e-04 | 9.08e-03 | 54 |
| GO:00066502 | Colorectum | FAP | glycerophospholipid metabolic process | 62/2622 | 306/18723 | 1.54e-03 | 1.38e-02 | 62 |
| GO:00066442 | Colorectum | FAP | phospholipid metabolic process | 74/2622 | 383/18723 | 2.24e-03 | 1.83e-02 | 74 |
| GO:00189042 | Colorectum | FAP | ether metabolic process | 10/2622 | 27/18723 | 2.46e-03 | 1.95e-02 | 10 |
| GO:0046474 | Colorectum | FAP | glycerophospholipid biosynthetic process | 44/2622 | 211/18723 | 3.98e-03 | 2.76e-02 | 44 |
| GO:00450172 | Colorectum | FAP | glycerolipid biosynthetic process | 50/2622 | 252/18723 | 6.32e-03 | 3.95e-02 | 50 |
| GO:00066622 | Colorectum | FAP | glycerol ether metabolic process | 8/2622 | 22/18723 | 7.51e-03 | 4.47e-02 | 8 |
| GO:00091505 | Colorectum | CRC | purine ribonucleotide metabolic process | 74/2078 | 368/18723 | 2.58e-07 | 2.38e-05 | 74 |
| GO:00061635 | Colorectum | CRC | purine nucleotide metabolic process | 78/2078 | 396/18723 | 2.98e-07 | 2.59e-05 | 78 |
| GO:00092594 | Colorectum | CRC | ribonucleotide metabolic process | 75/2078 | 385/18723 | 7.83e-07 | 5.04e-05 | 75 |
| GO:00725215 | Colorectum | CRC | purine-containing compound metabolic process | 79/2078 | 416/18723 | 1.15e-06 | 6.75e-05 | 79 |
| GO:00196934 | Colorectum | CRC | ribose phosphate metabolic process | 75/2078 | 396/18723 | 2.36e-06 | 1.13e-04 | 75 |
| GO:00086541 | Colorectum | CRC | phospholipid biosynthetic process | 49/2078 | 253/18723 | 7.07e-05 | 1.51e-03 | 49 |
| GO:00091175 | Colorectum | CRC | nucleotide metabolic process | 81/2078 | 489/18723 | 1.45e-04 | 2.65e-03 | 81 |
| Page: 1 2 3 4 5 6 7 8 |
| Pathway ID | Tissue | Disease Stage | Description | Gene Ratio | Bg Ratio | pvalue | p.adjust | qvalue | Count |
| hsa041467 | Esophagus | ESCC | Peroxisome | 55/4205 | 82/8465 | 1.04e-03 | 3.27e-03 | 1.68e-03 | 55 |
| hsa0414612 | Esophagus | ESCC | Peroxisome | 55/4205 | 82/8465 | 1.04e-03 | 3.27e-03 | 1.68e-03 | 55 |
| hsa041466 | Oral cavity | OSCC | Peroxisome | 47/3704 | 82/8465 | 9.01e-03 | 2.01e-02 | 1.03e-02 | 47 |
| hsa0414611 | Oral cavity | OSCC | Peroxisome | 47/3704 | 82/8465 | 9.01e-03 | 2.01e-02 | 1.03e-02 | 47 |
| Page: 1 |
Top |
Cell-cell communication analysis |
| Identification of potential cell-cell interactions between two cell types and their ligand-receptor pairs for different disease states |
| Ligand | Receptor | LRpair | Pathway | Tissue | Disease Stage |
| Page: 1 |
Top |
Single-cell gene regulatory network inference analysis |
| Find out the significant the regulons (TFs) and the target genes of each regulon across cell types for different disease states |
| TF | Cell Type | Tissue | Disease Stage | Target Gene | RSS | Regulon Activity |
| ∗The dot plots of a searched regulon are shown for all cell subpopulations in each disease state of each tissue based on the regulon specific score inferred using pySCENIC and by calculating the average expression. |
| Page: 1 |
Top |
Somatic mutation of malignant transformation related genes |
| Annotation of somatic variants for genes involved in malignant transformation |
| Hugo Symbol | Variant Class | Variant Classification | dbSNP RS | HGVSc | HGVSp | HGVSp Short | SWISSPROT | BIOTYPE | SIFT | PolyPhen | Tumor Sample Barcode | Tissue | Histology | Sex | Age | Stage | Therapy Types | Drugs | Outcome |
| FAR1 | SNV | Missense_Mutation | novel | c.1048N>G | p.His350Asp | p.H350D | Q8WVX9 | protein_coding | tolerated(0.62) | benign(0.001) | TCGA-D8-A4Z1-01 | Breast | breast invasive carcinoma | Female | >=65 | I/II | Hormone Therapy | tamoxiphen | SD |
| FAR1 | SNV | Missense_Mutation | c.588N>C | p.Leu196Phe | p.L196F | Q8WVX9 | protein_coding | deleterious(0) | probably_damaging(0.995) | TCGA-LL-A73Z-01 | Breast | breast invasive carcinoma | Female | <65 | III/IV | Chemotherapy | adriamycin | PD | |
| FAR1 | insertion | Frame_Shift_Ins | novel | c.1348_1349insAAAGCCTGTACCATTT | p.Met450LysfsTer27 | p.M450Kfs*27 | Q8WVX9 | protein_coding | TCGA-AR-A0TU-01 | Breast | breast invasive carcinoma | Female | <65 | I/II | Unspecific | Doxorubicin | SD | ||
| FAR1 | insertion | In_Frame_Ins | novel | c.1348_1349insAAAGCCTGTACCATT | p.Met450delinsLysSerLeuTyrHisLeu | p.M450delinsKSLYHL | Q8WVX9 | protein_coding | TCGA-AR-A0U2-01 | Breast | breast invasive carcinoma | Female | <65 | III/IV | Hormone Therapy | tamoxiphen | PD | ||
| FAR1 | SNV | Missense_Mutation | novel | c.899N>G | p.Ile300Ser | p.I300S | Q8WVX9 | protein_coding | tolerated(0.07) | benign(0.033) | TCGA-FU-A3HZ-01 | Cervix | cervical & endocervical cancer | Female | <65 | I/II | Chemotherapy | cisplatin | CR |
| FAR1 | SNV | Missense_Mutation | rs753671320 | c.860N>T | p.Ala287Val | p.A287V | Q8WVX9 | protein_coding | tolerated(0.18) | benign(0.211) | TCGA-A6-5665-01 | Colorectum | colon adenocarcinoma | Female | >=65 | I/II | Unknown | Unknown | PD |
| FAR1 | SNV | Missense_Mutation | novel | c.444N>A | p.Phe148Leu | p.F148L | Q8WVX9 | protein_coding | tolerated(0.72) | benign(0.074) | TCGA-CA-6717-01 | Colorectum | colon adenocarcinoma | Male | <65 | I/II | Chemotherapy | oxaliplatin | CR |
| FAR1 | SNV | Missense_Mutation | c.1081G>A | p.Ala361Thr | p.A361T | Q8WVX9 | protein_coding | deleterious(0.01) | probably_damaging(0.998) | TCGA-CA-6718-01 | Colorectum | colon adenocarcinoma | Male | <65 | I/II | Unknown | Unknown | PD | |
| FAR1 | SNV | Missense_Mutation | c.242N>T | p.Ala81Val | p.A81V | Q8WVX9 | protein_coding | tolerated(0.18) | benign(0.053) | TCGA-F4-6856-01 | Colorectum | colon adenocarcinoma | Male | <65 | I/II | Ancillary | leucovorin | CR | |
| FAR1 | SNV | Missense_Mutation | c.416N>T | p.Ala139Val | p.A139V | Q8WVX9 | protein_coding | tolerated(0.12) | probably_damaging(0.983) | TCGA-G4-6302-01 | Colorectum | colon adenocarcinoma | Female | >=65 | I/II | Unknown | Unknown | SD |
| Page: 1 2 3 4 5 6 |
Top |
Related drugs of malignant transformation related genes |
| Identification of chemicals and drugs interact with genes involved in malignant transfromation |
| (DGIdb 4.0) |
| Entrez ID | Symbol | Category | Interaction Types | Drug Claim Name | Drug Name | PMIDs |
| Page: 1 |

Copyright 2023-Present -The University of Texas Health Science Center at Houston |