
|
|||||
|
 | |
| |
| |
| |
| |
| |
|
Gene: FAM171A1 |
Gene summary for FAM171A1 |
| Gene information | Species | Human | Gene symbol | FAM171A1 | Gene ID | 221061 |
| Gene name | family with sequence similarity 171 member A1 | |
| Gene Alias | APCN | |
| Cytomap | 10p13 | |
| Gene Type | protein-coding | GO ID | GO:0000902 | UniProtAcc | B3KMX9 |
Top |
Malignant transformation analysis |
| Identification of the aberrant gene expression in precancerous and cancerous lesions by comparing the gene expression of stem-like cells in diseased tissues with normal stem cells |
| Entrez ID | Symbol | Replicates | Species | Organ | Tissue | Adj P-value | Log2FC | Malignancy |
| 221061 | FAM171A1 | HTA11_3410_2000001011 | Human | Colorectum | AD | 2.72e-10 | -5.15e-01 | 0.0155 |
| 221061 | FAM171A1 | HTA11_3361_2000001011 | Human | Colorectum | AD | 3.45e-03 | -5.12e-01 | -0.1207 |
| 221061 | FAM171A1 | HTA11_99999974143_84620 | Human | Colorectum | MSS | 4.14e-22 | -6.38e-01 | 0.3005 |
| 221061 | FAM171A1 | F007 | Human | Colorectum | FAP | 1.27e-06 | -5.01e-01 | 0.1176 |
| 221061 | FAM171A1 | A002-C-010 | Human | Colorectum | FAP | 1.15e-12 | -3.64e-01 | 0.242 |
| 221061 | FAM171A1 | A001-C-207 | Human | Colorectum | FAP | 3.04e-06 | -3.59e-01 | 0.1278 |
| 221061 | FAM171A1 | A015-C-203 | Human | Colorectum | FAP | 2.56e-39 | -5.28e-01 | -0.1294 |
| 221061 | FAM171A1 | A015-C-204 | Human | Colorectum | FAP | 1.16e-08 | -4.57e-01 | -0.0228 |
| 221061 | FAM171A1 | A014-C-040 | Human | Colorectum | FAP | 5.17e-04 | -2.11e-01 | -0.1184 |
| 221061 | FAM171A1 | A002-C-201 | Human | Colorectum | FAP | 3.82e-23 | -6.08e-01 | 0.0324 |
| 221061 | FAM171A1 | A002-C-203 | Human | Colorectum | FAP | 2.80e-16 | -5.28e-01 | 0.2786 |
| 221061 | FAM171A1 | A001-C-119 | Human | Colorectum | FAP | 2.94e-08 | -4.33e-01 | -0.1557 |
| 221061 | FAM171A1 | A001-C-108 | Human | Colorectum | FAP | 3.49e-26 | -5.10e-01 | -0.0272 |
| 221061 | FAM171A1 | A002-C-205 | Human | Colorectum | FAP | 5.82e-28 | -6.26e-01 | -0.1236 |
| 221061 | FAM171A1 | A001-C-104 | Human | Colorectum | FAP | 1.00e-06 | -2.95e-01 | 0.0184 |
| 221061 | FAM171A1 | A015-C-005 | Human | Colorectum | FAP | 1.33e-08 | -4.59e-01 | -0.0336 |
| 221061 | FAM171A1 | A015-C-006 | Human | Colorectum | FAP | 1.08e-20 | -5.18e-01 | -0.0994 |
| 221061 | FAM171A1 | A015-C-106 | Human | Colorectum | FAP | 7.43e-13 | -3.21e-01 | -0.0511 |
| 221061 | FAM171A1 | A002-C-114 | Human | Colorectum | FAP | 2.66e-22 | -5.20e-01 | -0.1561 |
| 221061 | FAM171A1 | A015-C-104 | Human | Colorectum | FAP | 1.05e-42 | -5.99e-01 | -0.1899 |
| Page: 1 2 3 |
| Tissue | Expression Dynamics | Abbreviation |
| Colorectum (GSE201348) |  | FAP: Familial adenomatous polyposis |
| CRC: Colorectal cancer | ||
| Colorectum (HTA11) | 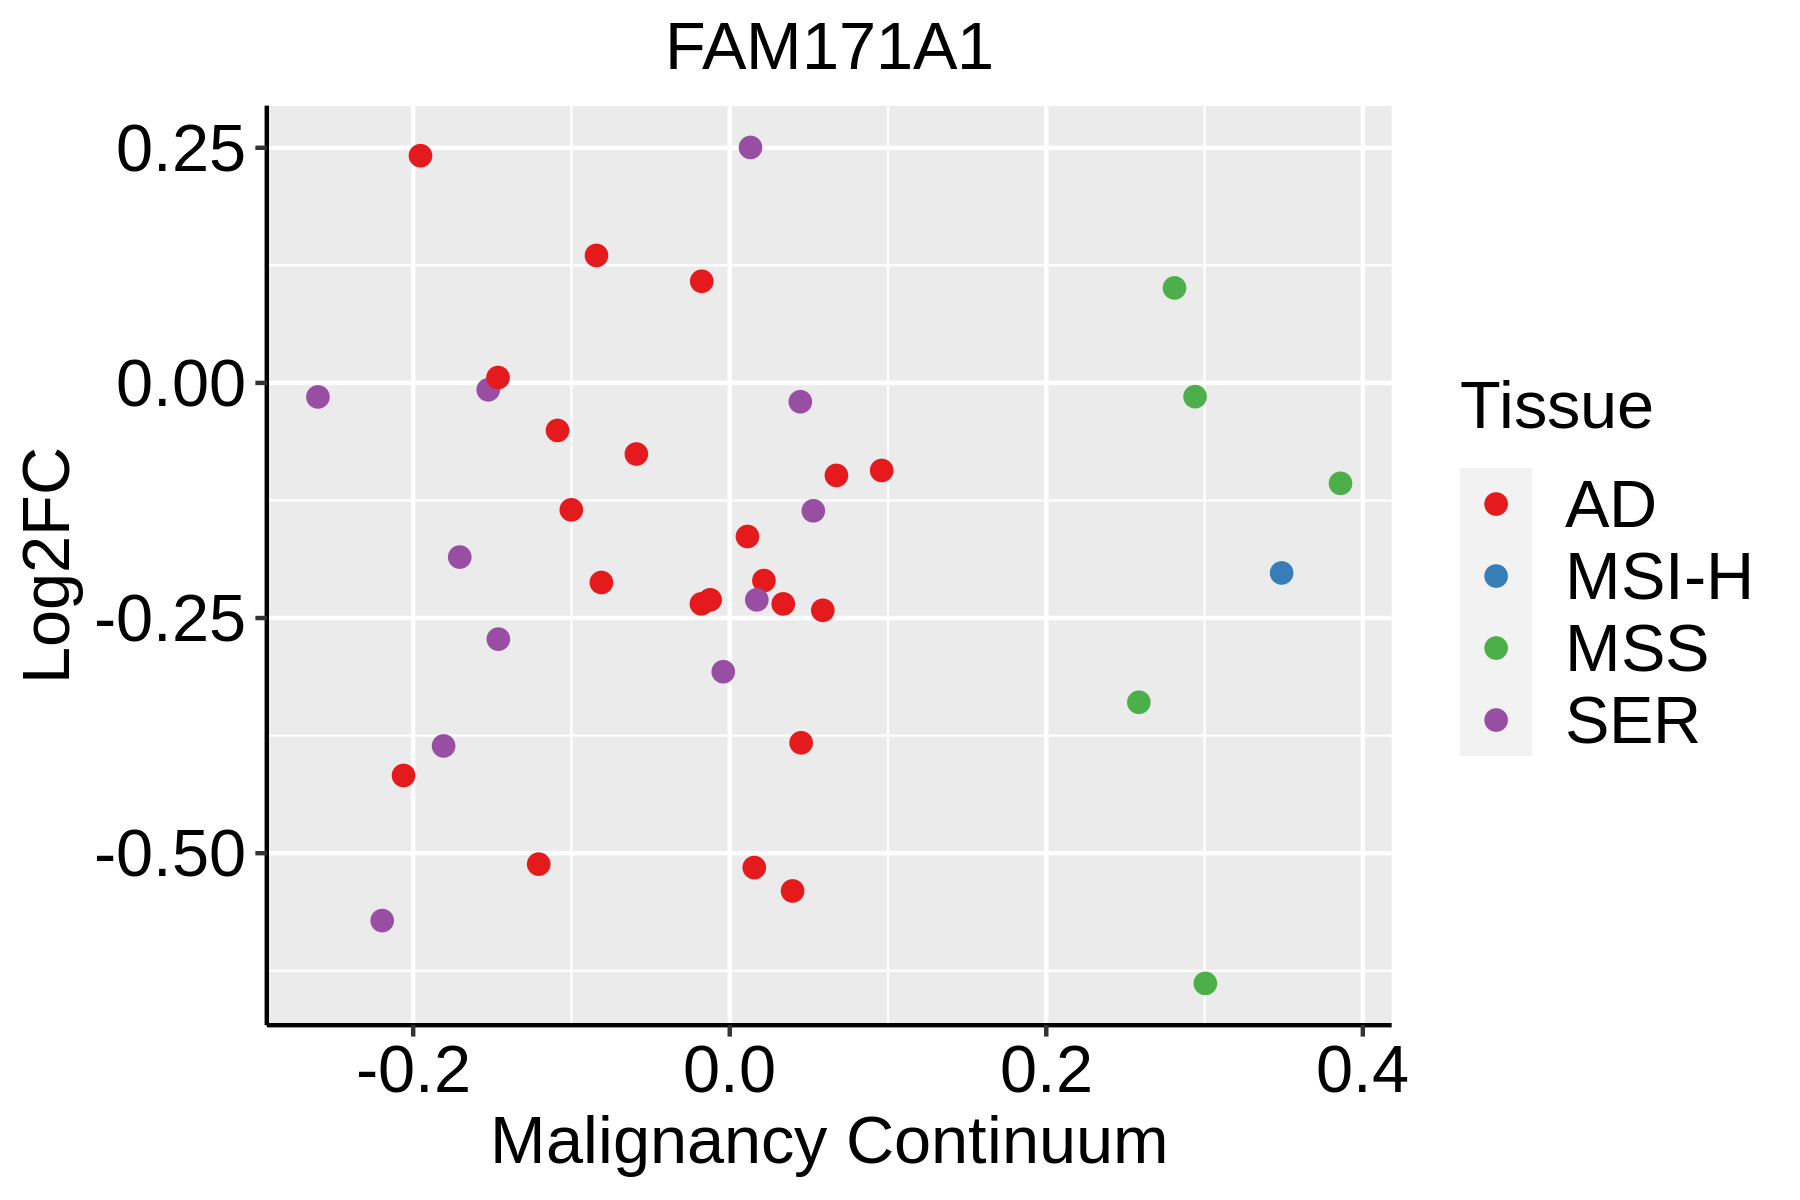 | AD: Adenomas |
| SER: Sessile serrated lesions | ||
| MSI-H: Microsatellite-high colorectal cancer | ||
| MSS: Microsatellite stable colorectal cancer | ||
| Liver | 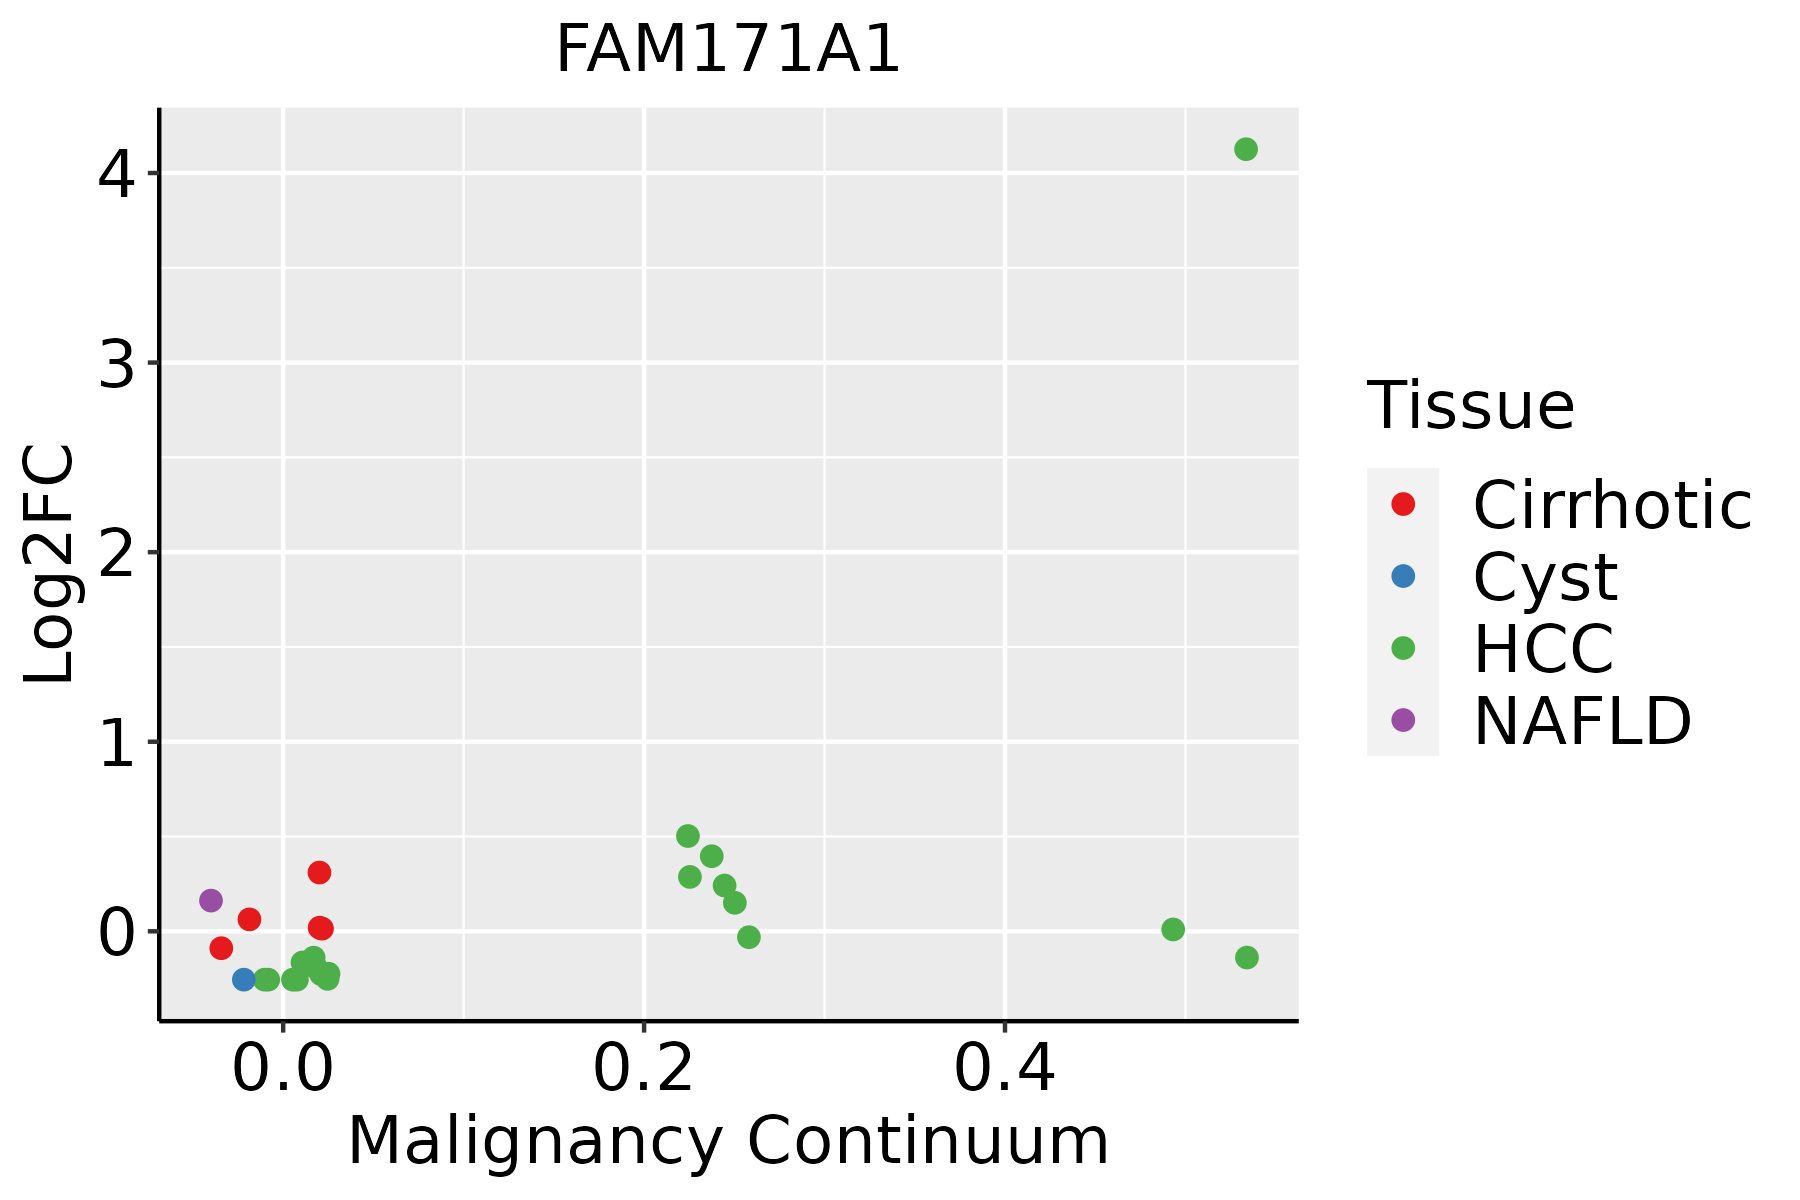 | HCC: Hepatocellular carcinoma |
| NAFLD: Non-alcoholic fatty liver disease |
| ∗log2FC in expression of this searched gene in stem-like cells from each diseased tissue sample relative to stem-like cells in normal samples in each tissue plotted against the malignancy continuum. Samples are colored based on if they are from different disease stage. |
Top |
Malignant transformation related pathway analysis |
| Find out the enriched GO biological processes and KEGG pathways involved in transition from healthy to precancer to cancer |
| Tissue | Disease Stage | Enriched GO biological Processes |
| Colorectum | AD |  |
| Colorectum | SER |  |
| Colorectum | MSS |  |
| Colorectum | MSI-H |  |
| Colorectum | FAP |  |
| ∗Top 15 enriched GO BP terms are showed in the bar plot of each disease state in each tissue. Each row represents a significant GO biological process which is colored according to the -log10(p.adjust). |
| Page: 1 2 3 4 5 6 7 8 9 |
| GO ID | Tissue | Disease Stage | Description | Gene Ratio | Bg Ratio | pvalue | p.adjust | Count |
| GO:002260422 | Liver | HCC | regulation of cell morphogenesis | 188/7958 | 309/18723 | 4.84e-11 | 1.82e-09 | 188 |
| GO:000701522 | Liver | HCC | actin filament organization | 252/7958 | 442/18723 | 3.83e-10 | 1.25e-08 | 252 |
| GO:005101722 | Liver | HCC | actin filament bundle assembly | 96/7958 | 157/18723 | 1.81e-06 | 2.52e-05 | 96 |
| GO:006157222 | Liver | HCC | actin filament bundle organization | 97/7958 | 161/18723 | 4.04e-06 | 5.22e-05 | 97 |
| GO:000836022 | Liver | HCC | regulation of cell shape | 92/7958 | 154/18723 | 1.15e-05 | 1.31e-04 | 92 |
| GO:003103222 | Liver | HCC | actomyosin structure organization | 109/7958 | 196/18723 | 1.39e-04 | 1.13e-03 | 109 |
| GO:003003822 | Liver | HCC | contractile actin filament bundle assembly | 60/7958 | 106/18723 | 2.34e-03 | 1.16e-02 | 60 |
| GO:004314922 | Liver | HCC | stress fiber assembly | 60/7958 | 106/18723 | 2.34e-03 | 1.16e-02 | 60 |
| Page: 1 2 3 |
| Pathway ID | Tissue | Disease Stage | Description | Gene Ratio | Bg Ratio | pvalue | p.adjust | qvalue | Count |
| Page: 1 |
Top |
Cell-cell communication analysis |
| Identification of potential cell-cell interactions between two cell types and their ligand-receptor pairs for different disease states |
| Ligand | Receptor | LRpair | Pathway | Tissue | Disease Stage |
| Page: 1 |
Top |
Single-cell gene regulatory network inference analysis |
| Find out the significant the regulons (TFs) and the target genes of each regulon across cell types for different disease states |
| TF | Cell Type | Tissue | Disease Stage | Target Gene | RSS | Regulon Activity |
| ∗The dot plots of a searched regulon are shown for all cell subpopulations in each disease state of each tissue based on the regulon specific score inferred using pySCENIC and by calculating the average expression. |
| Page: 1 |
Top |
Somatic mutation of malignant transformation related genes |
| Annotation of somatic variants for genes involved in malignant transformation |
| Hugo Symbol | Variant Class | Variant Classification | dbSNP RS | HGVSc | HGVSp | HGVSp Short | SWISSPROT | BIOTYPE | SIFT | PolyPhen | Tumor Sample Barcode | Tissue | Histology | Sex | Age | Stage | Therapy Types | Drugs | Outcome |
| FAM171A1 | SNV | Missense_Mutation | c.1828N>A | p.Glu610Lys | p.E610K | Q5VUB5 | protein_coding | deleterious(0.03) | benign(0.341) | TCGA-A1-A0SI-01 | Breast | breast invasive carcinoma | Female | <65 | I/II | Unknown | Unknown | SD | |
| FAM171A1 | SNV | Missense_Mutation | c.768N>C | p.Lys256Asn | p.K256N | Q5VUB5 | protein_coding | deleterious(0) | probably_damaging(0.99) | TCGA-A2-A04W-01 | Breast | breast invasive carcinoma | Female | <65 | I/II | Chemotherapy | cytoxan | SD | |
| FAM171A1 | SNV | Missense_Mutation | c.2388N>C | p.Gln796His | p.Q796H | Q5VUB5 | protein_coding | tolerated(0.07) | possibly_damaging(0.446) | TCGA-A8-A06Q-01 | Breast | breast invasive carcinoma | Female | <65 | III/IV | Unknown | Unknown | SD | |
| FAM171A1 | SNV | Missense_Mutation | c.1896N>T | p.Gln632His | p.Q632H | Q5VUB5 | protein_coding | tolerated(0.15) | benign(0.062) | TCGA-A8-A06Q-01 | Breast | breast invasive carcinoma | Female | <65 | III/IV | Unknown | Unknown | SD | |
| FAM171A1 | SNV | Missense_Mutation | c.2305N>A | p.Val769Ile | p.V769I | Q5VUB5 | protein_coding | tolerated(0.23) | benign(0.024) | TCGA-AR-A254-01 | Breast | breast invasive carcinoma | Female | <65 | III/IV | Chemotherapy | paclitaxel | SD | |
| FAM171A1 | SNV | Missense_Mutation | rs764160938 | c.731C>T | p.Ala244Val | p.A244V | Q5VUB5 | protein_coding | tolerated(0.12) | possibly_damaging(0.524) | TCGA-BH-A0BO-01 | Breast | breast invasive carcinoma | Female | <65 | I/II | Unknown | Unknown | SD |
| FAM171A1 | SNV | Missense_Mutation | c.1421N>T | p.Arg474Ile | p.R474I | Q5VUB5 | protein_coding | tolerated(0.26) | benign(0.003) | TCGA-BH-A1F2-01 | Breast | breast invasive carcinoma | Female | <65 | III/IV | Unknown | Unknown | SD | |
| FAM171A1 | insertion | In_Frame_Ins | novel | c.1090_1091insGCAGGA | p.Leu364delinsCysArgMet | p.L364delinsCRM | Q5VUB5 | protein_coding | TCGA-AN-A04A-01 | Breast | breast invasive carcinoma | Female | <65 | III/IV | Unknown | Unknown | SD | ||
| FAM171A1 | insertion | Frame_Shift_Ins | novel | c.1088_1089insGTGGTGGCCAGCTGCCCAGC | p.Asn363LysfsTer38 | p.N363Kfs*38 | Q5VUB5 | protein_coding | TCGA-AN-A04A-01 | Breast | breast invasive carcinoma | Female | <65 | III/IV | Unknown | Unknown | SD | ||
| FAM171A1 | insertion | Frame_Shift_Ins | novel | c.1292_1293insGGACCGCAGACCCACTGAATGTATGATGTCGCGATCAGTAGATC | p.Leu432AspfsTer50 | p.L432Dfs*50 | Q5VUB5 | protein_coding | TCGA-AO-A0JB-01 | Breast | breast invasive carcinoma | Female | <65 | III/IV | Chemotherapy | cyclophosphamide | SD |
| Page: 1 2 3 4 5 6 7 8 9 10 11 12 |
Top |
Related drugs of malignant transformation related genes |
| Identification of chemicals and drugs interact with genes involved in malignant transfromation |
| (DGIdb 4.0) |
| Entrez ID | Symbol | Category | Interaction Types | Drug Claim Name | Drug Name | PMIDs |
| Page: 1 |

Copyright 2023-Present -The University of Texas Health Science Center at Houston |