
|
|||||
|
 | |
| |
| |
| |
| |
| |
|
Gene: FAM107A |
Gene summary for FAM107A |
| Gene information | Species | Human | Gene symbol | FAM107A | Gene ID | 11170 |
| Gene name | family with sequence similarity 107 member A | |
| Gene Alias | DRR1 | |
| Cytomap | 3p14.3-p14.2 | |
| Gene Type | protein-coding | GO ID | GO:0000082 | UniProtAcc | O95990 |
Top |
Malignant transformation analysis |
| Identification of the aberrant gene expression in precancerous and cancerous lesions by comparing the gene expression of stem-like cells in diseased tissues with normal stem cells |
| Entrez ID | Symbol | Replicates | Species | Organ | Tissue | Adj P-value | Log2FC | Malignancy |
| 11170 | FAM107A | GSM5252134_BPH511PrG_Fcol_3GEX | Human | Prostate | BPH | 2.66e-02 | -1.43e-01 | -0.1433 |
| 11170 | FAM107A | 047563_1562-all-cells | Human | Prostate | BPH | 3.06e-04 | -1.57e-01 | 0.0791 |
| 11170 | FAM107A | 048752_1579-all-cells | Human | Prostate | BPH | 1.71e-02 | -1.41e-01 | 0.1008 |
| 11170 | FAM107A | 052095_1628-all-cells | Human | Prostate | BPH | 4.66e-02 | -1.13e-01 | 0.1032 |
| 11170 | FAM107A | Dong_P1 | Human | Prostate | Tumor | 5.99e-06 | -1.87e-01 | 0.035 |
| 11170 | FAM107A | Dong_P3 | Human | Prostate | Tumor | 7.79e-05 | 2.77e-02 | 0.0278 |
| 11170 | FAM107A | Dong_P5 | Human | Prostate | Tumor | 3.90e-04 | -1.84e-01 | 0.053 |
| 11170 | FAM107A | GSM5353236_PA_PR5251_T1_S7_L001 | Human | Prostate | Tumor | 9.19e-08 | 8.30e-01 | 0.1608 |
| 11170 | FAM107A | GSM5353237_PA_PR5251_T2_S8_L001 | Human | Prostate | Tumor | 2.05e-05 | 8.82e-01 | 0.1622 |
| 11170 | FAM107A | GSM5353240_PA_PR5254_T1_S15_L001 | Human | Prostate | Tumor | 2.76e-05 | 4.39e-01 | 0.1575 |
| 11170 | FAM107A | GSM5353243_PA_PR5261_T1_S23_L002 | Human | Prostate | Tumor | 7.02e-12 | 6.45e-01 | 0.1545 |
| 11170 | FAM107A | GSM5353244_PA_PR5261_T2_S24_L002 | Human | Prostate | Tumor | 6.18e-12 | 7.04e-01 | 0.1569 |
| 11170 | FAM107A | male-WTA | Human | Thyroid | PTC | 2.08e-06 | 6.76e-02 | 0.1037 |
| 11170 | FAM107A | PTC05 | Human | Thyroid | PTC | 1.89e-03 | 2.22e-01 | 0.2065 |
| 11170 | FAM107A | PTC06 | Human | Thyroid | PTC | 1.53e-12 | 2.37e-01 | 0.2057 |
| Page: 1 |
| Tissue | Expression Dynamics | Abbreviation |
| Prostate | 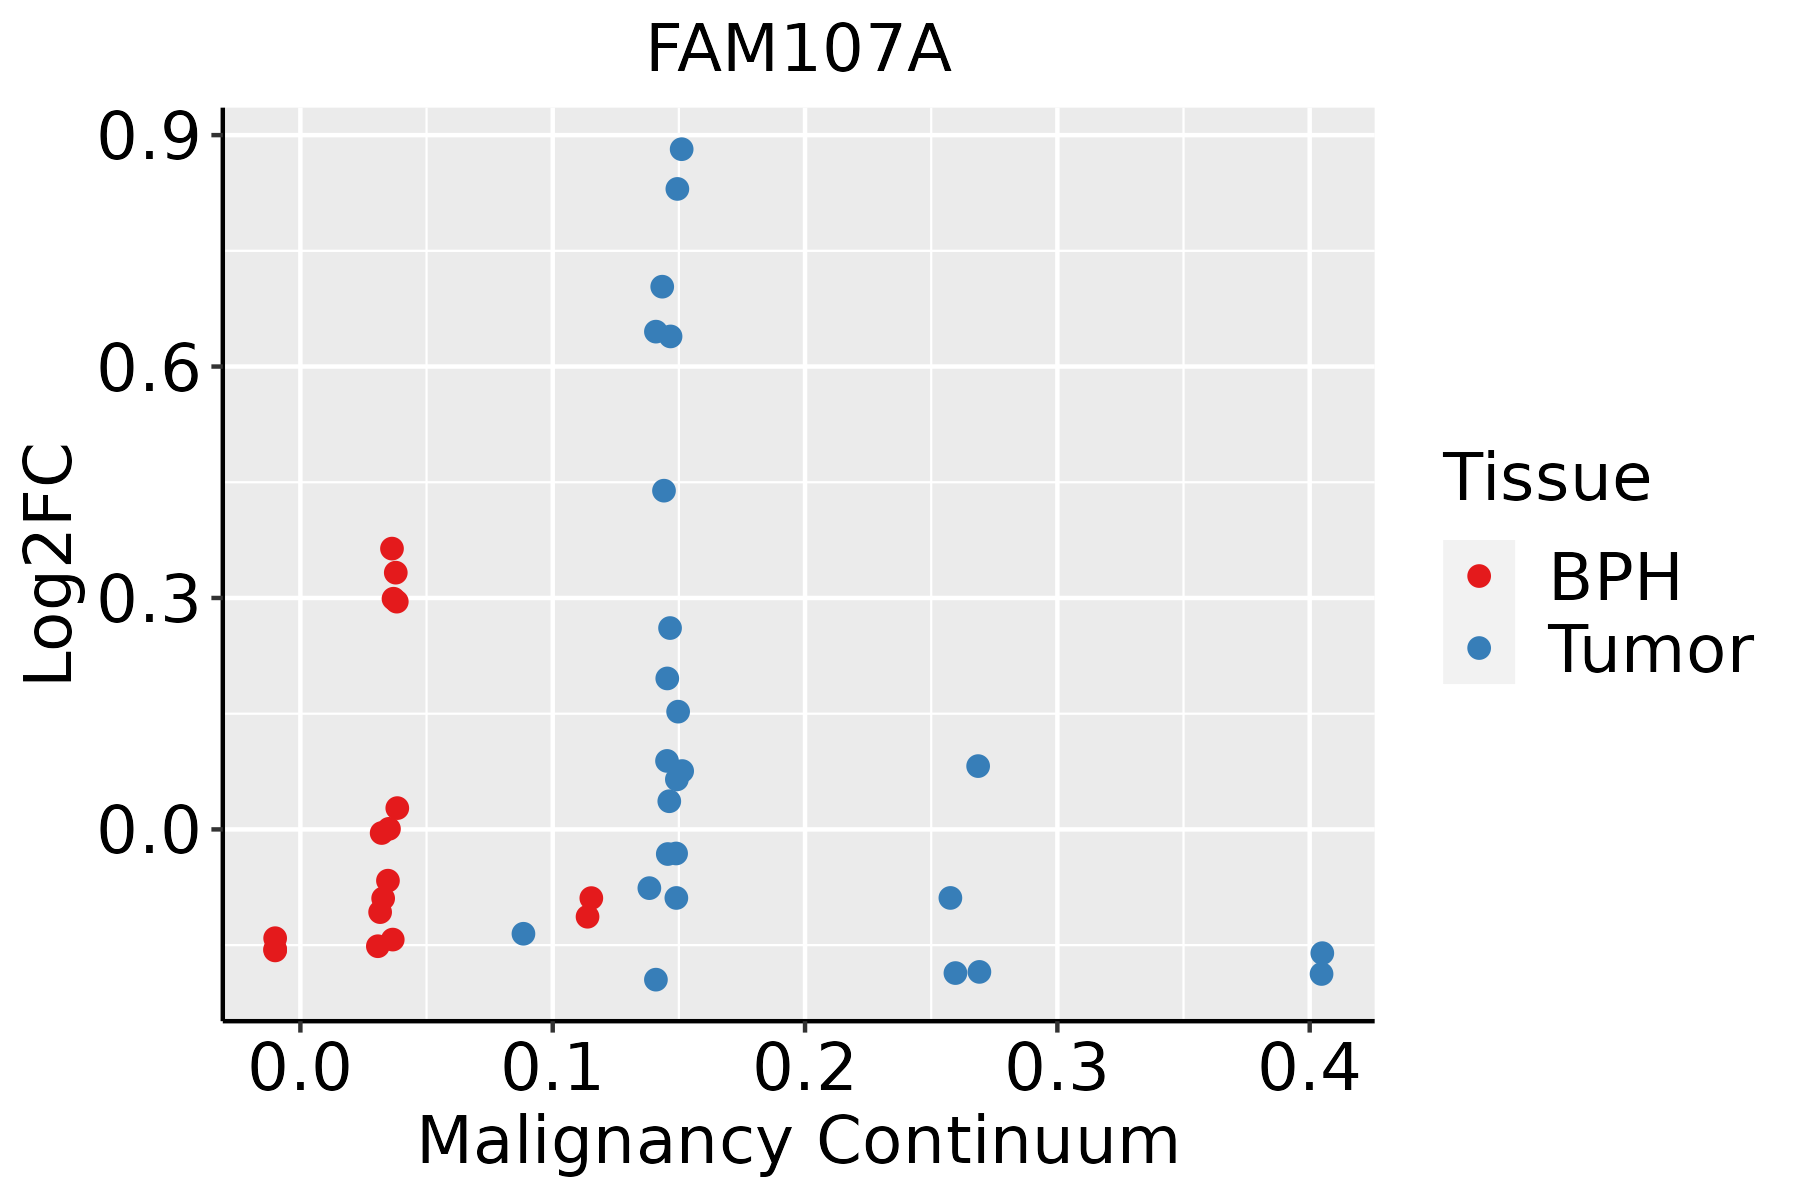 | BPH: Benign Prostatic Hyperplasia |
| Thyroid | 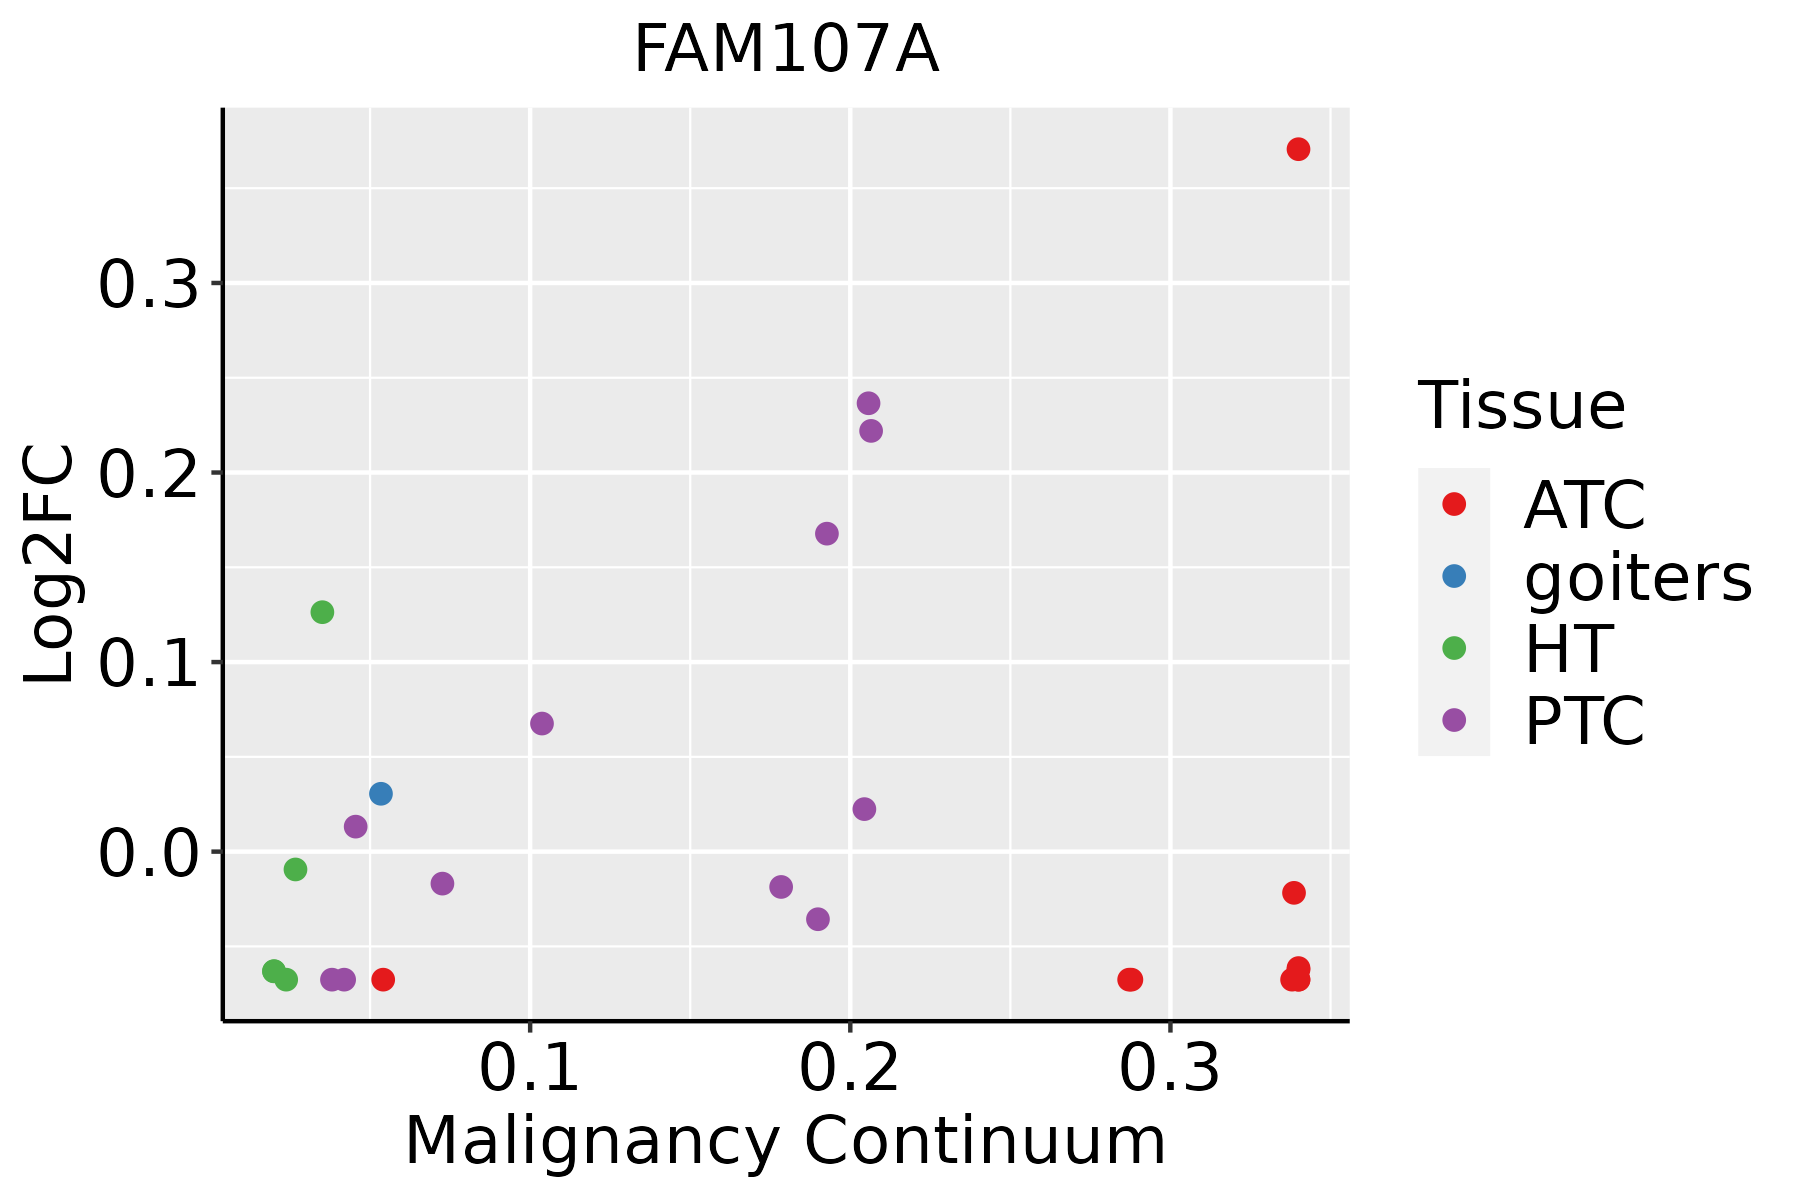 | ATC: Anaplastic thyroid cancer |
| HT: Hashimoto's thyroiditis | ||
| PTC: Papillary thyroid cancer |
| ∗log2FC in expression of this searched gene in stem-like cells from each diseased tissue sample relative to stem-like cells in normal samples in each tissue plotted against the malignancy continuum. Samples are colored based on if they are from different disease stage. |
Top |
Malignant transformation related pathway analysis |
| Find out the enriched GO biological processes and KEGG pathways involved in transition from healthy to precancer to cancer |
| Tissue | Disease Stage | Enriched GO biological Processes |
| Colorectum | AD |  |
| Colorectum | SER |  |
| Colorectum | MSS |  |
| Colorectum | MSI-H |  |
| Colorectum | FAP |  |
| ∗Top 15 enriched GO BP terms are showed in the bar plot of each disease state in each tissue. Each row represents a significant GO biological process which is colored according to the -log10(p.adjust). |
| Page: 1 2 3 4 5 6 7 8 9 |
| GO ID | Tissue | Disease Stage | Description | Gene Ratio | Bg Ratio | pvalue | p.adjust | Count |
| GO:00000825 | Prostate | BPH | G1/S transition of mitotic cell cycle | 62/3107 | 214/18723 | 3.93e-06 | 5.97e-05 | 62 |
| GO:00313985 | Prostate | BPH | positive regulation of protein ubiquitination | 39/3107 | 119/18723 | 1.09e-05 | 1.50e-04 | 39 |
| GO:19028063 | Prostate | BPH | regulation of cell cycle G1/S phase transition | 50/3107 | 168/18723 | 1.47e-05 | 1.89e-04 | 50 |
| GO:20000454 | Prostate | BPH | regulation of G1/S transition of mitotic cell cycle | 44/3107 | 142/18723 | 1.55e-05 | 1.96e-04 | 44 |
| GO:00713847 | Prostate | BPH | cellular response to corticosteroid stimulus | 24/3107 | 61/18723 | 1.86e-05 | 2.29e-04 | 24 |
| GO:19019904 | Prostate | BPH | regulation of mitotic cell cycle phase transition | 77/3107 | 299/18723 | 3.36e-05 | 3.77e-04 | 77 |
| GO:00328862 | Prostate | BPH | regulation of microtubule-based process | 64/3107 | 240/18723 | 4.93e-05 | 5.11e-04 | 64 |
| GO:20001342 | Prostate | BPH | negative regulation of G1/S transition of mitotic cell cycle | 28/3107 | 84/18723 | 1.31e-04 | 1.18e-03 | 28 |
| GO:00457863 | Prostate | BPH | negative regulation of cell cycle | 91/3107 | 385/18723 | 2.10e-04 | 1.71e-03 | 91 |
| GO:00459303 | Prostate | BPH | negative regulation of mitotic cell cycle | 60/3107 | 235/18723 | 3.00e-04 | 2.32e-03 | 60 |
| GO:19019874 | Prostate | BPH | regulation of cell cycle phase transition | 89/3107 | 390/18723 | 8.17e-04 | 5.34e-03 | 89 |
| GO:19028072 | Prostate | BPH | negative regulation of cell cycle G1/S phase transition | 28/3107 | 93/18723 | 8.54e-04 | 5.53e-03 | 28 |
| GO:00108124 | Prostate | BPH | negative regulation of cell-substrate adhesion | 22/3107 | 68/18723 | 1.04e-03 | 6.52e-03 | 22 |
| GO:19019913 | Prostate | BPH | negative regulation of mitotic cell cycle phase transition | 46/3107 | 179/18723 | 1.24e-03 | 7.51e-03 | 46 |
| GO:0050890 | Prostate | BPH | cognition | 69/3107 | 296/18723 | 1.68e-03 | 9.69e-03 | 69 |
| GO:0051895 | Prostate | BPH | negative regulation of focal adhesion assembly | 8/3107 | 18/18723 | 5.17e-03 | 2.43e-02 | 8 |
| GO:0150118 | Prostate | BPH | negative regulation of cell-substrate junction organization | 8/3107 | 18/18723 | 5.17e-03 | 2.43e-02 | 8 |
| GO:003164719 | Prostate | Tumor | regulation of protein stability | 112/3246 | 298/18723 | 4.18e-17 | 1.18e-14 | 112 |
| GO:003297019 | Prostate | Tumor | regulation of actin filament-based process | 133/3246 | 397/18723 | 2.59e-15 | 4.35e-13 | 133 |
| GO:004854519 | Prostate | Tumor | response to steroid hormone | 118/3246 | 339/18723 | 4.46e-15 | 6.94e-13 | 118 |
| Page: 1 2 3 4 5 6 7 8 9 |
| Pathway ID | Tissue | Disease Stage | Description | Gene Ratio | Bg Ratio | pvalue | p.adjust | qvalue | Count |
| Page: 1 |
Top |
Cell-cell communication analysis |
| Identification of potential cell-cell interactions between two cell types and their ligand-receptor pairs for different disease states |
| Ligand | Receptor | LRpair | Pathway | Tissue | Disease Stage |
| Page: 1 |
Top |
Single-cell gene regulatory network inference analysis |
| Find out the significant the regulons (TFs) and the target genes of each regulon across cell types for different disease states |
| TF | Cell Type | Tissue | Disease Stage | Target Gene | RSS | Regulon Activity |
| ∗The dot plots of a searched regulon are shown for all cell subpopulations in each disease state of each tissue based on the regulon specific score inferred using pySCENIC and by calculating the average expression. |
| Page: 1 |
Top |
Somatic mutation of malignant transformation related genes |
| Annotation of somatic variants for genes involved in malignant transformation |
| Hugo Symbol | Variant Class | Variant Classification | dbSNP RS | HGVSc | HGVSp | HGVSp Short | SWISSPROT | BIOTYPE | SIFT | PolyPhen | Tumor Sample Barcode | Tissue | Histology | Sex | Age | Stage | Therapy Types | Drugs | Outcome |
| FAM107A | SNV | Missense_Mutation | c.384N>C | p.Glu128Asp | p.E128D | O95990 | protein_coding | deleterious(0.04) | possibly_damaging(0.769) | TCGA-BH-A18R-01 | Breast | breast invasive carcinoma | Female | <65 | I/II | Unknown | Unknown | SD | |
| FAM107A | SNV | Missense_Mutation | c.408G>C | p.Gln136His | p.Q136H | O95990 | protein_coding | deleterious(0) | probably_damaging(0.999) | TCGA-IR-A3LK-01 | Cervix | cervical & endocervical cancer | Female | >=65 | I/II | Chemotherapy | cisplatin | PD | |
| FAM107A | SNV | Missense_Mutation | rs373429682 | c.91G>A | p.Ala31Thr | p.A31T | O95990 | protein_coding | tolerated(0.06) | benign(0.05) | TCGA-A6-6653-01 | Colorectum | colon adenocarcinoma | Male | >=65 | I/II | Unknown | Unknown | SD |
| FAM107A | SNV | Missense_Mutation | c.119N>A | p.Arg40Gln | p.R40Q | O95990 | protein_coding | tolerated(0.56) | benign(0.031) | TCGA-AA-3710-01 | Colorectum | colon adenocarcinoma | Female | >=65 | I/II | Unknown | Unknown | SD | |
| FAM107A | SNV | Missense_Mutation | rs753821366 | c.487N>T | p.Arg163Trp | p.R163W | O95990 | protein_coding | deleterious(0) | probably_damaging(1) | TCGA-AA-3984-01 | Colorectum | colon adenocarcinoma | Female | <65 | I/II | Unknown | Unknown | SD |
| FAM107A | SNV | Missense_Mutation | novel | c.191N>G | p.Lys64Arg | p.K64R | O95990 | protein_coding | deleterious(0.03) | probably_damaging(0.999) | TCGA-A5-A1OF-01 | Endometrium | uterine corpus endometrioid carcinoma | Female | <65 | I/II | Unknown | Unknown | SD |
| FAM107A | SNV | Missense_Mutation | novel | c.184C>T | p.Pro62Ser | p.P62S | O95990 | protein_coding | deleterious(0) | probably_damaging(1) | TCGA-AP-A1DK-01 | Endometrium | uterine corpus endometrioid carcinoma | Female | <65 | I/II | Unknown | Unknown | SD |
| FAM107A | SNV | Missense_Mutation | c.172N>A | p.Glu58Lys | p.E58K | O95990 | protein_coding | deleterious(0.01) | possibly_damaging(0.64) | TCGA-BS-A0UF-01 | Endometrium | uterine corpus endometrioid carcinoma | Female | >=65 | I/II | Unknown | Unknown | SD | |
| FAM107A | SNV | Missense_Mutation | rs755089230 | c.400N>T | p.Arg134Trp | p.R134W | O95990 | protein_coding | deleterious(0.01) | probably_damaging(1) | TCGA-D1-A167-01 | Endometrium | uterine corpus endometrioid carcinoma | Female | >=65 | I/II | Unknown | Unknown | SD |
| FAM107A | SNV | Missense_Mutation | c.141G>T | p.Met47Ile | p.M47I | O95990 | protein_coding | deleterious(0.05) | benign(0.281) | TCGA-D1-A17M-01 | Endometrium | uterine corpus endometrioid carcinoma | Female | <65 | I/II | Unknown | Unknown | SD |
| Page: 1 2 |
Top |
Related drugs of malignant transformation related genes |
| Identification of chemicals and drugs interact with genes involved in malignant transfromation |
| (DGIdb 4.0) |
| Entrez ID | Symbol | Category | Interaction Types | Drug Claim Name | Drug Name | PMIDs |
| Page: 1 |

Copyright 2023-Present -The University of Texas Health Science Center at Houston |