| Tissue | Expression Dynamics | Abbreviation |
| Esophagus |  | ESCC: Esophageal squamous cell carcinoma |
| HGIN: High-grade intraepithelial neoplasias |
| LGIN: Low-grade intraepithelial neoplasias |
| Liver | 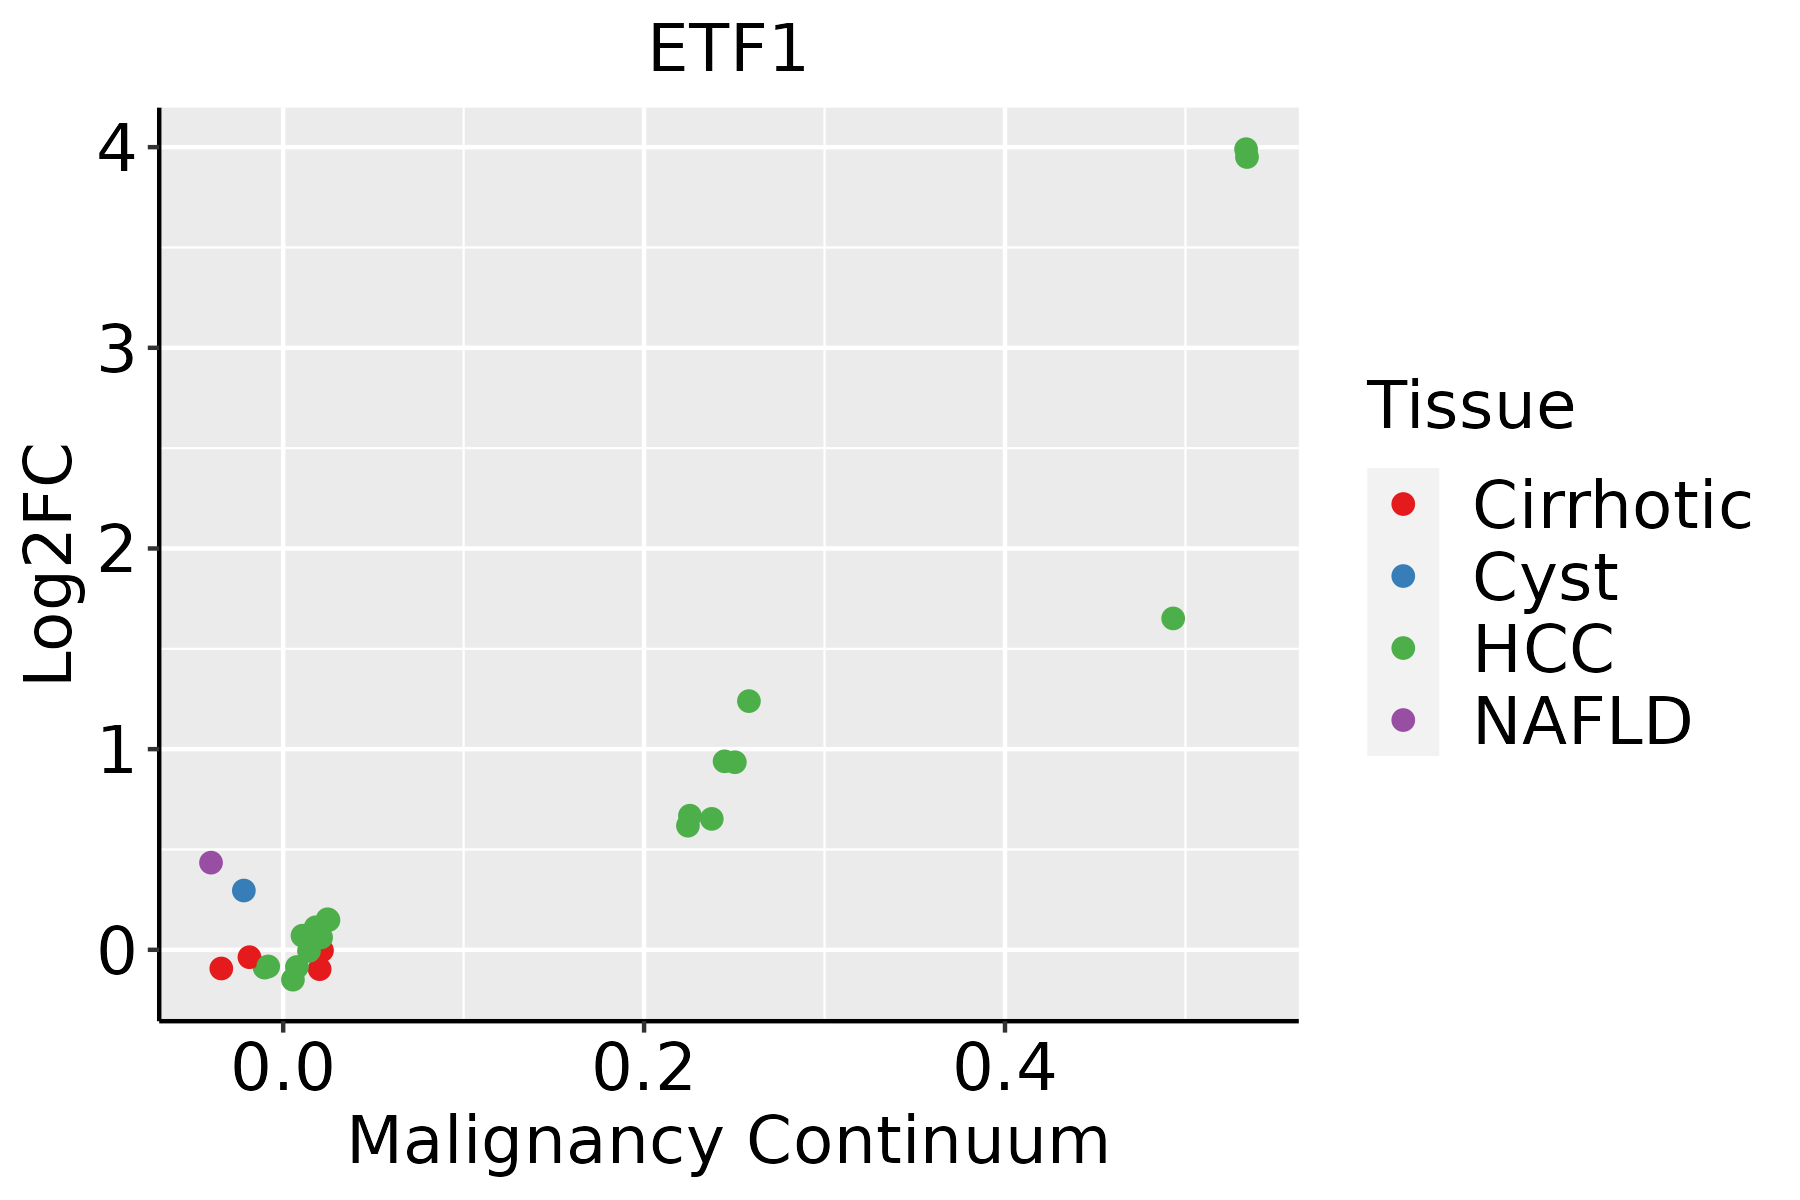 | HCC: Hepatocellular carcinoma |
| NAFLD: Non-alcoholic fatty liver disease |
| Oral Cavity |  | EOLP: Erosive Oral lichen planus |
| LP: leukoplakia |
| NEOLP: Non-erosive oral lichen planus |
| OSCC: Oral squamous cell carcinoma |
| Prostate |  | BPH: Benign Prostatic Hyperplasia |
| Skin | 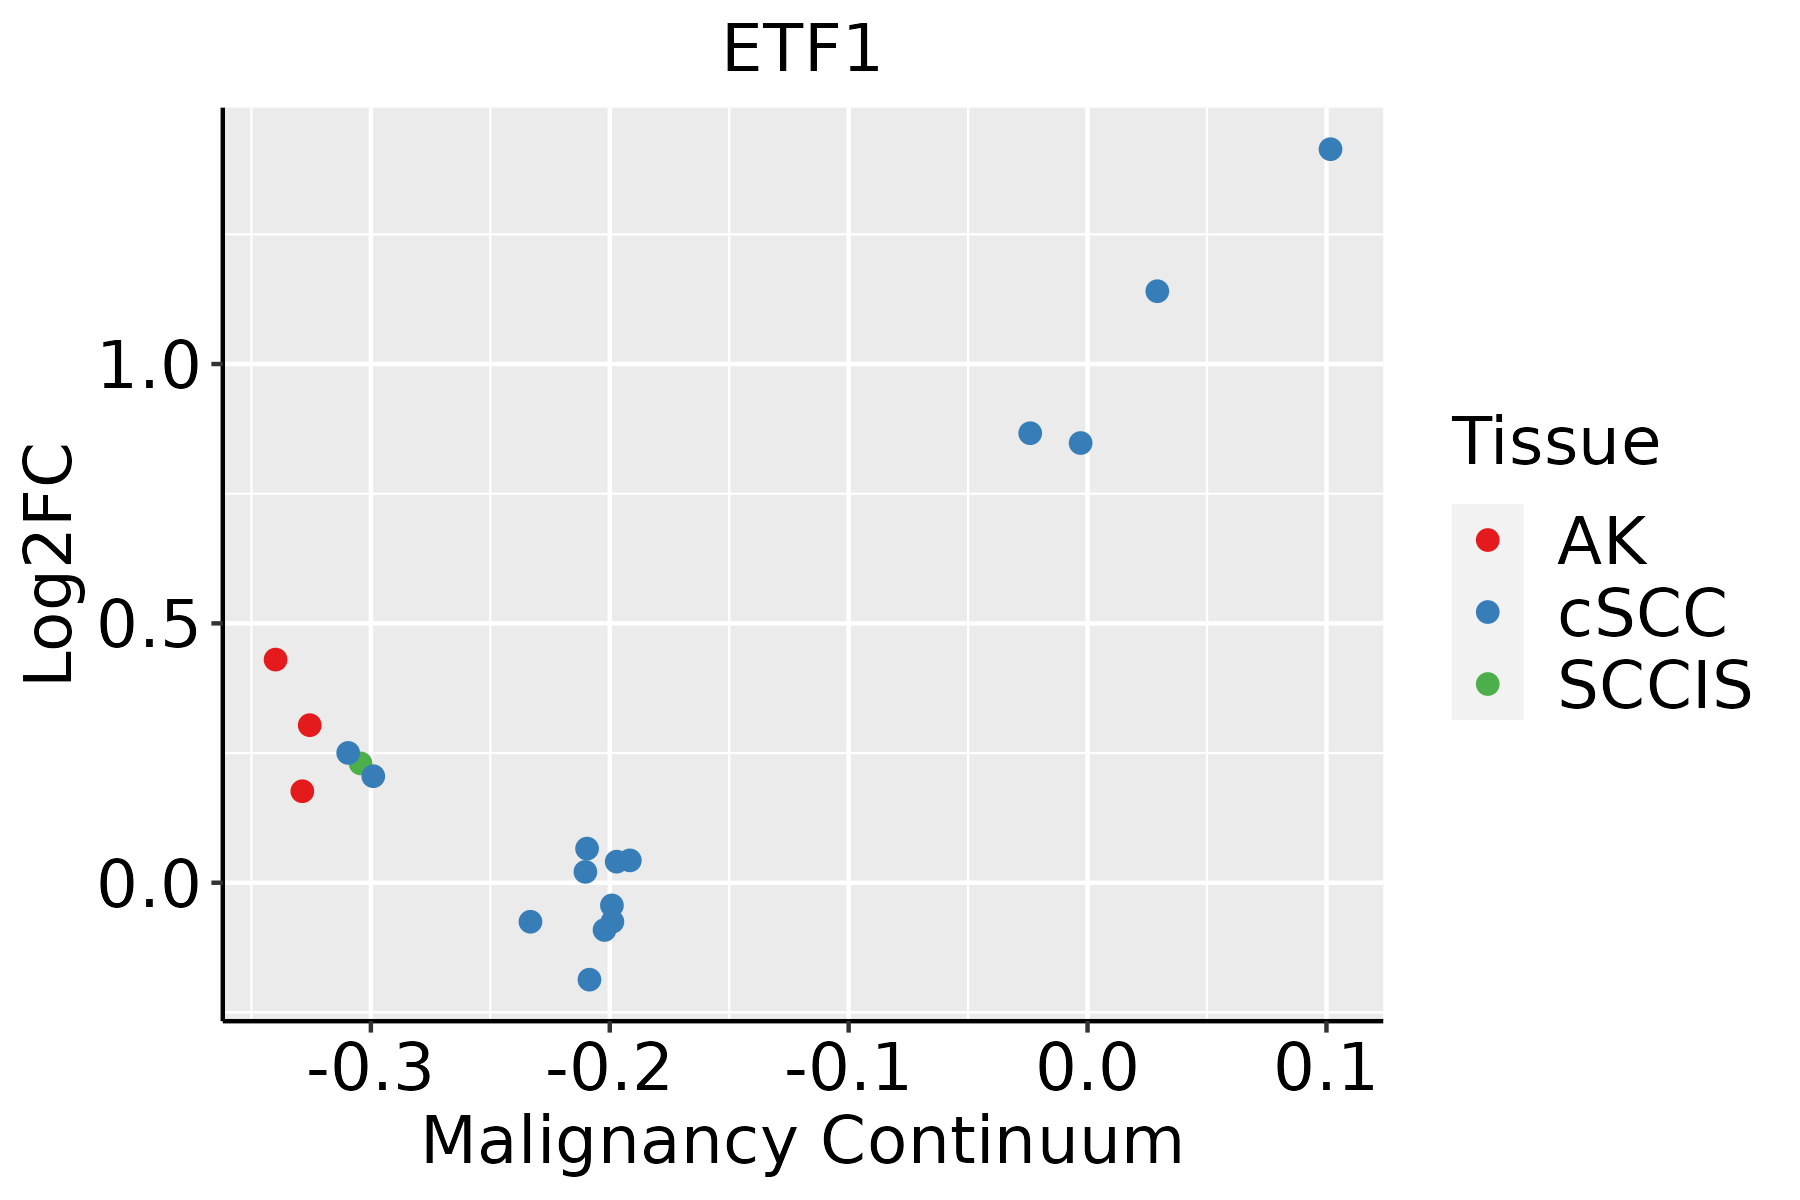 | AK: Actinic keratosis |
| cSCC: Cutaneous squamous cell carcinoma |
| SCCIS:squamous cell carcinoma in situ |
| Thyroid |  | ATC: Anaplastic thyroid cancer |
| HT: Hashimoto's thyroiditis |
| PTC: Papillary thyroid cancer |
| GO ID | Tissue | Disease Stage | Description | Gene Ratio | Bg Ratio | pvalue | p.adjust | Count |
| GO:003465511 | Liver | Cirrhotic | nucleobase-containing compound catabolic process | 171/4634 | 407/18723 | 9.07e-15 | 9.33e-13 | 171 |
| GO:00224117 | Liver | Cirrhotic | cellular component disassembly | 182/4634 | 443/18723 | 1.59e-14 | 1.54e-12 | 182 |
| GO:000640111 | Liver | Cirrhotic | RNA catabolic process | 126/4634 | 278/18723 | 4.64e-14 | 4.10e-12 | 126 |
| GO:000640211 | Liver | Cirrhotic | mRNA catabolic process | 109/4634 | 232/18723 | 1.30e-13 | 1.09e-11 | 109 |
| GO:000095611 | Liver | Cirrhotic | nuclear-transcribed mRNA catabolic process | 58/4634 | 112/18723 | 6.55e-10 | 3.06e-08 | 58 |
| GO:00329846 | Liver | Cirrhotic | protein-containing complex disassembly | 82/4634 | 224/18723 | 4.78e-05 | 5.54e-04 | 82 |
| GO:00001843 | Liver | Cirrhotic | nuclear-transcribed mRNA catabolic process, nonsense-mediated decay | 20/4634 | 37/18723 | 1.25e-04 | 1.23e-03 | 20 |
| GO:00064791 | Liver | Cirrhotic | protein methylation | 61/4634 | 181/18723 | 4.13e-03 | 2.21e-02 | 61 |
| GO:00082131 | Liver | Cirrhotic | protein alkylation | 61/4634 | 181/18723 | 4.13e-03 | 2.21e-02 | 61 |
| GO:000218122 | Liver | HCC | cytoplasmic translation | 132/7958 | 148/18723 | 9.09e-33 | 5.76e-30 | 132 |
| GO:004427021 | Liver | HCC | cellular nitrogen compound catabolic process | 303/7958 | 451/18723 | 9.76e-27 | 3.64e-24 | 303 |
| GO:004670021 | Liver | HCC | heterocycle catabolic process | 299/7958 | 445/18723 | 2.07e-26 | 7.29e-24 | 299 |
| GO:190136121 | Liver | HCC | organic cyclic compound catabolic process | 325/7958 | 495/18723 | 6.52e-26 | 2.18e-23 | 325 |
| GO:001943921 | Liver | HCC | aromatic compound catabolic process | 309/7958 | 467/18723 | 1.56e-25 | 4.94e-23 | 309 |
| GO:000640121 | Liver | HCC | RNA catabolic process | 201/7958 | 278/18723 | 3.88e-24 | 1.02e-21 | 201 |
| GO:003465521 | Liver | HCC | nucleobase-containing compound catabolic process | 273/7958 | 407/18723 | 4.84e-24 | 1.23e-21 | 273 |
| GO:000640221 | Liver | HCC | mRNA catabolic process | 169/7958 | 232/18723 | 4.50e-21 | 6.96e-19 | 169 |
| GO:002241112 | Liver | HCC | cellular component disassembly | 282/7958 | 443/18723 | 1.02e-19 | 1.38e-17 | 282 |
| GO:000641722 | Liver | HCC | regulation of translation | 287/7958 | 468/18723 | 8.79e-17 | 8.08e-15 | 287 |
| GO:000095621 | Liver | HCC | nuclear-transcribed mRNA catabolic process | 84/7958 | 112/18723 | 2.54e-12 | 1.18e-10 | 84 |
| Pathway ID | Tissue | Disease Stage | Description | Gene Ratio | Bg Ratio | pvalue | p.adjust | qvalue | Count |
| hsa030159 | Esophagus | HGIN | mRNA surveillance pathway | 30/1383 | 97/8465 | 2.48e-04 | 2.69e-03 | 2.14e-03 | 30 |
| hsa0301514 | Esophagus | HGIN | mRNA surveillance pathway | 30/1383 | 97/8465 | 2.48e-04 | 2.69e-03 | 2.14e-03 | 30 |
| hsa0301524 | Esophagus | ESCC | mRNA surveillance pathway | 72/4205 | 97/8465 | 6.12e-07 | 4.10e-06 | 2.10e-06 | 72 |
| hsa0301534 | Esophagus | ESCC | mRNA surveillance pathway | 72/4205 | 97/8465 | 6.12e-07 | 4.10e-06 | 2.10e-06 | 72 |
| hsa030154 | Liver | Cirrhotic | mRNA surveillance pathway | 46/2530 | 97/8465 | 1.92e-04 | 1.30e-03 | 8.03e-04 | 46 |
| hsa0301511 | Liver | Cirrhotic | mRNA surveillance pathway | 46/2530 | 97/8465 | 1.92e-04 | 1.30e-03 | 8.03e-04 | 46 |
| hsa0301521 | Liver | HCC | mRNA surveillance pathway | 66/4020 | 97/8465 | 3.16e-05 | 1.88e-04 | 1.04e-04 | 66 |
| hsa0301531 | Liver | HCC | mRNA surveillance pathway | 66/4020 | 97/8465 | 3.16e-05 | 1.88e-04 | 1.04e-04 | 66 |
| hsa030158 | Oral cavity | OSCC | mRNA surveillance pathway | 75/3704 | 97/8465 | 1.30e-11 | 2.01e-10 | 1.02e-10 | 75 |
| hsa0301513 | Oral cavity | OSCC | mRNA surveillance pathway | 75/3704 | 97/8465 | 1.30e-11 | 2.01e-10 | 1.02e-10 | 75 |
| hsa0301523 | Oral cavity | LP | mRNA surveillance pathway | 50/2418 | 97/8465 | 1.39e-06 | 1.50e-05 | 9.66e-06 | 50 |
| hsa0301533 | Oral cavity | LP | mRNA surveillance pathway | 50/2418 | 97/8465 | 1.39e-06 | 1.50e-05 | 9.66e-06 | 50 |
| hsa0301541 | Oral cavity | EOLP | mRNA surveillance pathway | 30/1218 | 97/8465 | 2.26e-05 | 1.20e-04 | 7.07e-05 | 30 |
| hsa0301551 | Oral cavity | EOLP | mRNA surveillance pathway | 30/1218 | 97/8465 | 2.26e-05 | 1.20e-04 | 7.07e-05 | 30 |
| hsa030156 | Oral cavity | NEOLP | mRNA surveillance pathway | 25/1112 | 97/8465 | 5.70e-04 | 3.18e-03 | 2.00e-03 | 25 |
| hsa030157 | Oral cavity | NEOLP | mRNA surveillance pathway | 25/1112 | 97/8465 | 5.70e-04 | 3.18e-03 | 2.00e-03 | 25 |
| hsa030155 | Prostate | BPH | mRNA surveillance pathway | 32/1718 | 97/8465 | 2.20e-03 | 8.63e-03 | 5.34e-03 | 32 |
| hsa0301512 | Prostate | BPH | mRNA surveillance pathway | 32/1718 | 97/8465 | 2.20e-03 | 8.63e-03 | 5.34e-03 | 32 |
| hsa0301522 | Prostate | Tumor | mRNA surveillance pathway | 33/1791 | 97/8465 | 2.18e-03 | 8.60e-03 | 5.33e-03 | 33 |
| hsa0301532 | Prostate | Tumor | mRNA surveillance pathway | 33/1791 | 97/8465 | 2.18e-03 | 8.60e-03 | 5.33e-03 | 33 |
| Hugo Symbol | Variant Class | Variant Classification | dbSNP RS | HGVSc | HGVSp | HGVSp Short | SWISSPROT | BIOTYPE | SIFT | PolyPhen | Tumor Sample Barcode | Tissue | Histology | Sex | Age | Stage | Therapy Types | Drugs | Outcome |
| ETF1 | SNV | Missense_Mutation | | c.118N>T | p.Pro40Ser | p.P40S | P62495 | protein_coding | tolerated(0.06) | possibly_damaging(0.845) | TCGA-AC-A23H-01 | Breast | breast invasive carcinoma | Female | >=65 | I/II | Unknown | Unknown | PD |
| ETF1 | SNV | Missense_Mutation | | c.1081G>C | p.Glu361Gln | p.E361Q | P62495 | protein_coding | tolerated(0.1) | benign(0.269) | TCGA-AN-A0XW-01 | Breast | breast invasive carcinoma | Female | <65 | III/IV | Unknown | Unknown | SD |
| ETF1 | SNV | Missense_Mutation | novel | c.444N>A | p.Phe148Leu | p.F148L | P62495 | protein_coding | deleterious(0.02) | probably_damaging(0.989) | TCGA-E2-A14O-01 | Breast | breast invasive carcinoma | Female | >=65 | III/IV | Hormone Therapy | arimidex | SD |
| ETF1 | insertion | Nonsense_Mutation | novel | c.495_496insGCCCGGCCCTGTCTCTACTAAAAATACAAAAATGTGACGGGCGCC | p.Thr165_Arg166insAlaArgProCysLeuTyrTerLysTyrLysAsnValThrGlyAla | p.T165_R166insARPCLY*KYKNVTGA | P62495 | protein_coding | | | TCGA-AR-A0TY-01 | Breast | breast invasive carcinoma | Female | <65 | I/II | Unspecific | Paclitaxel | PD |
| ETF1 | SNV | Missense_Mutation | | c.997C>T | p.Leu333Phe | p.L333F | P62495 | protein_coding | tolerated(0.08) | benign(0.045) | TCGA-C5-A2LX-01 | Cervix | cervical & endocervical cancer | Female | <65 | I/II | Chemotherapy | cisplatin | SD |
| ETF1 | SNV | Missense_Mutation | | c.812N>G | p.Ser271Cys | p.S271C | P62495 | protein_coding | tolerated(0.06) | benign(0.366) | TCGA-EK-A2PM-01 | Cervix | cervical & endocervical cancer | Female | >=65 | I/II | Unknown | Unknown | SD |
| ETF1 | SNV | Missense_Mutation | | c.1051N>A | p.Glu351Lys | p.E351K | P62495 | protein_coding | tolerated(0.06) | benign(0.084) | TCGA-JW-A5VJ-01 | Cervix | cervical & endocervical cancer | Female | <65 | I/II | Unknown | Unknown | PD |
| ETF1 | SNV | Missense_Mutation | novel | c.1168G>C | p.Glu390Gln | p.E390Q | P62495 | protein_coding | tolerated(0.07) | benign(0.123) | TCGA-VS-A953-01 | Cervix | cervical & endocervical cancer | Female | <65 | I/II | Unknown | Unknown | PD |
| ETF1 | SNV | Missense_Mutation | | c.913N>A | p.Val305Ile | p.V305I | P62495 | protein_coding | tolerated(0.44) | benign(0.007) | TCGA-A6-5665-01 | Colorectum | colon adenocarcinoma | Female | >=65 | I/II | Unknown | Unknown | PD |
| ETF1 | SNV | Missense_Mutation | | c.365N>T | p.Thr122Met | p.T122M | P62495 | protein_coding | deleterious(0) | possibly_damaging(0.904) | TCGA-AA-3510-01 | Colorectum | colon adenocarcinoma | Male | >=65 | I/II | Unknown | Unknown | SD |


