| Tissue | Expression Dynamics | Abbreviation |
| Cervix | 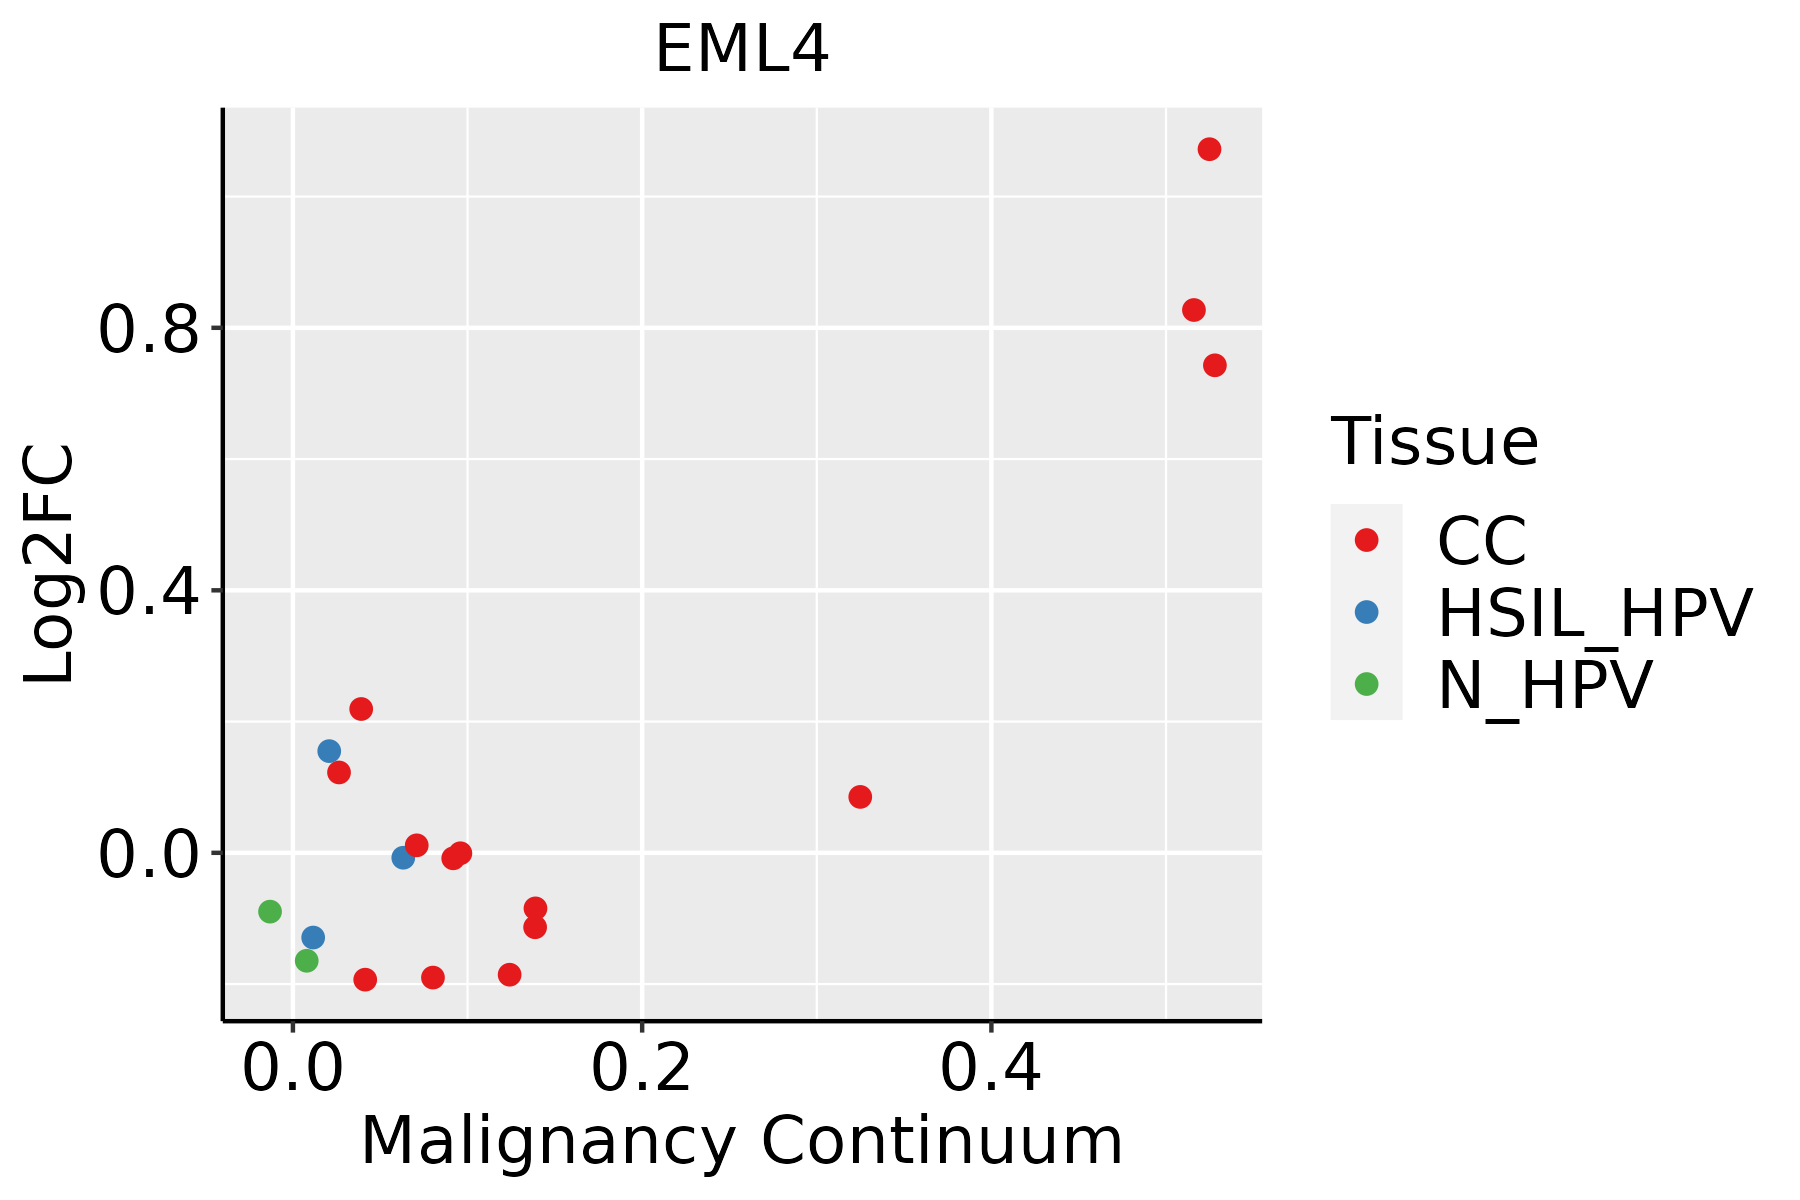 | CC: Cervix cancer |
| HSIL_HPV: HPV-infected high-grade squamous intraepithelial lesions |
| N_HPV: HPV-infected normal cervix |
| Colorectum (GSE201348) |  | FAP: Familial adenomatous polyposis |
| CRC: Colorectal cancer |
| Colorectum (HTA11) |  | AD: Adenomas |
| SER: Sessile serrated lesions |
| MSI-H: Microsatellite-high colorectal cancer |
| MSS: Microsatellite stable colorectal cancer |
| Endometrium | 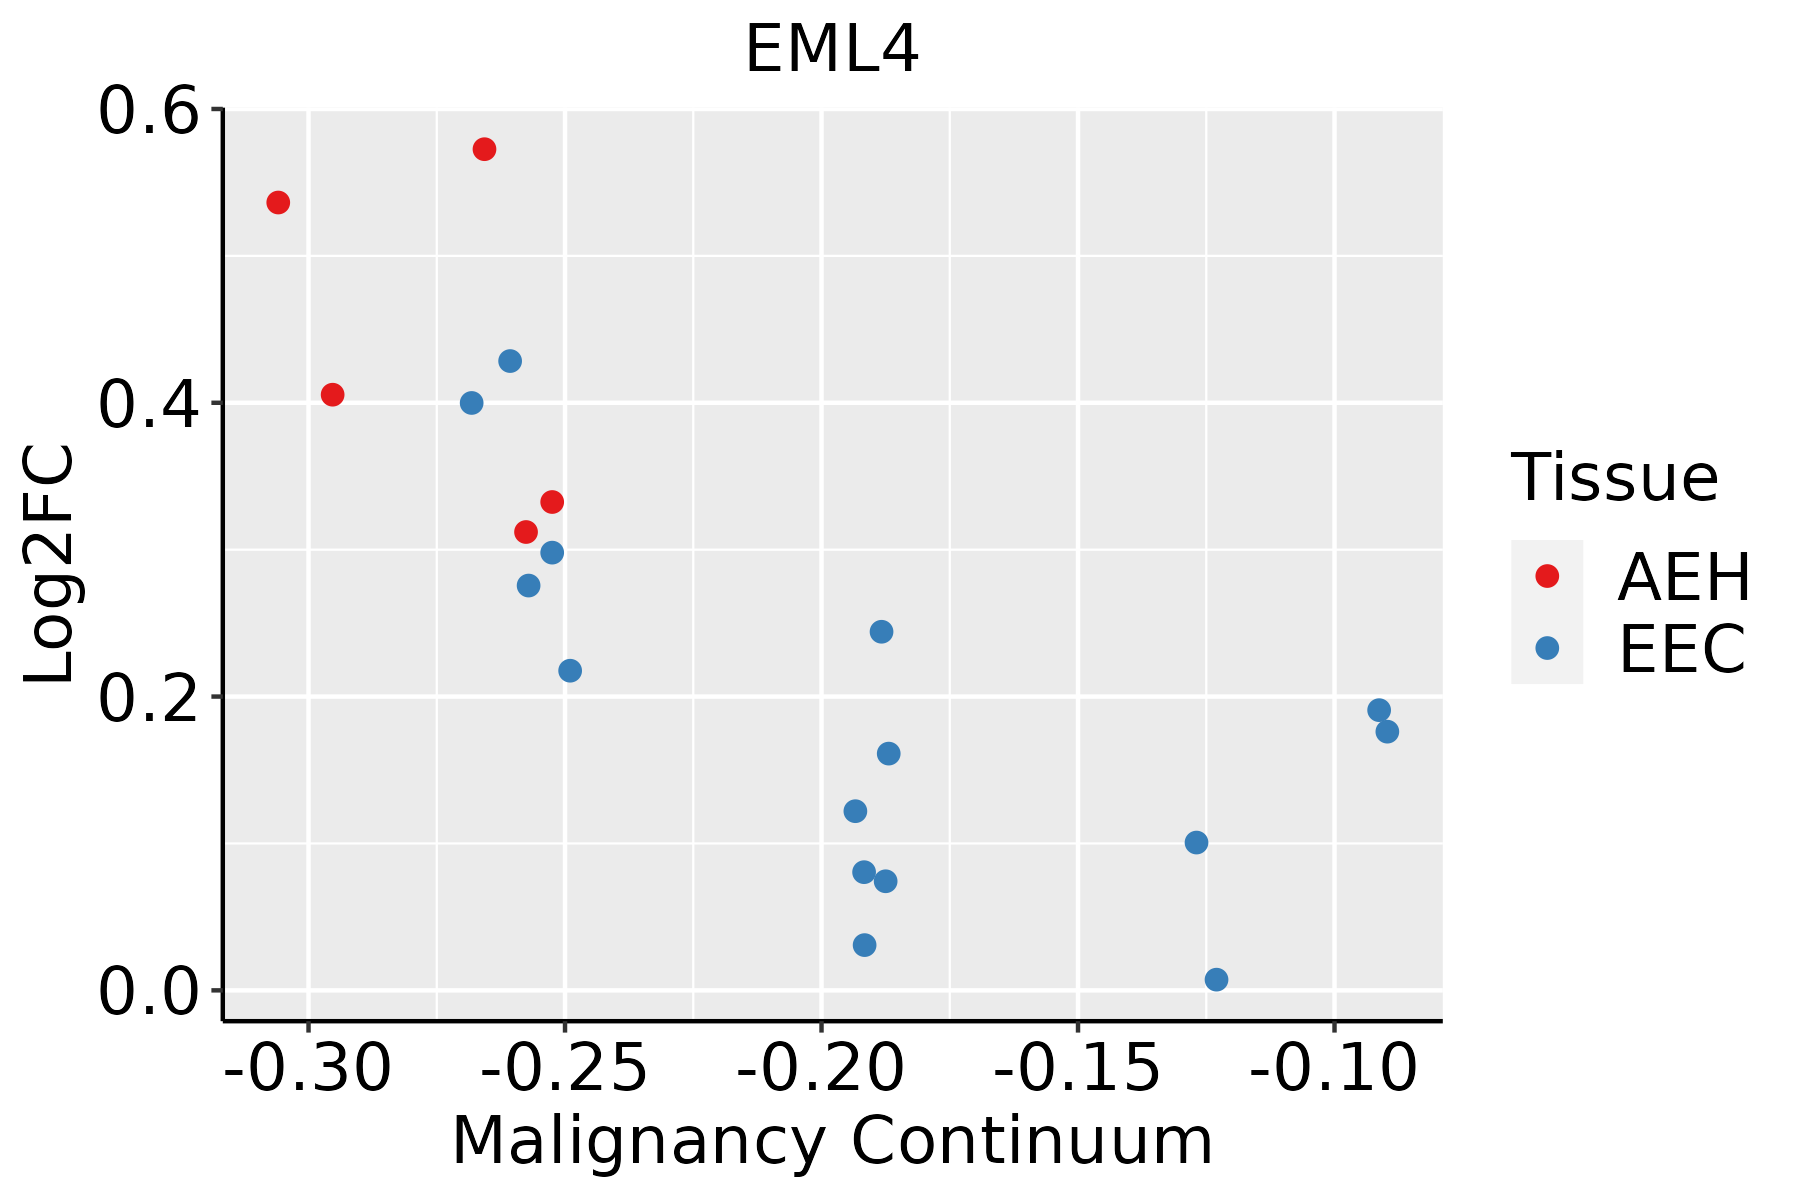 | AEH: Atypical endometrial hyperplasia |
| EEC: Endometrioid Cancer |
| Esophagus | 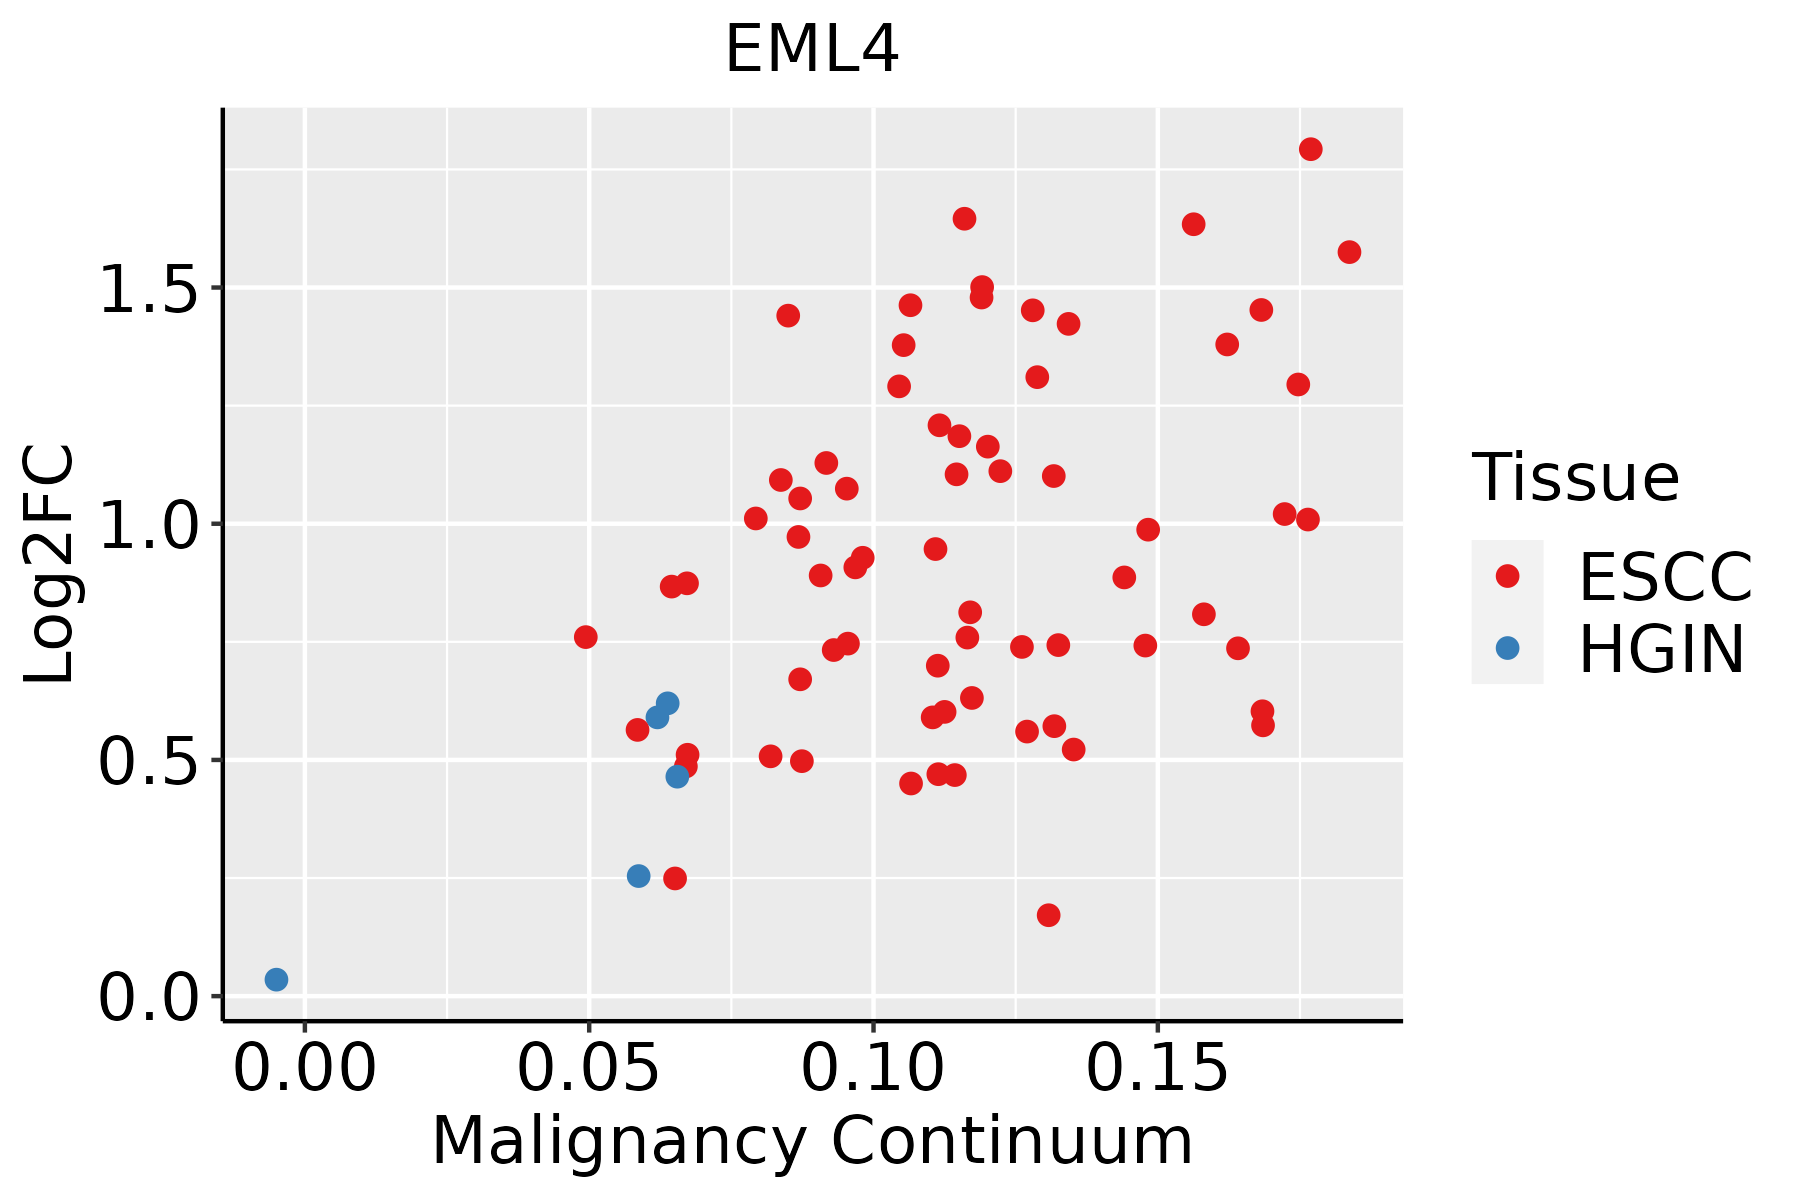 | ESCC: Esophageal squamous cell carcinoma |
| HGIN: High-grade intraepithelial neoplasias |
| LGIN: Low-grade intraepithelial neoplasias |
| Liver | 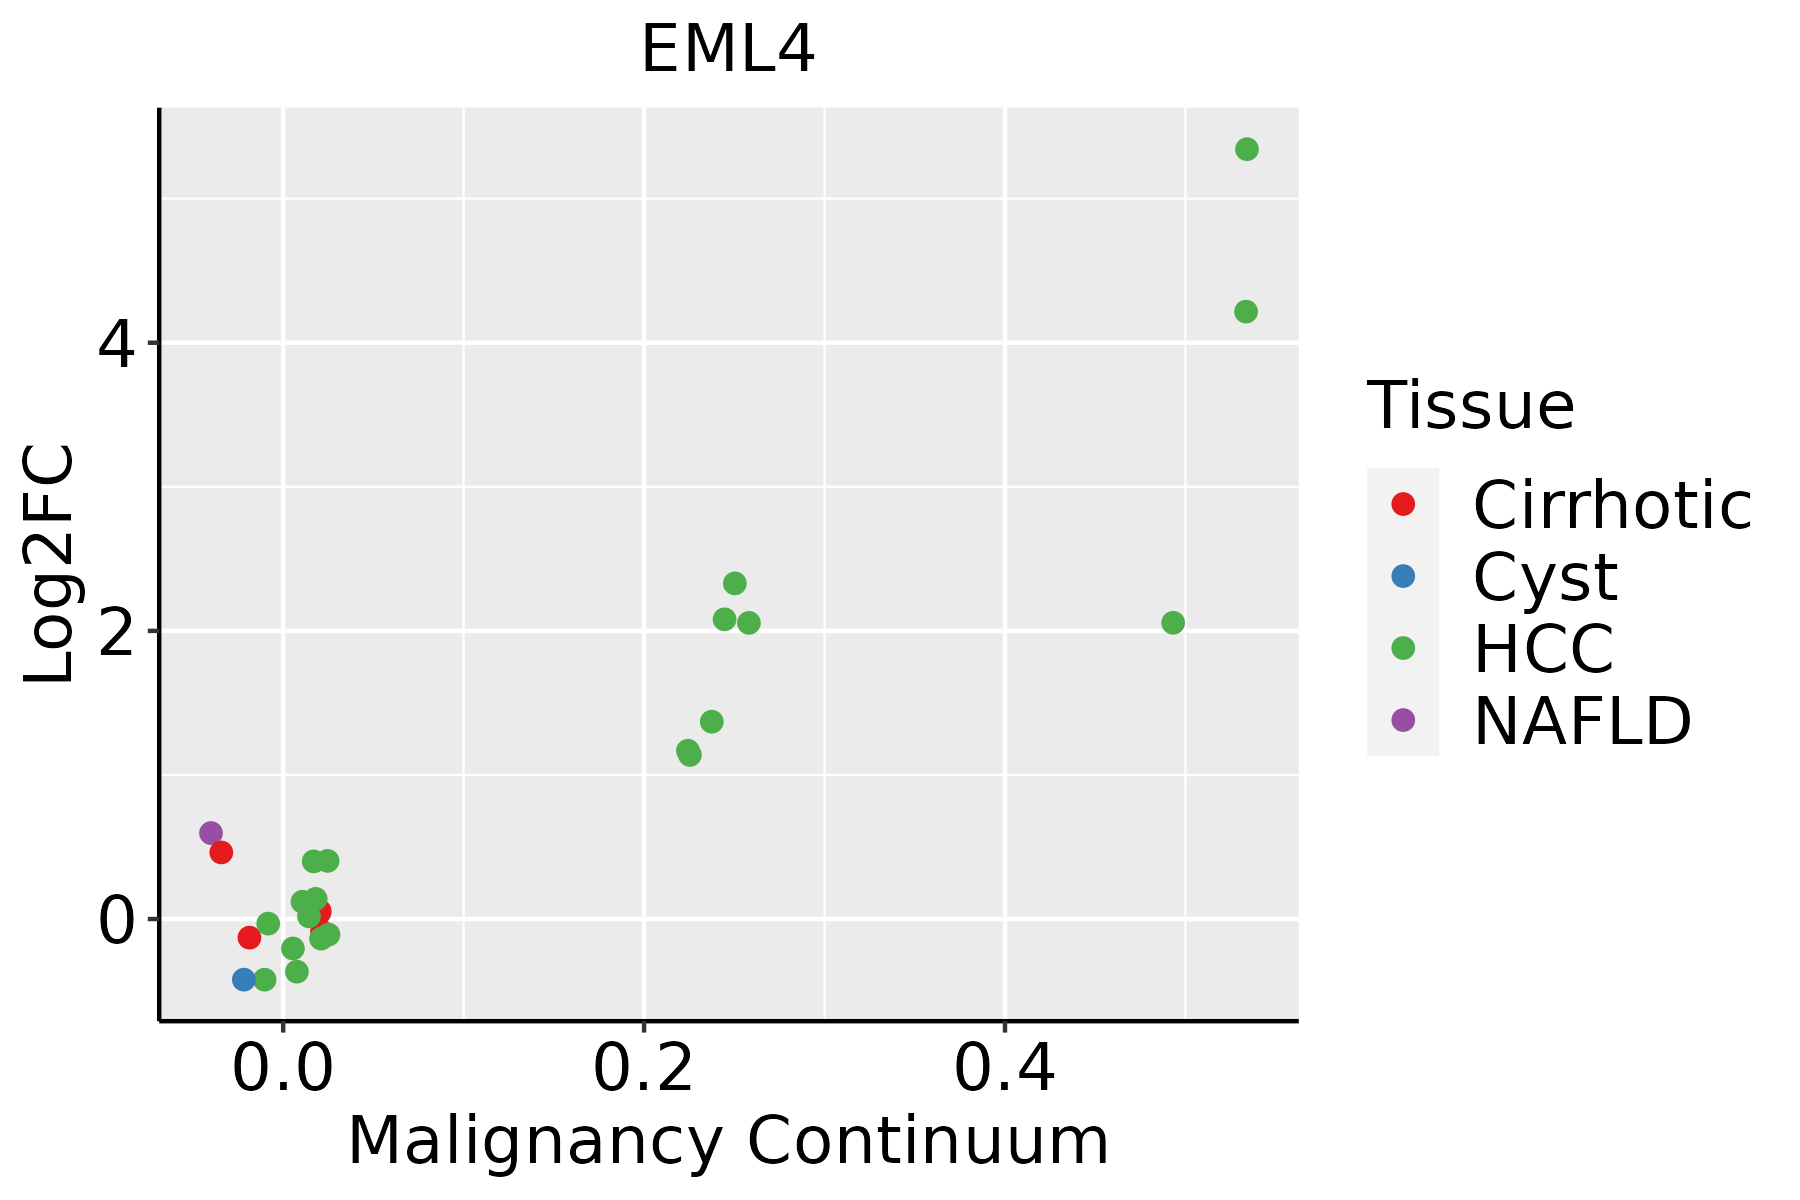 | HCC: Hepatocellular carcinoma |
| NAFLD: Non-alcoholic fatty liver disease |
| Lung |  | AAH: Atypical adenomatous hyperplasia |
| AIS: Adenocarcinoma in situ |
| IAC: Invasive lung adenocarcinoma |
| MIA: Minimally invasive adenocarcinoma |
| Oral Cavity | 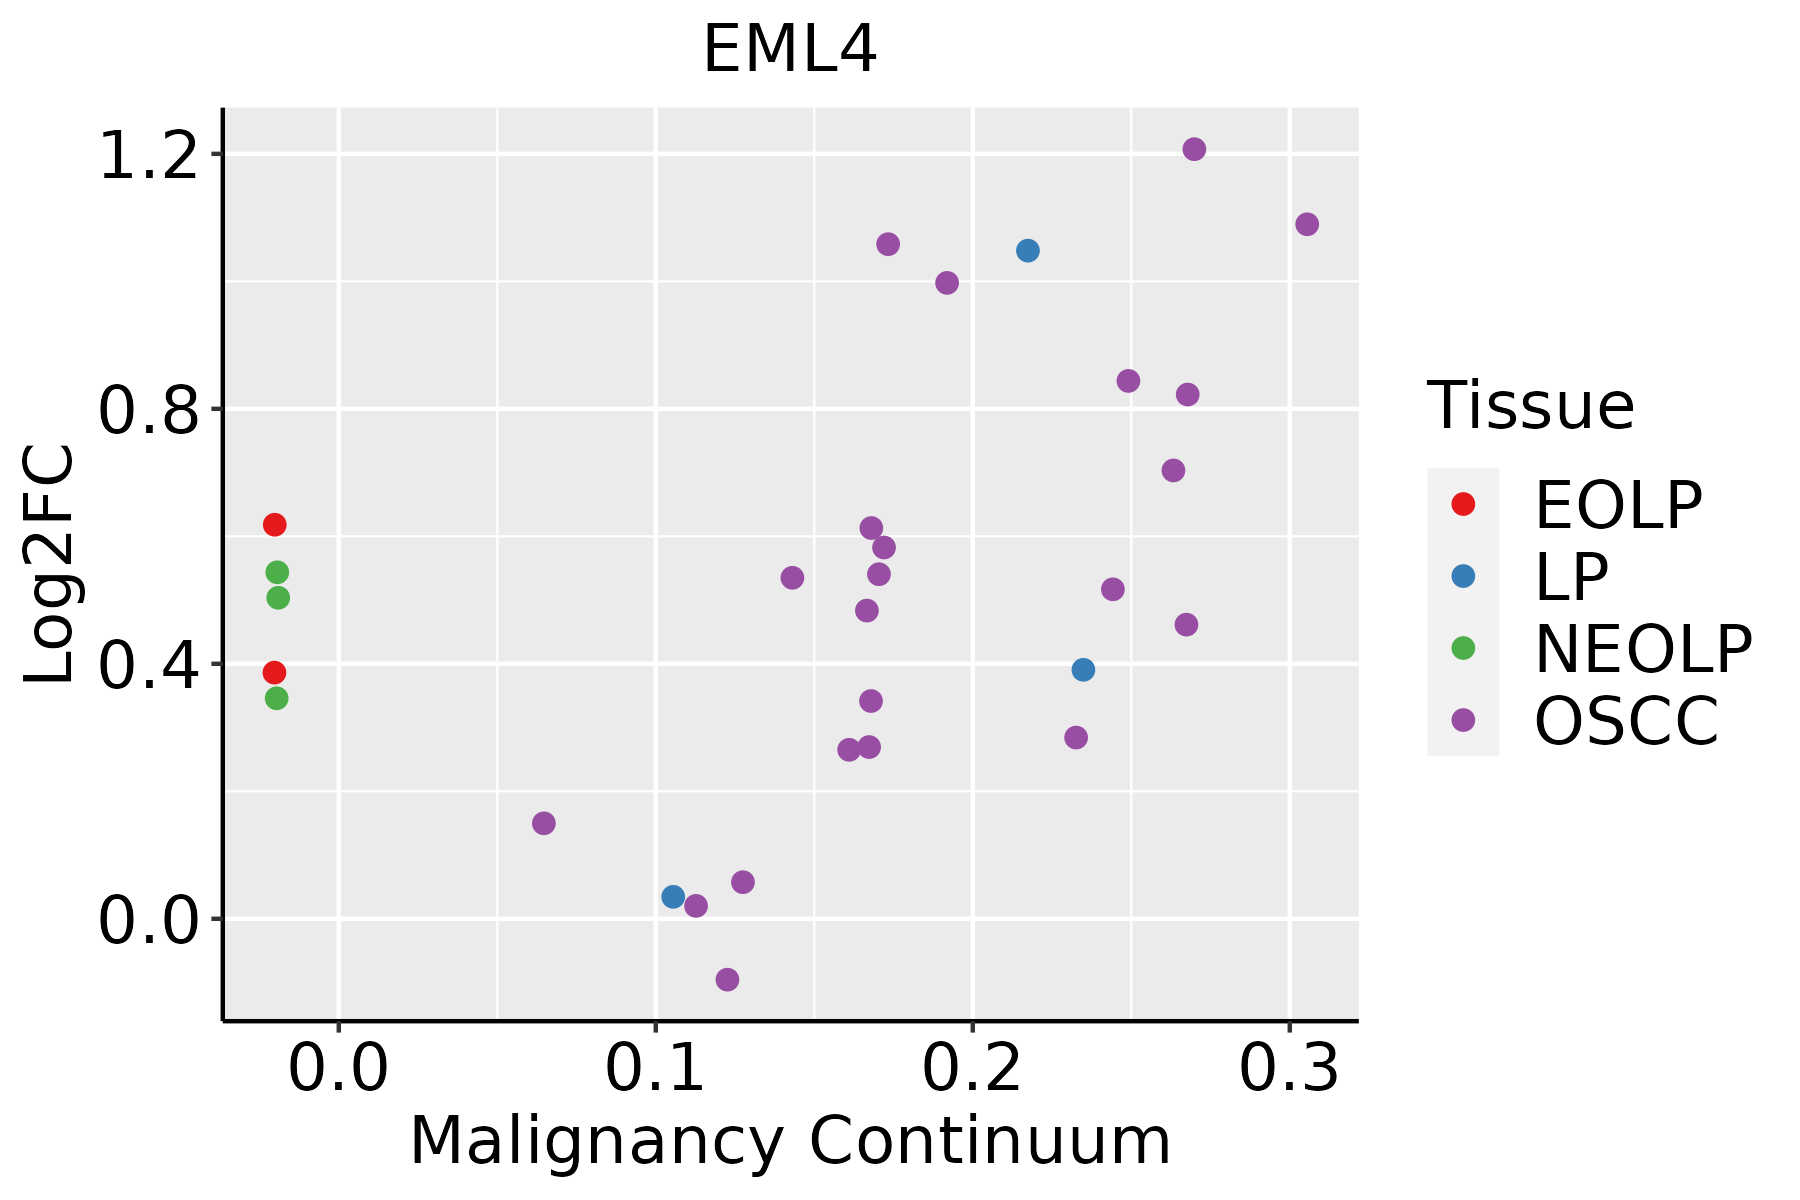 | EOLP: Erosive Oral lichen planus |
| LP: leukoplakia |
| NEOLP: Non-erosive oral lichen planus |
| OSCC: Oral squamous cell carcinoma |
| Prostate | 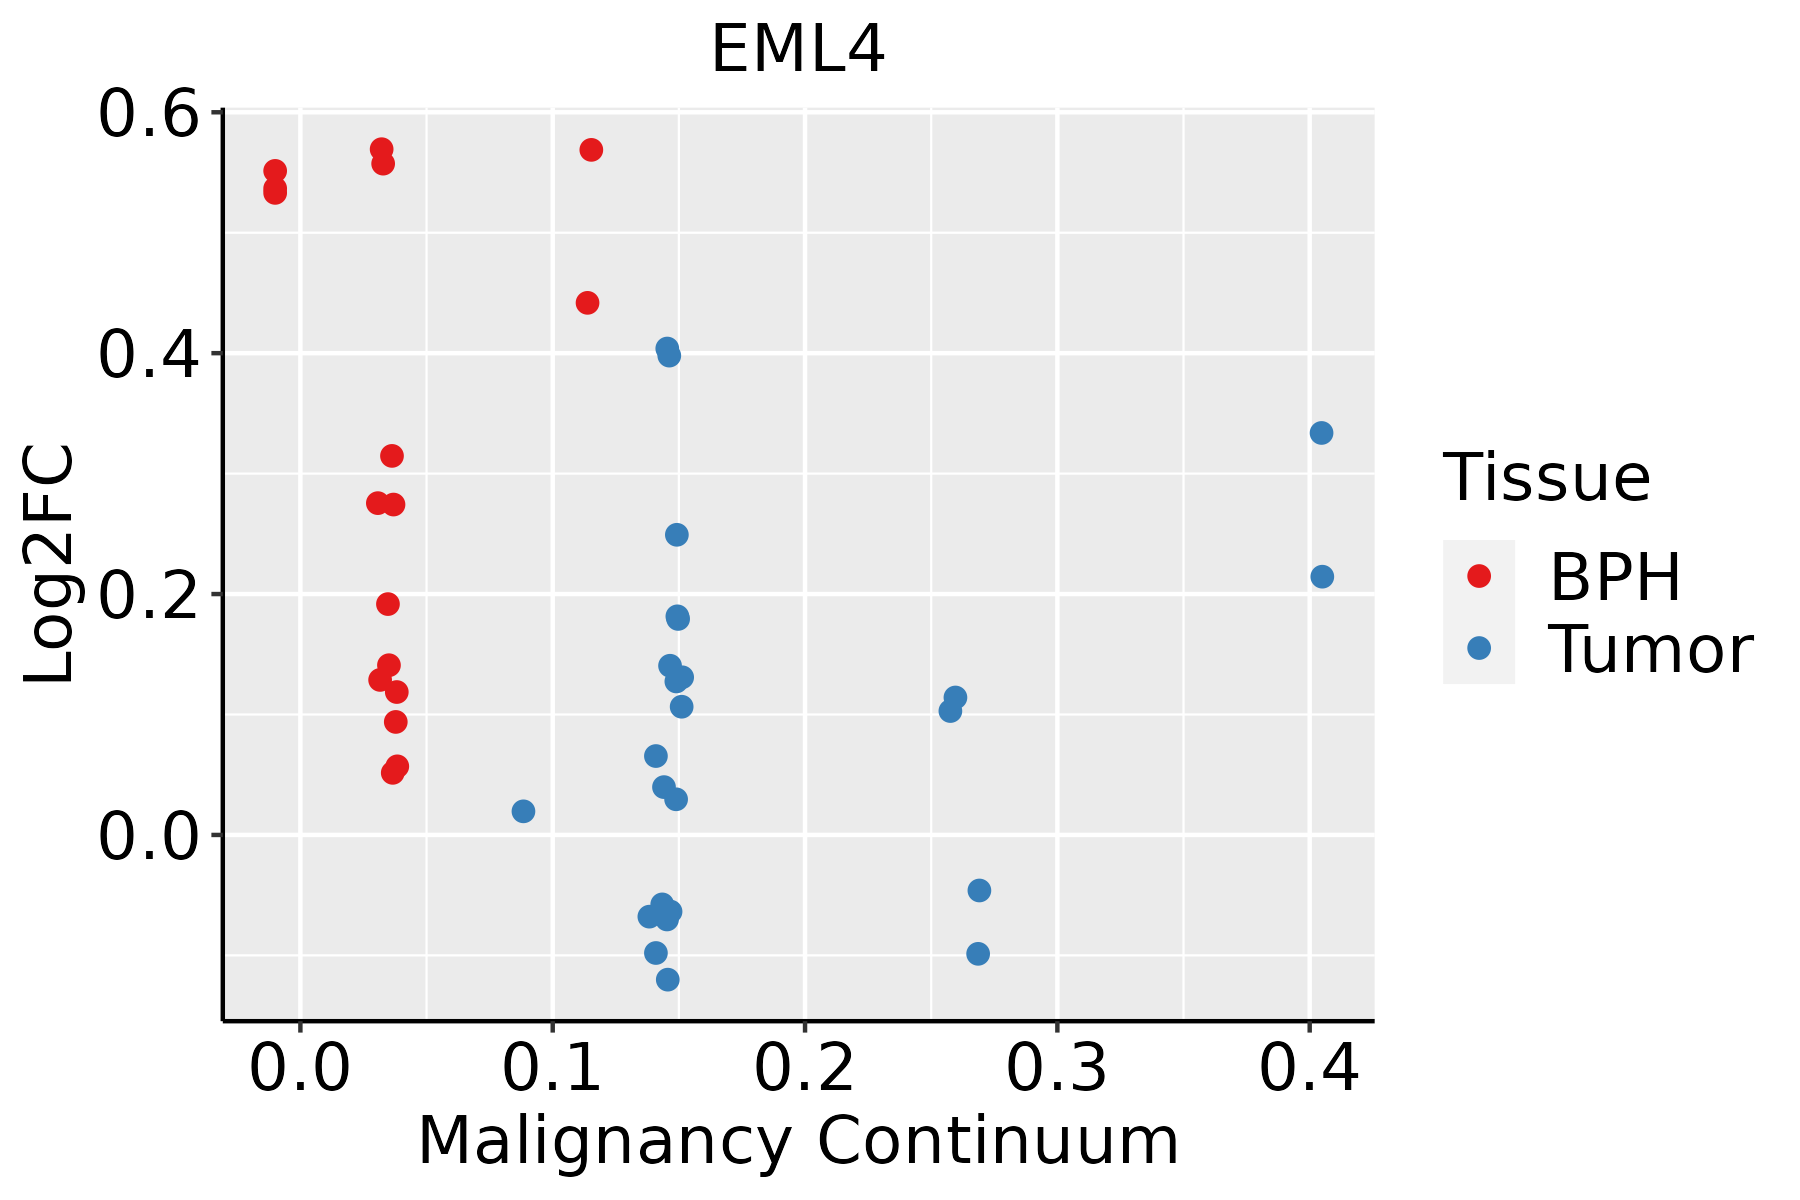 | BPH: Benign Prostatic Hyperplasia |
| Skin | 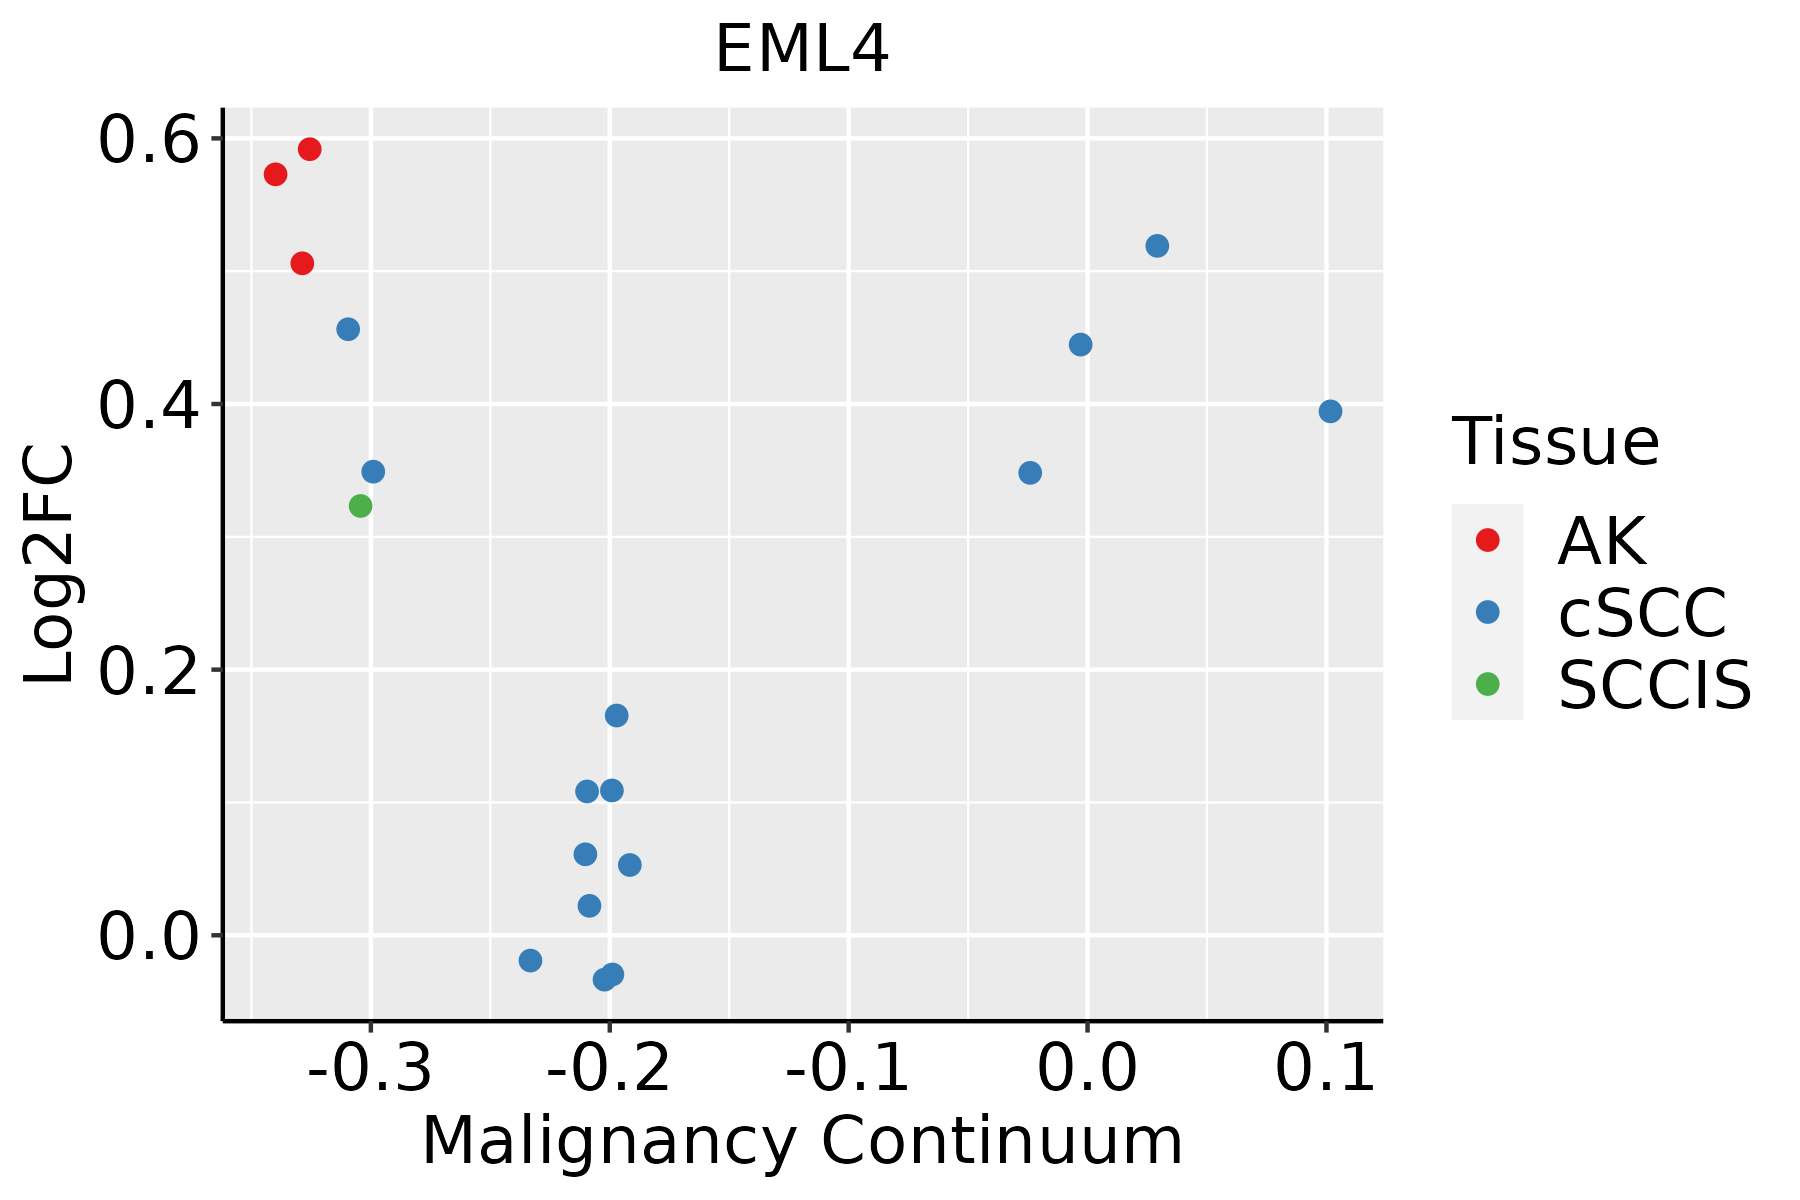 | AK: Actinic keratosis |
| cSCC: Cutaneous squamous cell carcinoma |
| SCCIS:squamous cell carcinoma in situ |
| Thyroid | 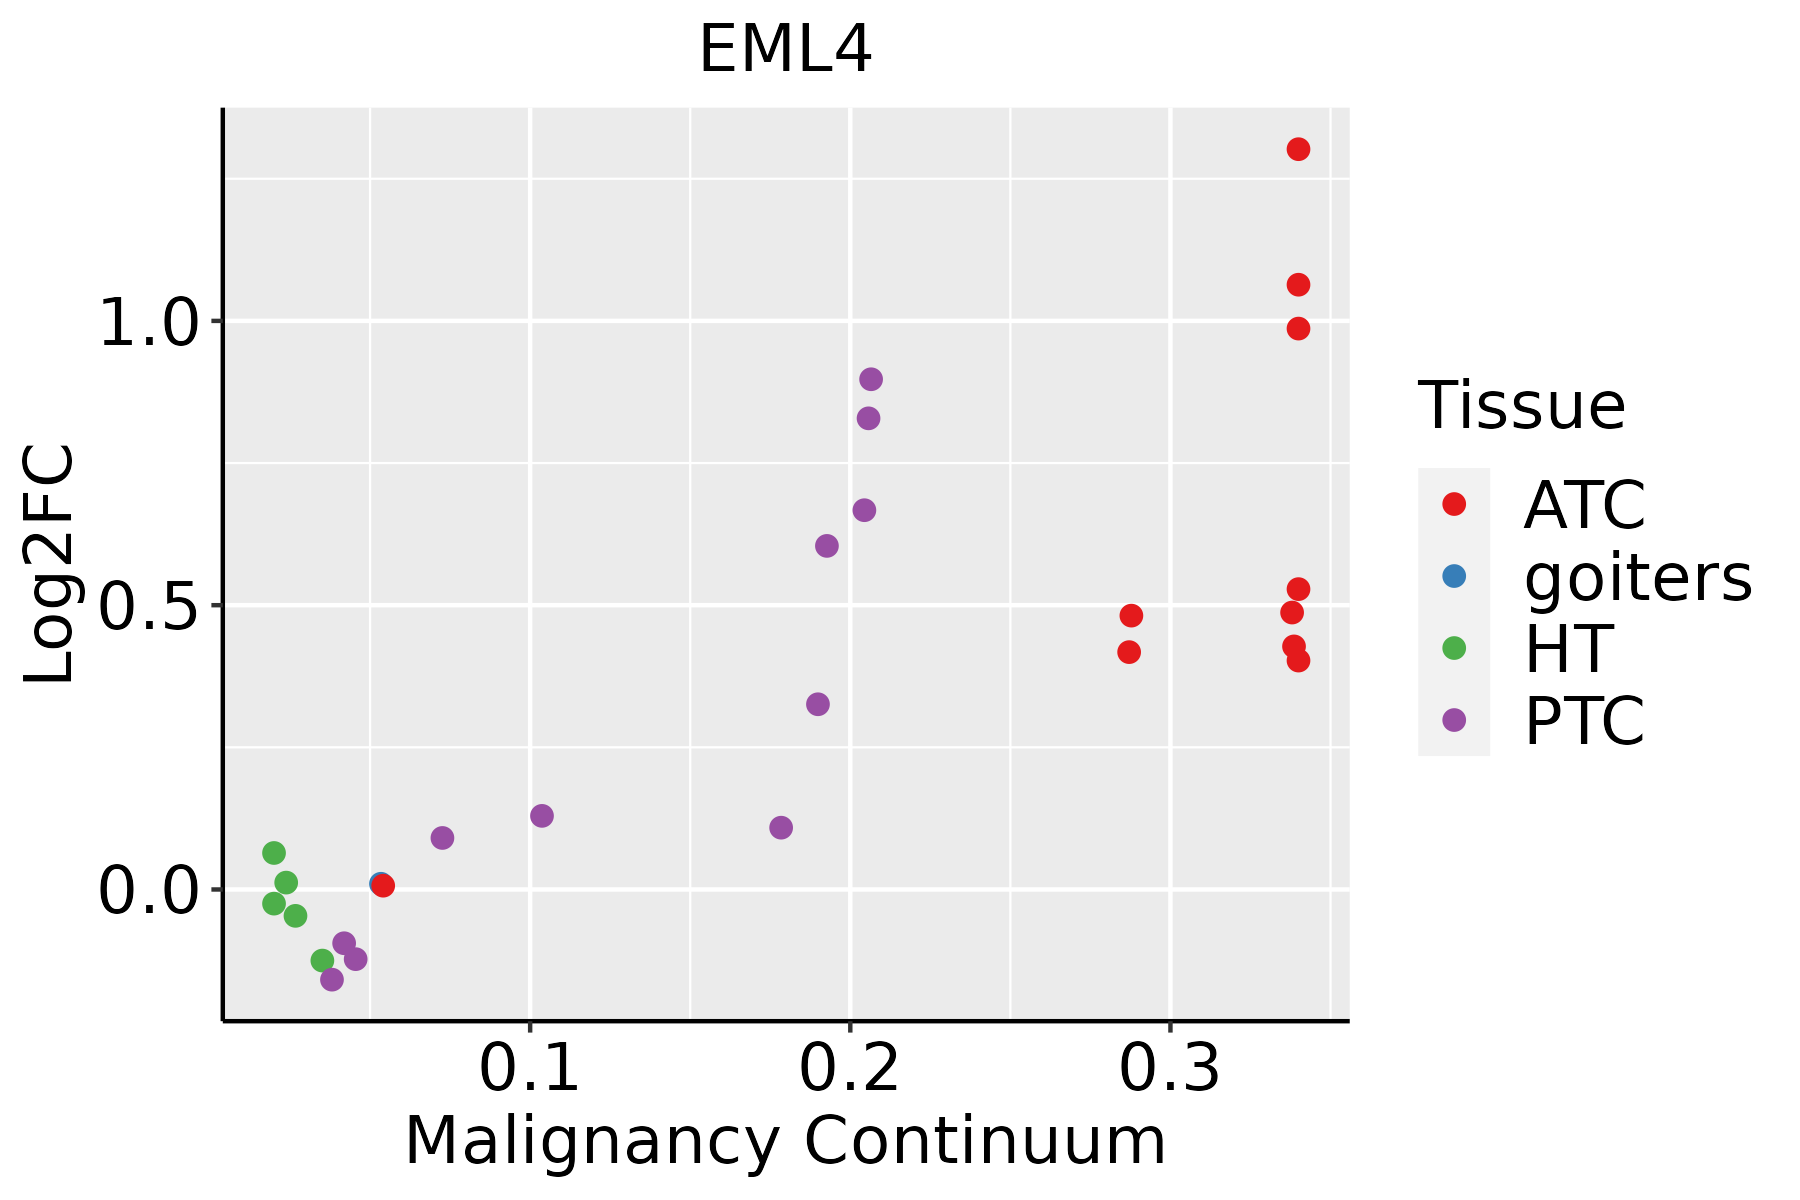 | ATC: Anaplastic thyroid cancer |
| HT: Hashimoto's thyroiditis |
| PTC: Papillary thyroid cancer |
| GO ID | Tissue | Disease Stage | Description | Gene Ratio | Bg Ratio | pvalue | p.adjust | Count |
| GO:00008191 | Liver | HCC | sister chromatid segregation | 128/7958 | 202/18723 | 1.59e-09 | 4.73e-08 | 128 |
| GO:0007059 | Liver | HCC | chromosome segregation | 197/7958 | 346/18723 | 3.57e-08 | 7.87e-07 | 197 |
| GO:0098813 | Liver | HCC | nuclear chromosome segregation | 157/7958 | 281/18723 | 3.82e-06 | 4.95e-05 | 157 |
| GO:0048285 | Liver | HCC | organelle fission | 254/7958 | 488/18723 | 1.07e-05 | 1.23e-04 | 254 |
| GO:0007080 | Liver | HCC | mitotic metaphase plate congression | 36/7958 | 50/18723 | 2.28e-05 | 2.41e-04 | 36 |
| GO:0051310 | Liver | HCC | metaphase plate congression | 42/7958 | 65/18723 | 2.63e-04 | 1.94e-03 | 42 |
| GO:0000280 | Liver | HCC | nuclear division | 220/7958 | 439/18723 | 6.90e-04 | 4.25e-03 | 220 |
| GO:0050000 | Liver | HCC | chromosome localization | 49/7958 | 82/18723 | 1.20e-03 | 6.68e-03 | 49 |
| GO:0051303 | Liver | HCC | establishment of chromosome localization | 47/7958 | 80/18723 | 2.45e-03 | 1.19e-02 | 47 |
| GO:00516566 | Lung | IAC | establishment of organelle localization | 64/2061 | 390/18723 | 7.12e-04 | 9.50e-03 | 64 |
| GO:005165612 | Lung | AIS | establishment of organelle localization | 59/1849 | 390/18723 | 6.08e-04 | 9.24e-03 | 59 |
| GO:005165622 | Lung | MIAC | establishment of organelle localization | 35/967 | 390/18723 | 1.09e-03 | 2.16e-02 | 35 |
| GO:01400145 | Oral cavity | OSCC | mitotic nuclear division | 191/7305 | 287/18723 | 1.99e-21 | 3.70e-19 | 191 |
| GO:005165610 | Oral cavity | OSCC | establishment of organelle localization | 239/7305 | 390/18723 | 2.46e-19 | 3.31e-17 | 239 |
| GO:00000702 | Oral cavity | OSCC | mitotic sister chromatid segregation | 118/7305 | 168/18723 | 1.89e-16 | 1.48e-14 | 118 |
| GO:00008193 | Oral cavity | OSCC | sister chromatid segregation | 135/7305 | 202/18723 | 8.88e-16 | 6.52e-14 | 135 |
| GO:00070592 | Oral cavity | OSCC | chromosome segregation | 206/7305 | 346/18723 | 5.82e-15 | 3.76e-13 | 206 |
| GO:00482852 | Oral cavity | OSCC | organelle fission | 265/7305 | 488/18723 | 3.22e-12 | 1.27e-10 | 265 |
| GO:00070802 | Oral cavity | OSCC | mitotic metaphase plate congression | 42/7305 | 50/18723 | 7.48e-11 | 2.30e-09 | 42 |
| GO:00002801 | Oral cavity | OSCC | nuclear division | 237/7305 | 439/18723 | 9.62e-11 | 2.90e-09 | 237 |
| Pathway ID | Tissue | Disease Stage | Description | Gene Ratio | Bg Ratio | pvalue | p.adjust | qvalue | Count |
| hsa052234 | Cervix | CC | Non-small cell lung cancer | 21/1267 | 72/8465 | 1.48e-03 | 6.32e-03 | 3.74e-03 | 21 |
| hsa0522313 | Cervix | CC | Non-small cell lung cancer | 21/1267 | 72/8465 | 1.48e-03 | 6.32e-03 | 3.74e-03 | 21 |
| hsa05223 | Colorectum | FAP | Non-small cell lung cancer | 20/1404 | 72/8465 | 1.14e-02 | 3.92e-02 | 2.38e-02 | 20 |
| hsa052231 | Colorectum | FAP | Non-small cell lung cancer | 20/1404 | 72/8465 | 1.14e-02 | 3.92e-02 | 2.38e-02 | 20 |
| hsa052356 | Esophagus | ESCC | PD-L1 expression and PD-1 checkpoint pathway in cancer | 58/4205 | 89/8465 | 2.19e-03 | 6.16e-03 | 3.16e-03 | 58 |
| hsa052237 | Esophagus | ESCC | Non-small cell lung cancer | 48/4205 | 72/8465 | 2.57e-03 | 7.05e-03 | 3.61e-03 | 48 |
| hsa0523511 | Esophagus | ESCC | PD-L1 expression and PD-1 checkpoint pathway in cancer | 58/4205 | 89/8465 | 2.19e-03 | 6.16e-03 | 3.16e-03 | 58 |
| hsa0522316 | Esophagus | ESCC | Non-small cell lung cancer | 48/4205 | 72/8465 | 2.57e-03 | 7.05e-03 | 3.61e-03 | 48 |
| hsa052232 | Liver | HCC | Non-small cell lung cancer | 46/4020 | 72/8465 | 3.61e-03 | 1.12e-02 | 6.22e-03 | 46 |
| hsa0522311 | Liver | HCC | Non-small cell lung cancer | 46/4020 | 72/8465 | 3.61e-03 | 1.12e-02 | 6.22e-03 | 46 |
| hsa052233 | Lung | IAC | Non-small cell lung cancer | 17/1053 | 72/8465 | 6.15e-03 | 2.60e-02 | 1.72e-02 | 17 |
| hsa0522312 | Lung | IAC | Non-small cell lung cancer | 17/1053 | 72/8465 | 6.15e-03 | 2.60e-02 | 1.72e-02 | 17 |
| hsa05235 | Oral cavity | OSCC | PD-L1 expression and PD-1 checkpoint pathway in cancer | 56/3704 | 89/8465 | 1.97e-04 | 6.55e-04 | 3.33e-04 | 56 |
| hsa052236 | Oral cavity | OSCC | Non-small cell lung cancer | 46/3704 | 72/8465 | 4.37e-04 | 1.32e-03 | 6.72e-04 | 46 |
| hsa052351 | Oral cavity | OSCC | PD-L1 expression and PD-1 checkpoint pathway in cancer | 56/3704 | 89/8465 | 1.97e-04 | 6.55e-04 | 3.33e-04 | 56 |
| hsa0522315 | Oral cavity | OSCC | Non-small cell lung cancer | 46/3704 | 72/8465 | 4.37e-04 | 1.32e-03 | 6.72e-04 | 46 |
| hsa052352 | Oral cavity | EOLP | PD-L1 expression and PD-1 checkpoint pathway in cancer | 32/1218 | 89/8465 | 2.96e-07 | 3.18e-06 | 1.88e-06 | 32 |
| hsa0522322 | Oral cavity | EOLP | Non-small cell lung cancer | 19/1218 | 72/8465 | 5.29e-03 | 1.63e-02 | 9.60e-03 | 19 |
| hsa052353 | Oral cavity | EOLP | PD-L1 expression and PD-1 checkpoint pathway in cancer | 32/1218 | 89/8465 | 2.96e-07 | 3.18e-06 | 1.88e-06 | 32 |
| hsa0522332 | Oral cavity | EOLP | Non-small cell lung cancer | 19/1218 | 72/8465 | 5.29e-03 | 1.63e-02 | 9.60e-03 | 19 |
| Hugo Symbol | Variant Class | Variant Classification | dbSNP RS | HGVSc | HGVSp | HGVSp Short | SWISSPROT | BIOTYPE | SIFT | PolyPhen | Tumor Sample Barcode | Tissue | Histology | Sex | Age | Stage | Therapy Types | Drugs | Outcome |
| EML4 | SNV | Missense_Mutation | | c.2867A>T | p.Glu956Val | p.E956V | Q9HC35 | protein_coding | tolerated_low_confidence(0.05) | benign(0.003) | TCGA-A8-A085-01 | Breast | breast invasive carcinoma | Male | <65 | I/II | Hormone Therapy | tamoxiphen | SD |
| EML4 | SNV | Missense_Mutation | | c.1778N>G | p.Asp593Gly | p.D593G | Q9HC35 | protein_coding | deleterious(0) | possibly_damaging(0.73) | TCGA-A8-A09Z-01 | Breast | breast invasive carcinoma | Female | >=65 | I/II | Unknown | Unknown | SD |
| EML4 | SNV | Missense_Mutation | | c.2908N>A | p.Leu970Ile | p.L970I | Q9HC35 | protein_coding | tolerated_low_confidence(0.63) | benign(0) | TCGA-B6-A0IJ-01 | Breast | breast invasive carcinoma | Female | <65 | I/II | Unknown | Unknown | SD |
| EML4 | insertion | In_Frame_Ins | novel | c.301_302insGAGTCAAATGCTTCT | p.Ile101delinsArgValLysCysPhePhe | p.I101delinsRVKCFF | Q9HC35 | protein_coding | | | TCGA-A2-A04Y-01 | Breast | breast invasive carcinoma | Female | <65 | I/II | Chemotherapy | cytoxan | SD |
| EML4 | insertion | Nonsense_Mutation | novel | c.2910_2911insTGCCGATGACTTTTGTAAAGTC | p.Leu971CysfsTer3 | p.L971Cfs*3 | Q9HC35 | protein_coding | | | TCGA-BH-A0B1-01 | Breast | breast invasive carcinoma | Female | >=65 | I/II | Chemotherapy | adriamycin | SD |
| EML4 | insertion | Frame_Shift_Ins | novel | c.122_123insA | p.Ala43GlyfsTer5 | p.A43Gfs*5 | Q9HC35 | protein_coding | | | TCGA-C8-A135-01 | Breast | breast invasive carcinoma | Female | <65 | I/II | Chemotherapy | 5-fluorouracil | CR |
| EML4 | SNV | Missense_Mutation | novel | c.1658G>A | p.Gly553Asp | p.G553D | Q9HC35 | protein_coding | deleterious(0) | probably_damaging(1) | TCGA-2W-A8YY-01 | Cervix | cervical & endocervical cancer | Female | <65 | I/II | Chemotherapy | cisplatin | CR |
| EML4 | SNV | Missense_Mutation | novel | c.1934G>A | p.Gly645Asp | p.G645D | Q9HC35 | protein_coding | deleterious(0) | probably_damaging(0.98) | TCGA-2W-A8YY-01 | Cervix | cervical & endocervical cancer | Female | <65 | I/II | Chemotherapy | cisplatin | CR |
| EML4 | SNV | Missense_Mutation | novel | c.1919N>T | p.Asp640Val | p.D640V | Q9HC35 | protein_coding | tolerated(0.09) | possibly_damaging(0.682) | TCGA-C5-A1M9-01 | Cervix | cervical & endocervical cancer | Female | <65 | I/II | Chemotherapy | cisplatin | PD |
| EML4 | SNV | Missense_Mutation | | c.1603C>A | p.Leu535Met | p.L535M | Q9HC35 | protein_coding | tolerated(0.13) | benign(0.077) | TCGA-AA-3977-01 | Colorectum | colon adenocarcinoma | Male | >=65 | I/II | Unknown | Unknown | SD |
| Entrez ID | Symbol | Category | Interaction Types | Drug Claim Name | Drug Name | PMIDs |
| 27436 | EML4 | CLINICALLY ACTIONABLE, KINASE | | TAE226 | | 26090892 |
| 27436 | EML4 | CLINICALLY ACTIONABLE, KINASE | | Sirolimus | SIROLIMUS | 21613408 |
| 27436 | EML4 | CLINICALLY ACTIONABLE, KINASE | | AZD3463 | | 27009859 |
| 27436 | EML4 | CLINICALLY ACTIONABLE, KINASE | | Crizotinib | CRIZOTINIB | 26775591,27009859,22277784,20979469,22235099,28476735,27354483,27432227,25228534,26698910,21613408,26554404,23344087,21791641,27780853,24675041 |
| 27436 | EML4 | CLINICALLY ACTIONABLE, KINASE | | Alectinib | ALECTINIB | 27009859,28476735,25393796,26849637,27432227,26682573,25228534,21575866,26698910,23344087 |
| 27436 | EML4 | CLINICALLY ACTIONABLE, KINASE | | AUY922 | | 26698910 |
| 27436 | EML4 | CLINICALLY ACTIONABLE, KINASE | | PF-06463922 | LORLATINIB | 27432227,26698910,26144315,26554404 |
| 27436 | EML4 | CLINICALLY ACTIONABLE, KINASE | | Afatinib | AFATINIB | 26682573 |
| 27436 | EML4 | CLINICALLY ACTIONABLE, KINASE | | X-396 | ENSARTINIB | 21613408 |
| 27436 | EML4 | CLINICALLY ACTIONABLE, KINASE | | AP26113 | CHEMBL3397300 | 27009859,27432227,25228534,26698910,27780853 |


