
|
|||||
|
 | |
| |
| |
| |
| |
| |
|
Gene: ELN |
Gene summary for ELN |
| Gene information | Species | Human | Gene symbol | ELN | Gene ID | 2006 |
| Gene name | elastin | |
| Gene Alias | ADCL1 | |
| Cytomap | 7q11.23 | |
| Gene Type | protein-coding | GO ID | GO:0003007 | UniProtAcc | P15502 |
Top |
Malignant transformation analysis |
| Identification of the aberrant gene expression in precancerous and cancerous lesions by comparing the gene expression of stem-like cells in diseased tissues with normal stem cells |
| Entrez ID | Symbol | Replicates | Species | Organ | Tissue | Adj P-value | Log2FC | Malignancy |
| 2006 | ELN | P4T-E | Human | Esophagus | ESCC | 1.70e-06 | 2.68e-01 | 0.1323 |
| 2006 | ELN | P8T-E | Human | Esophagus | ESCC | 2.96e-08 | 3.28e-01 | 0.0889 |
| 2006 | ELN | P10T-E | Human | Esophagus | ESCC | 2.23e-13 | 3.04e-01 | 0.116 |
| 2006 | ELN | P12T-E | Human | Esophagus | ESCC | 6.44e-09 | 2.72e-01 | 0.1122 |
| 2006 | ELN | P16T-E | Human | Esophagus | ESCC | 5.32e-12 | 3.79e-01 | 0.1153 |
| 2006 | ELN | P19T-E | Human | Esophagus | ESCC | 9.01e-04 | 8.91e-01 | 0.1662 |
| 2006 | ELN | P21T-E | Human | Esophagus | ESCC | 4.36e-08 | 3.05e-01 | 0.1617 |
| 2006 | ELN | P22T-E | Human | Esophagus | ESCC | 2.01e-02 | -8.46e-03 | 0.1236 |
| 2006 | ELN | P27T-E | Human | Esophagus | ESCC | 7.13e-19 | 5.63e-01 | 0.1055 |
| 2006 | ELN | P56T-E | Human | Esophagus | ESCC | 1.62e-04 | 4.04e-01 | 0.1613 |
| 2006 | ELN | P57T-E | Human | Esophagus | ESCC | 2.53e-11 | 4.89e-01 | 0.0926 |
| 2006 | ELN | P62T-E | Human | Esophagus | ESCC | 9.07e-17 | 6.91e-01 | 0.1302 |
| 2006 | ELN | P65T-E | Human | Esophagus | ESCC | 1.75e-46 | 1.69e+00 | 0.0978 |
| 2006 | ELN | P74T-E | Human | Esophagus | ESCC | 2.43e-37 | 1.49e+00 | 0.1479 |
| 2006 | ELN | P76T-E | Human | Esophagus | ESCC | 2.38e-02 | 7.25e-03 | 0.1207 |
| 2006 | ELN | P79T-E | Human | Esophagus | ESCC | 5.88e-06 | 2.36e-01 | 0.1154 |
| 2006 | ELN | S014 | Human | Liver | HCC | 5.48e-15 | 6.72e-01 | 0.2254 |
| 2006 | ELN | S015 | Human | Liver | HCC | 2.28e-13 | 6.75e-01 | 0.2375 |
| 2006 | ELN | S016 | Human | Liver | HCC | 4.21e-13 | 6.76e-01 | 0.2243 |
| 2006 | ELN | ATC13 | Human | Thyroid | ATC | 2.62e-100 | 2.42e+00 | 0.34 |
| Page: 1 2 |
| Tissue | Expression Dynamics | Abbreviation |
| Esophagus |  | ESCC: Esophageal squamous cell carcinoma |
| HGIN: High-grade intraepithelial neoplasias | ||
| LGIN: Low-grade intraepithelial neoplasias | ||
| Liver | 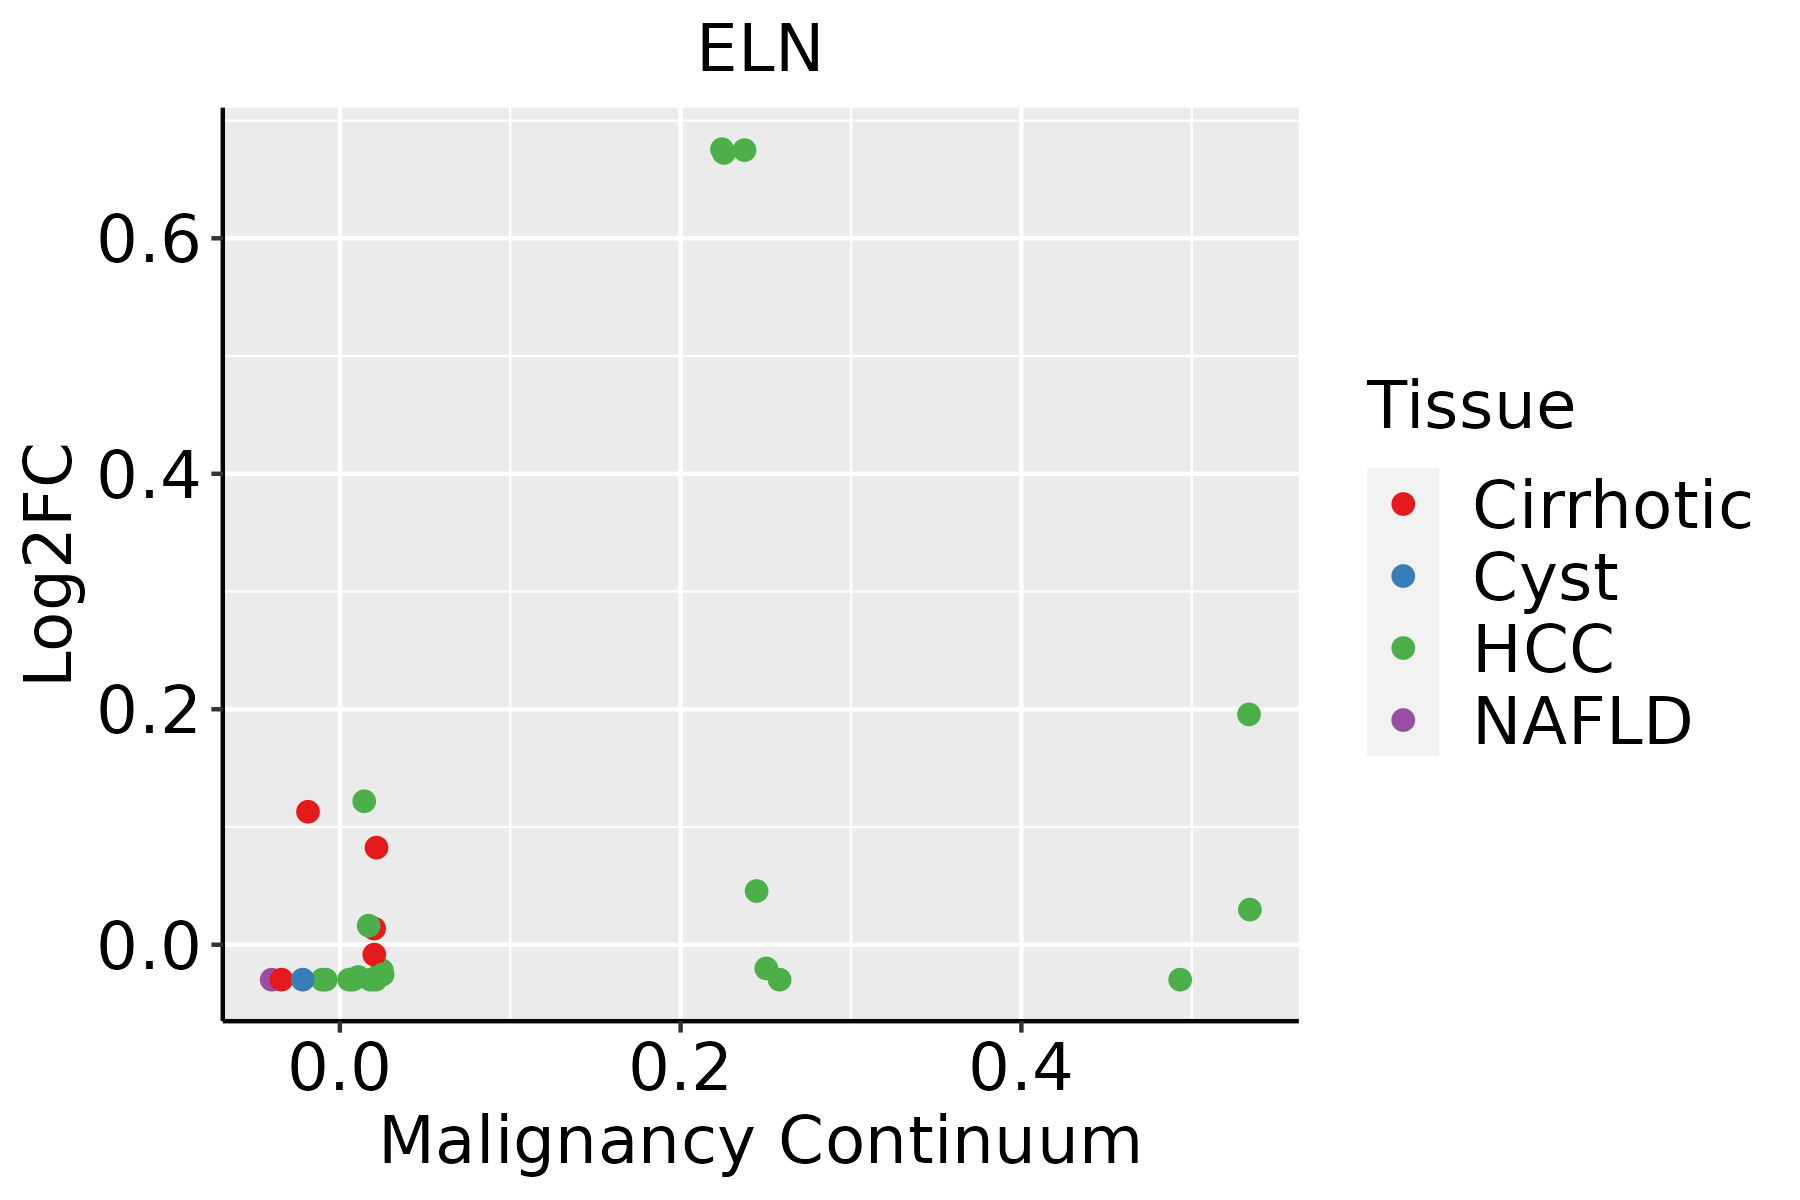 | HCC: Hepatocellular carcinoma |
| NAFLD: Non-alcoholic fatty liver disease | ||
| Thyroid | 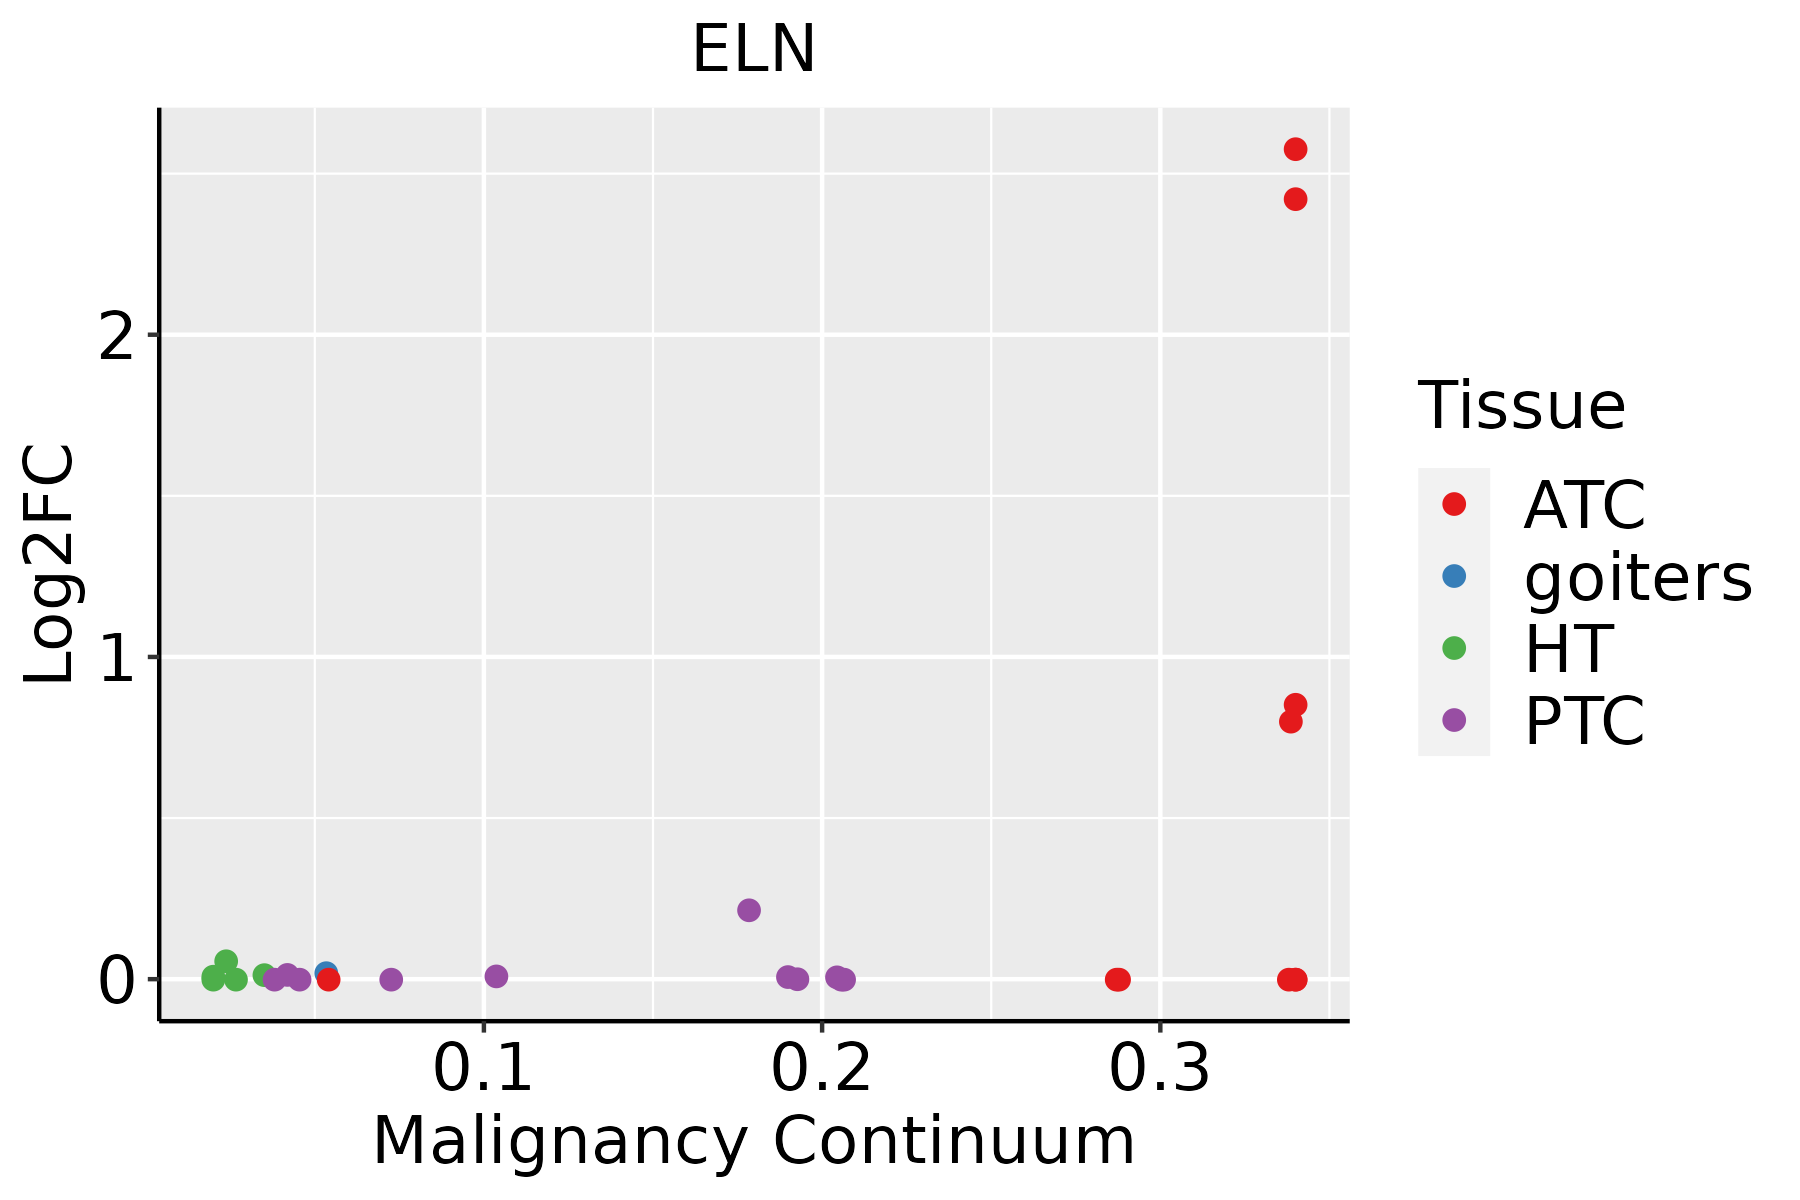 | ATC: Anaplastic thyroid cancer |
| HT: Hashimoto's thyroiditis | ||
| PTC: Papillary thyroid cancer |
| ∗log2FC in expression of this searched gene in stem-like cells from each diseased tissue sample relative to stem-like cells in normal samples in each tissue plotted against the malignancy continuum. Samples are colored based on if they are from different disease stage. |
Top |
Malignant transformation related pathway analysis |
| Find out the enriched GO biological processes and KEGG pathways involved in transition from healthy to precancer to cancer |
| Tissue | Disease Stage | Enriched GO biological Processes |
| Colorectum | AD |  |
| Colorectum | SER |  |
| Colorectum | MSS |  |
| Colorectum | MSI-H |  |
| Colorectum | FAP |  |
| ∗Top 15 enriched GO BP terms are showed in the bar plot of each disease state in each tissue. Each row represents a significant GO biological process which is colored according to the -log10(p.adjust). |
| Page: 1 2 3 4 5 6 7 8 9 |
| GO ID | Tissue | Disease Stage | Description | Gene Ratio | Bg Ratio | pvalue | p.adjust | Count |
| GO:001076922 | Liver | HCC | regulation of cell morphogenesis involved in differentiation | 65/7958 | 96/18723 | 5.17e-07 | 8.37e-06 | 65 |
| GO:011005322 | Liver | HCC | regulation of actin filament organization | 158/7958 | 278/18723 | 9.01e-07 | 1.37e-05 | 158 |
| GO:00315031 | Liver | HCC | protein-containing complex localization | 129/7958 | 220/18723 | 9.38e-07 | 1.42e-05 | 129 |
| GO:003083212 | Liver | HCC | regulation of actin filament length | 113/7958 | 189/18723 | 1.16e-06 | 1.71e-05 | 113 |
| GO:003083322 | Liver | HCC | regulation of actin filament polymerization | 104/7958 | 172/18723 | 1.46e-06 | 2.08e-05 | 104 |
| GO:000806412 | Liver | HCC | regulation of actin polymerization or depolymerization | 112/7958 | 188/18723 | 1.65e-06 | 2.31e-05 | 112 |
| GO:005101722 | Liver | HCC | actin filament bundle assembly | 96/7958 | 157/18723 | 1.81e-06 | 2.52e-05 | 96 |
| GO:003134611 | Liver | HCC | positive regulation of cell projection organization | 193/7958 | 353/18723 | 2.28e-06 | 3.08e-05 | 193 |
| GO:006157222 | Liver | HCC | actin filament bundle organization | 97/7958 | 161/18723 | 4.04e-06 | 5.22e-05 | 97 |
| GO:00319291 | Liver | HCC | TOR signaling | 78/7958 | 126/18723 | 8.49e-06 | 9.97e-05 | 78 |
| GO:001077022 | Liver | HCC | positive regulation of cell morphogenesis involved in differentiation | 53/7958 | 79/18723 | 8.69e-06 | 1.02e-04 | 53 |
| GO:003103222 | Liver | HCC | actomyosin structure organization | 109/7958 | 196/18723 | 1.39e-04 | 1.13e-03 | 109 |
| GO:0032006 | Liver | HCC | regulation of TOR signaling | 63/7958 | 104/18723 | 1.50e-04 | 1.20e-03 | 63 |
| GO:2001224 | Liver | HCC | positive regulation of neuron migration | 14/7958 | 16/18723 | 2.73e-04 | 1.98e-03 | 14 |
| GO:001072011 | Liver | HCC | positive regulation of cell development | 155/7958 | 298/18723 | 5.39e-04 | 3.48e-03 | 155 |
| GO:00510902 | Liver | HCC | regulation of DNA-binding transcription factor activity | 220/7958 | 440/18723 | 8.04e-04 | 4.82e-03 | 220 |
| GO:0032008 | Liver | HCC | positive regulation of TOR signaling | 31/7958 | 47/18723 | 9.90e-04 | 5.71e-03 | 31 |
| GO:004586021 | Liver | HCC | positive regulation of protein kinase activity | 194/7958 | 386/18723 | 1.16e-03 | 6.54e-03 | 194 |
| GO:001097511 | Liver | HCC | regulation of neuron projection development | 220/7958 | 445/18723 | 1.68e-03 | 8.78e-03 | 220 |
| GO:003367411 | Liver | HCC | positive regulation of kinase activity | 230/7958 | 467/18723 | 1.72e-03 | 8.95e-03 | 230 |
| Page: 1 2 3 4 5 6 |
| Pathway ID | Tissue | Disease Stage | Description | Gene Ratio | Bg Ratio | pvalue | p.adjust | qvalue | Count |
| Page: 1 |
Top |
Cell-cell communication analysis |
| Identification of potential cell-cell interactions between two cell types and their ligand-receptor pairs for different disease states |
| Ligand | Receptor | LRpair | Pathway | Tissue | Disease Stage |
| Page: 1 |
Top |
Single-cell gene regulatory network inference analysis |
| Find out the significant the regulons (TFs) and the target genes of each regulon across cell types for different disease states |
| TF | Cell Type | Tissue | Disease Stage | Target Gene | RSS | Regulon Activity |
| ∗The dot plots of a searched regulon are shown for all cell subpopulations in each disease state of each tissue based on the regulon specific score inferred using pySCENIC and by calculating the average expression. |
| Page: 1 |
Top |
Somatic mutation of malignant transformation related genes |
| Annotation of somatic variants for genes involved in malignant transformation |
| Hugo Symbol | Variant Class | Variant Classification | dbSNP RS | HGVSc | HGVSp | HGVSp Short | SWISSPROT | BIOTYPE | SIFT | PolyPhen | Tumor Sample Barcode | Tissue | Histology | Sex | Age | Stage | Therapy Types | Drugs | Outcome |
| ELN | SNV | Missense_Mutation | novel | c.418N>G | p.Lys140Glu | p.K140E | protein_coding | deleterious_low_confidence(0) | probably_damaging(0.987) | TCGA-A2-A3XS-01 | Breast | breast invasive carcinoma | Female | <65 | III/IV | Chemotherapy | cytoxan | PD | |
| ELN | SNV | Missense_Mutation | rs782282589 | c.343N>A | p.Val115Ile | p.V115I | protein_coding | tolerated_low_confidence(0.07) | benign(0.003) | TCGA-A8-A08F-01 | Breast | breast invasive carcinoma | Female | <65 | III/IV | Chemotherapy | 5-fluorouracil | CR | |
| ELN | SNV | Missense_Mutation | c.178G>C | p.Gly60Arg | p.G60R | protein_coding | deleterious_low_confidence(0) | possibly_damaging(0.776) | TCGA-AN-A0FN-01 | Breast | breast invasive carcinoma | Female | <65 | I/II | Unknown | Unknown | SD | ||
| ELN | SNV | Missense_Mutation | c.1519N>C | p.Gly507Arg | p.G507R | protein_coding | deleterious_low_confidence(0) | benign(0.239) | TCGA-AR-A0TP-01 | Breast | breast invasive carcinoma | Female | <65 | I/II | Chemotherapy | doxorubicin | SD | ||
| ELN | SNV | Missense_Mutation | novel | c.1900N>G | p.Gln634Glu | p.Q634E | protein_coding | unknown(0) | TCGA-BH-A0B6-01 | Breast | breast invasive carcinoma | Female | <65 | I/II | Unknown | Unknown | SD | ||
| ELN | SNV | Missense_Mutation | c.1897T>C | p.Ser633Pro | p.S633P | protein_coding | unknown(0) | TCGA-E9-A247-01 | Breast | breast invasive carcinoma | Female | <65 | I/II | Hormone Therapy | tamoxiphen | SD | |||
| ELN | SNV | Missense_Mutation | c.1546N>A | p.Pro516Thr | p.P516T | protein_coding | deleterious_low_confidence(0) | benign(0) | TCGA-LL-A441-01 | Breast | breast invasive carcinoma | Female | <65 | I/II | Chemotherapy | taxotere | CR | ||
| ELN | insertion | Nonsense_Mutation | novel | c.1847_1848insCACACAGCAAATCTATGCCAGGGCCGAGGCTCCAGCCCTCTTTCCATA | p.Gly616_Val617insThrGlnGlnIleTyrAlaArgAlaGluAlaProAlaLeuPheProTer | p.G616_V617insTQQIYARAEAPALFP* | protein_coding | TCGA-A2-A0D1-01 | Breast | breast invasive carcinoma | Female | >=65 | I/II | Chemotherapy | taxotere | SD | |||
| ELN | insertion | In_Frame_Ins | novel | c.609_610insGCTACTTGGGAGGCTGAGGCAGGAGGATTG | p.Pro203_Leu204insAlaThrTrpGluAlaGluAlaGlyGlyLeu | p.P203_L204insATWEAEAGGL | protein_coding | TCGA-A2-A0EX-01 | Breast | breast invasive carcinoma | Female | <65 | I/II | Hormone Therapy | tamoxiphen | SD | |||
| ELN | insertion | In_Frame_Ins | novel | c.903_904insCTCCAT | p.Pro301_Ala302insLeuHis | p.P301_A302insLH | protein_coding | TCGA-AN-A0FW-01 | Breast | breast invasive carcinoma | Female | >=65 | III/IV | Unknown | Unknown | SD |
| Page: 1 2 3 4 5 6 7 8 |
Top |
Related drugs of malignant transformation related genes |
| Identification of chemicals and drugs interact with genes involved in malignant transfromation |
| (DGIdb 4.0) |
| Entrez ID | Symbol | Category | Interaction Types | Drug Claim Name | Drug Name | PMIDs |
| 2006 | ELN | DRUGGABLE GENOME, CLINICALLY ACTIONABLE | PRT-201 | VONAPANITASE | ||
| 2006 | ELN | DRUGGABLE GENOME, CLINICALLY ACTIONABLE | CHEMBL3545070 | VONAPANITASE |
| Page: 1 |

Copyright 2023-Present -The University of Texas Health Science Center at Houston |