
|
|||||
|
 | |
| |
| |
| |
| |
| |
|
Gene: ELK1 |
Gene summary for ELK1 |
| Gene information | Species | Human | Gene symbol | ELK1 | Gene ID | 2002 |
| Gene name | ETS transcription factor ELK1 | |
| Gene Alias | ELK1 | |
| Cytomap | Xp11.23 | |
| Gene Type | protein-coding | GO ID | GO:0001889 | UniProtAcc | A0A024R1A7 |
Top |
Malignant transformation analysis |
| Identification of the aberrant gene expression in precancerous and cancerous lesions by comparing the gene expression of stem-like cells in diseased tissues with normal stem cells |
| Entrez ID | Symbol | Replicates | Species | Organ | Tissue | Adj P-value | Log2FC | Malignancy |
| 2002 | ELK1 | LZE4T | Human | Esophagus | ESCC | 9.23e-05 | 6.38e-02 | 0.0811 |
| 2002 | ELK1 | LZE7T | Human | Esophagus | ESCC | 2.42e-02 | 1.30e-01 | 0.0667 |
| 2002 | ELK1 | LZE8T | Human | Esophagus | ESCC | 3.95e-04 | 9.27e-02 | 0.067 |
| 2002 | ELK1 | LZE24T | Human | Esophagus | ESCC | 5.58e-16 | 1.79e-01 | 0.0596 |
| 2002 | ELK1 | P2T-E | Human | Esophagus | ESCC | 1.60e-12 | 3.32e-01 | 0.1177 |
| 2002 | ELK1 | P4T-E | Human | Esophagus | ESCC | 1.55e-11 | 2.62e-01 | 0.1323 |
| 2002 | ELK1 | P5T-E | Human | Esophagus | ESCC | 7.96e-07 | 5.63e-02 | 0.1327 |
| 2002 | ELK1 | P8T-E | Human | Esophagus | ESCC | 7.51e-12 | 2.46e-01 | 0.0889 |
| 2002 | ELK1 | P9T-E | Human | Esophagus | ESCC | 5.71e-06 | 6.35e-02 | 0.1131 |
| 2002 | ELK1 | P10T-E | Human | Esophagus | ESCC | 1.14e-09 | 1.81e-01 | 0.116 |
| 2002 | ELK1 | P11T-E | Human | Esophagus | ESCC | 8.78e-07 | 3.72e-01 | 0.1426 |
| 2002 | ELK1 | P12T-E | Human | Esophagus | ESCC | 2.69e-13 | 1.21e-01 | 0.1122 |
| 2002 | ELK1 | P15T-E | Human | Esophagus | ESCC | 4.72e-09 | 2.02e-01 | 0.1149 |
| 2002 | ELK1 | P16T-E | Human | Esophagus | ESCC | 2.96e-23 | 4.76e-01 | 0.1153 |
| 2002 | ELK1 | P17T-E | Human | Esophagus | ESCC | 3.28e-05 | 1.35e-01 | 0.1278 |
| 2002 | ELK1 | P20T-E | Human | Esophagus | ESCC | 9.68e-14 | 3.89e-01 | 0.1124 |
| 2002 | ELK1 | P21T-E | Human | Esophagus | ESCC | 3.72e-20 | 3.09e-01 | 0.1617 |
| 2002 | ELK1 | P22T-E | Human | Esophagus | ESCC | 3.75e-20 | 3.99e-01 | 0.1236 |
| 2002 | ELK1 | P23T-E | Human | Esophagus | ESCC | 1.84e-15 | 4.24e-01 | 0.108 |
| 2002 | ELK1 | P24T-E | Human | Esophagus | ESCC | 1.92e-05 | 1.14e-01 | 0.1287 |
| Page: 1 2 3 4 5 |
| Tissue | Expression Dynamics | Abbreviation |
| Esophagus | 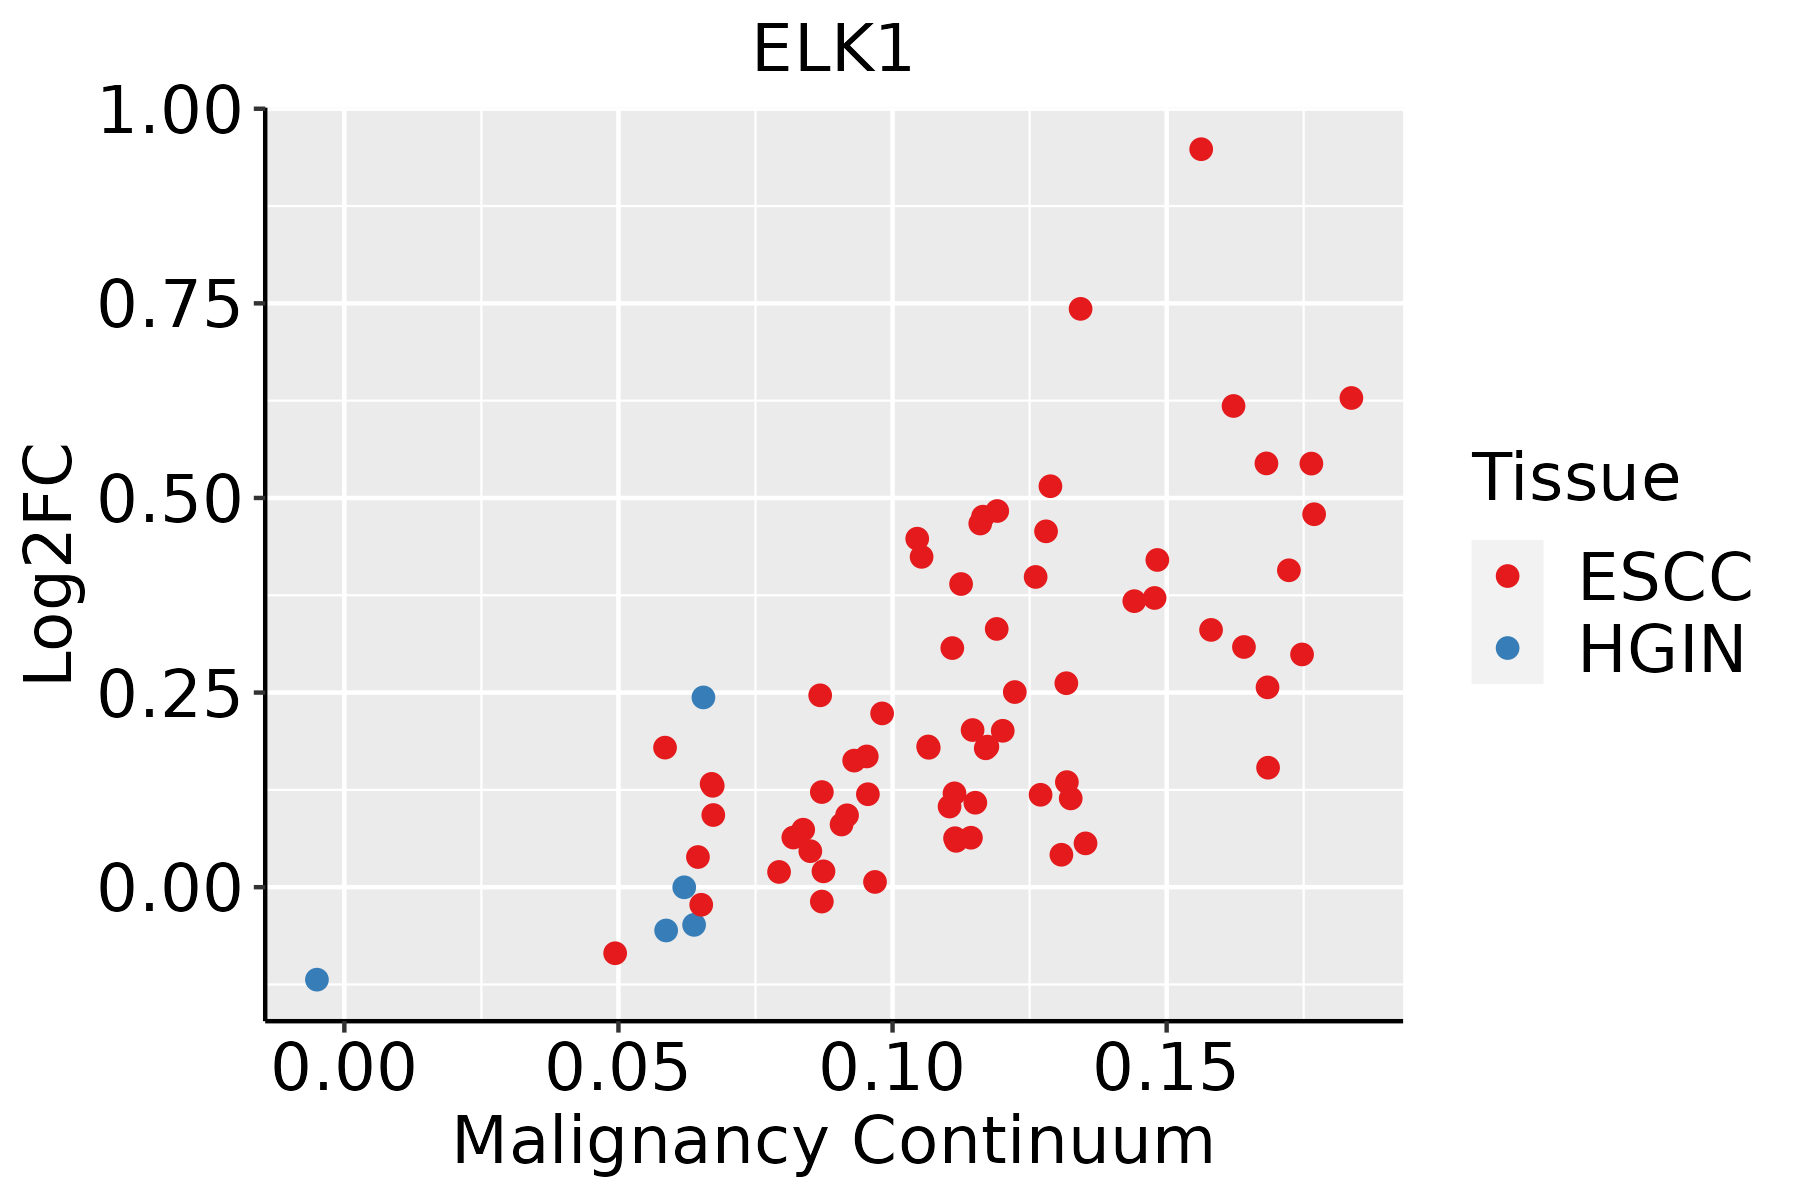 | ESCC: Esophageal squamous cell carcinoma |
| HGIN: High-grade intraepithelial neoplasias | ||
| LGIN: Low-grade intraepithelial neoplasias | ||
| Liver |  | HCC: Hepatocellular carcinoma |
| NAFLD: Non-alcoholic fatty liver disease | ||
| Oral Cavity | 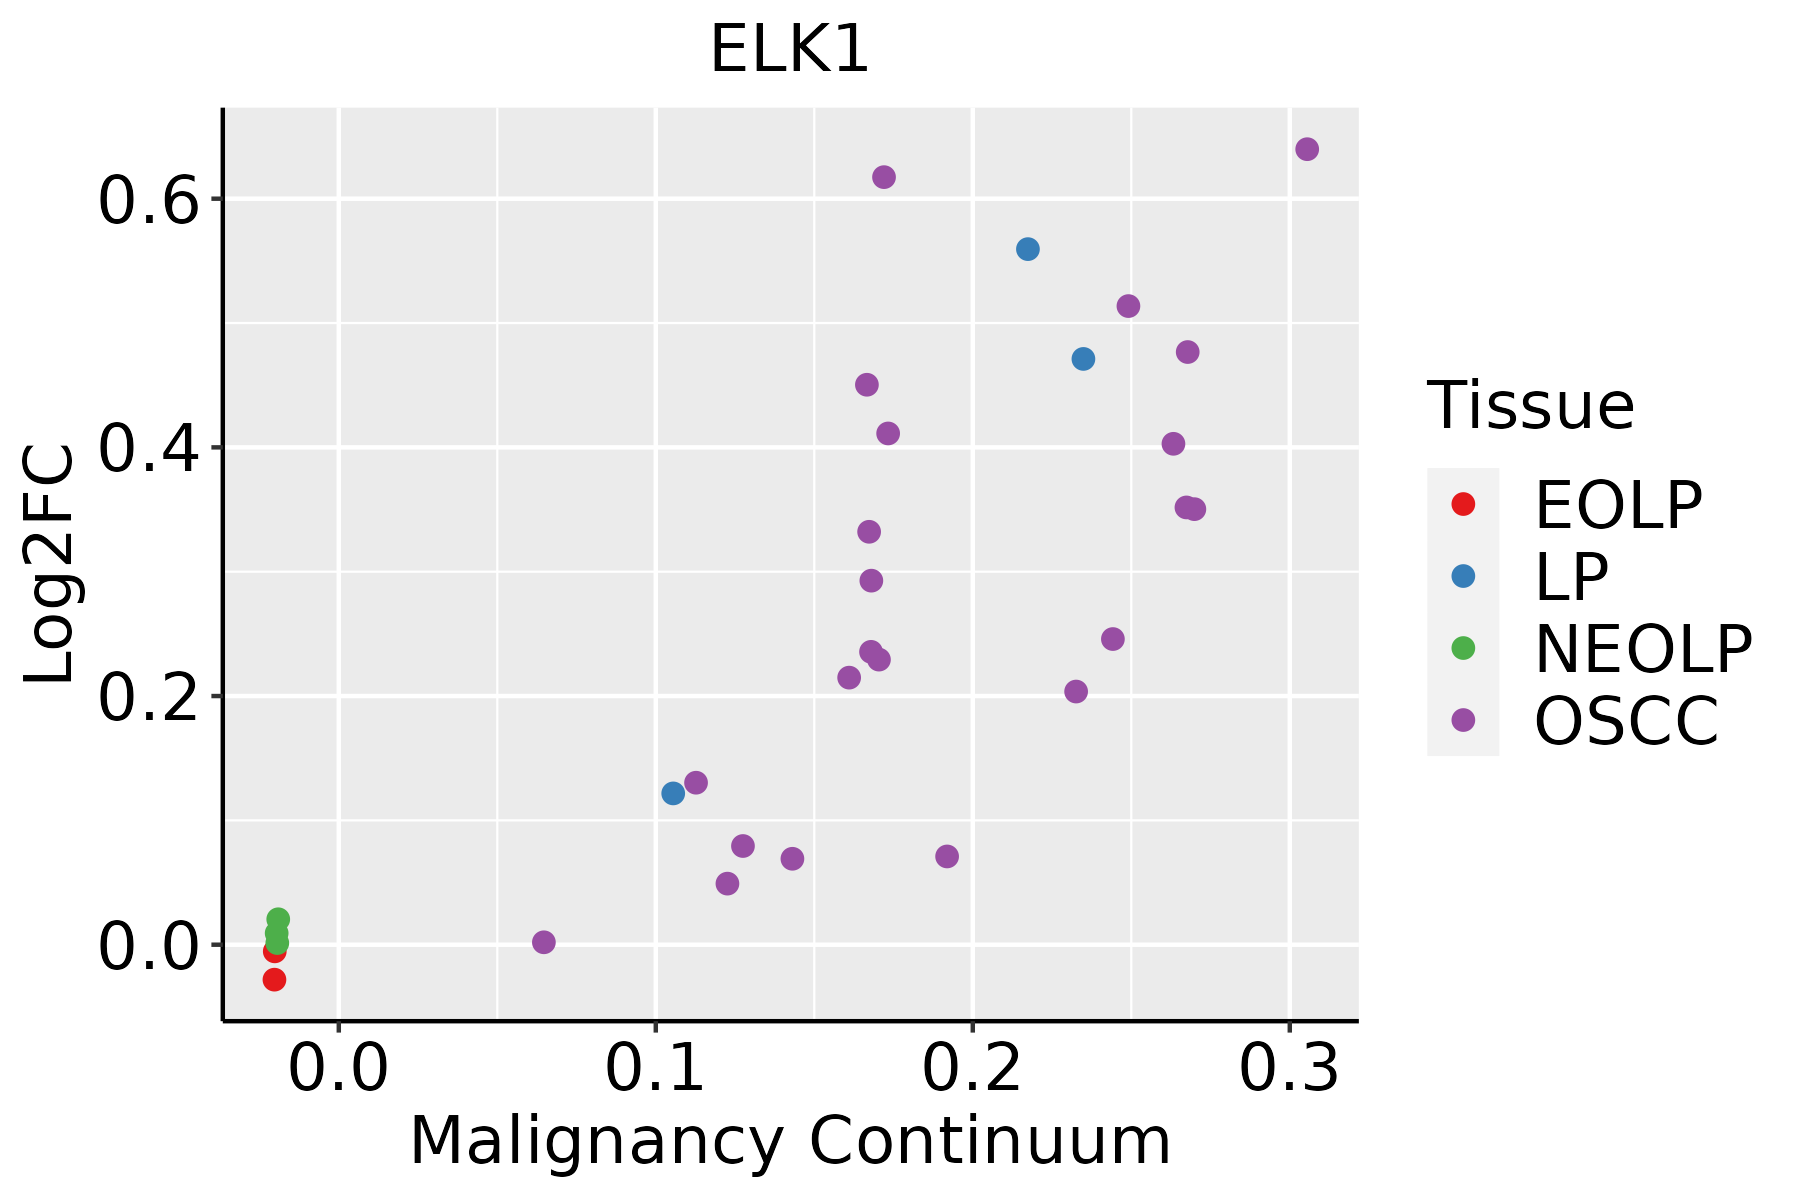 | EOLP: Erosive Oral lichen planus |
| LP: leukoplakia | ||
| NEOLP: Non-erosive oral lichen planus | ||
| OSCC: Oral squamous cell carcinoma | ||
| Thyroid | 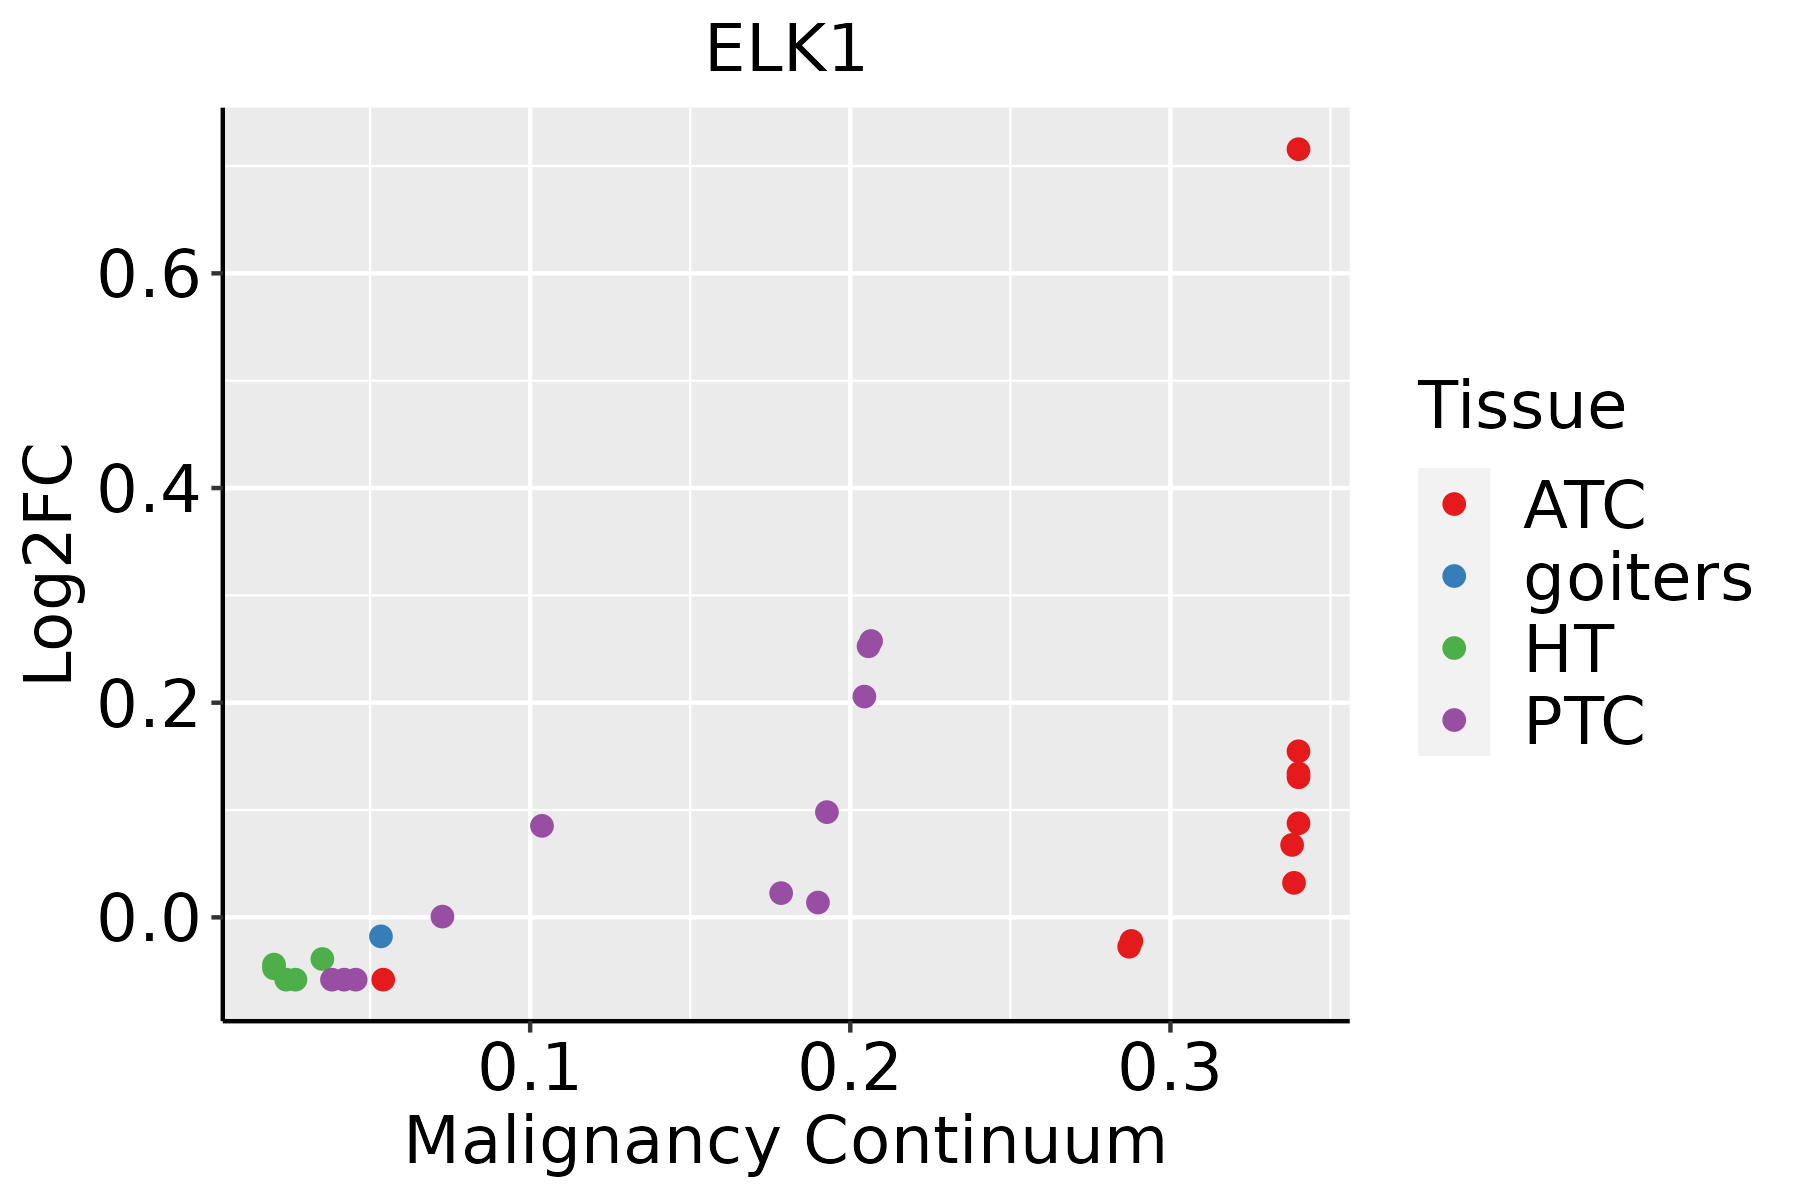 | ATC: Anaplastic thyroid cancer |
| HT: Hashimoto's thyroiditis | ||
| PTC: Papillary thyroid cancer |
| ∗log2FC in expression of this searched gene in stem-like cells from each diseased tissue sample relative to stem-like cells in normal samples in each tissue plotted against the malignancy continuum. Samples are colored based on if they are from different disease stage. |
Top |
Malignant transformation related pathway analysis |
| Find out the enriched GO biological processes and KEGG pathways involved in transition from healthy to precancer to cancer |
| Tissue | Disease Stage | Enriched GO biological Processes |
| Colorectum | AD |  |
| Colorectum | SER |  |
| Colorectum | MSS |  |
| Colorectum | MSI-H |  |
| Colorectum | FAP |  |
| ∗Top 15 enriched GO BP terms are showed in the bar plot of each disease state in each tissue. Each row represents a significant GO biological process which is colored according to the -log10(p.adjust). |
| Page: 1 2 3 4 5 6 7 8 9 |
| GO ID | Tissue | Disease Stage | Description | Gene Ratio | Bg Ratio | pvalue | p.adjust | Count |
| GO:00102128 | Oral cavity | OSCC | response to ionizing radiation | 99/7305 | 148/18723 | 5.49e-12 | 2.08e-10 | 99 |
| GO:007099720 | Oral cavity | OSCC | neuron death | 202/7305 | 361/18723 | 3.75e-11 | 1.23e-09 | 202 |
| GO:007121416 | Oral cavity | OSCC | cellular response to abiotic stimulus | 186/7305 | 331/18723 | 1.38e-10 | 4.10e-09 | 186 |
| GO:010400416 | Oral cavity | OSCC | cellular response to environmental stimulus | 186/7305 | 331/18723 | 1.38e-10 | 4.10e-09 | 186 |
| GO:000931416 | Oral cavity | OSCC | response to radiation | 241/7305 | 456/18723 | 9.76e-10 | 2.40e-08 | 241 |
| GO:190121420 | Oral cavity | OSCC | regulation of neuron death | 174/7305 | 319/18723 | 1.09e-08 | 2.23e-07 | 174 |
| GO:190165419 | Oral cavity | OSCC | response to ketone | 114/7305 | 194/18723 | 1.82e-08 | 3.60e-07 | 114 |
| GO:004873220 | Oral cavity | OSCC | gland development | 226/7305 | 436/18723 | 2.78e-08 | 5.39e-07 | 226 |
| GO:00714788 | Oral cavity | OSCC | cellular response to radiation | 109/7305 | 186/18723 | 4.54e-08 | 8.45e-07 | 109 |
| GO:190121620 | Oral cavity | OSCC | positive regulation of neuron death | 63/7305 | 97/18723 | 2.02e-07 | 3.25e-06 | 63 |
| GO:000188918 | Oral cavity | OSCC | liver development | 87/7305 | 147/18723 | 5.54e-07 | 8.08e-06 | 87 |
| GO:007147917 | Oral cavity | OSCC | cellular response to ionizing radiation | 49/7305 | 72/18723 | 5.59e-07 | 8.13e-06 | 49 |
| GO:006100818 | Oral cavity | OSCC | hepaticobiliary system development | 88/7305 | 150/18723 | 8.13e-07 | 1.12e-05 | 88 |
| GO:00094164 | Oral cavity | OSCC | response to light stimulus | 159/7305 | 320/18723 | 5.98e-05 | 4.92e-04 | 159 |
| GO:19016555 | Oral cavity | OSCC | cellular response to ketone | 56/7305 | 96/18723 | 9.61e-05 | 7.25e-04 | 56 |
| GO:00103326 | Oral cavity | OSCC | response to gamma radiation | 36/7305 | 56/18723 | 1.12e-04 | 8.24e-04 | 36 |
| GO:00303238 | Oral cavity | OSCC | respiratory tube development | 95/7305 | 181/18723 | 1.53e-04 | 1.07e-03 | 95 |
| GO:00303248 | Oral cavity | OSCC | lung development | 91/7305 | 177/18723 | 5.18e-04 | 3.01e-03 | 91 |
| GO:00335747 | Oral cavity | OSCC | response to testosterone | 27/7305 | 42/18723 | 8.00e-04 | 4.29e-03 | 27 |
| GO:00714809 | Oral cavity | OSCC | cellular response to gamma radiation | 21/7305 | 31/18723 | 1.13e-03 | 5.75e-03 | 21 |
| Page: 1 2 3 4 5 6 |
| Pathway ID | Tissue | Disease Stage | Description | Gene Ratio | Bg Ratio | pvalue | p.adjust | qvalue | Count |
| hsa05166211 | Esophagus | ESCC | Human T-cell leukemia virus 1 infection | 164/4205 | 222/8465 | 8.13e-14 | 2.09e-12 | 1.07e-12 | 164 |
| hsa0520529 | Esophagus | ESCC | Proteoglycans in cancer | 138/4205 | 205/8465 | 1.79e-07 | 1.40e-06 | 7.15e-07 | 138 |
| hsa05163210 | Esophagus | ESCC | Human cytomegalovirus infection | 148/4205 | 225/8465 | 5.73e-07 | 4.00e-06 | 2.05e-06 | 148 |
| hsa051619 | Esophagus | ESCC | Hepatitis B | 108/4205 | 162/8465 | 7.68e-06 | 4.15e-05 | 2.12e-05 | 108 |
| hsa0521320 | Esophagus | ESCC | Endometrial cancer | 45/4205 | 58/8465 | 1.14e-05 | 5.98e-05 | 3.06e-05 | 45 |
| hsa0522518 | Esophagus | ESCC | Hepatocellular carcinoma | 109/4205 | 168/8465 | 4.27e-05 | 1.88e-04 | 9.64e-05 | 109 |
| hsa0451020 | Esophagus | ESCC | Focal adhesion | 127/4205 | 203/8465 | 1.25e-04 | 4.99e-04 | 2.56e-04 | 127 |
| hsa049109 | Esophagus | ESCC | Insulin signaling pathway | 89/4205 | 137/8465 | 1.97e-04 | 7.32e-04 | 3.75e-04 | 89 |
| hsa0401218 | Esophagus | ESCC | ErbB signaling pathway | 56/4205 | 85/8465 | 1.78e-03 | 5.24e-03 | 2.68e-03 | 56 |
| hsa05166310 | Esophagus | ESCC | Human T-cell leukemia virus 1 infection | 164/4205 | 222/8465 | 8.13e-14 | 2.09e-12 | 1.07e-12 | 164 |
| hsa0520537 | Esophagus | ESCC | Proteoglycans in cancer | 138/4205 | 205/8465 | 1.79e-07 | 1.40e-06 | 7.15e-07 | 138 |
| hsa0516338 | Esophagus | ESCC | Human cytomegalovirus infection | 148/4205 | 225/8465 | 5.73e-07 | 4.00e-06 | 2.05e-06 | 148 |
| hsa0516114 | Esophagus | ESCC | Hepatitis B | 108/4205 | 162/8465 | 7.68e-06 | 4.15e-05 | 2.12e-05 | 108 |
| hsa05213110 | Esophagus | ESCC | Endometrial cancer | 45/4205 | 58/8465 | 1.14e-05 | 5.98e-05 | 3.06e-05 | 45 |
| hsa0522519 | Esophagus | ESCC | Hepatocellular carcinoma | 109/4205 | 168/8465 | 4.27e-05 | 1.88e-04 | 9.64e-05 | 109 |
| hsa04510111 | Esophagus | ESCC | Focal adhesion | 127/4205 | 203/8465 | 1.25e-04 | 4.99e-04 | 2.56e-04 | 127 |
| hsa0491014 | Esophagus | ESCC | Insulin signaling pathway | 89/4205 | 137/8465 | 1.97e-04 | 7.32e-04 | 3.75e-04 | 89 |
| hsa0401219 | Esophagus | ESCC | ErbB signaling pathway | 56/4205 | 85/8465 | 1.78e-03 | 5.24e-03 | 2.68e-03 | 56 |
| hsa0491041 | Liver | HCC | Insulin signaling pathway | 95/4020 | 137/8465 | 1.53e-07 | 1.97e-06 | 1.10e-06 | 95 |
| hsa0516622 | Liver | HCC | Human T-cell leukemia virus 1 infection | 139/4020 | 222/8465 | 3.17e-06 | 2.79e-05 | 1.55e-05 | 139 |
| Page: 1 2 3 4 |
Top |
Cell-cell communication analysis |
| Identification of potential cell-cell interactions between two cell types and their ligand-receptor pairs for different disease states |
| Ligand | Receptor | LRpair | Pathway | Tissue | Disease Stage |
| Page: 1 |
Top |
Single-cell gene regulatory network inference analysis |
| Find out the significant the regulons (TFs) and the target genes of each regulon across cell types for different disease states |
| TF | Cell Type | Tissue | Disease Stage | Target Gene | RSS | Regulon Activity |
| ELK1 | CD8TEXP | Esophagus | ADJ | TMC5,FAN1,GDNF, etc. | 5.01e-02 |  |
| ELK1 | CD8TEXP | Esophagus | ESCC | TMC5,FAN1,GDNF, etc. | 9.31e-02 |  |
| ELK1 | PLA | Esophagus | Healthy | TMC5,FAN1,GDNF, etc. | 7.35e-02 |  |
| ELK1 | CD8TEXINT | Oral cavity | NEOLP | HSPA6,VIM,AC026347.1, etc. | 1.70e-01 |  |
| ∗The dot plots of a searched regulon are shown for all cell subpopulations in each disease state of each tissue based on the regulon specific score inferred using pySCENIC and by calculating the average expression. |
| Page: 1 |
Top |
Somatic mutation of malignant transformation related genes |
| Annotation of somatic variants for genes involved in malignant transformation |
| Hugo Symbol | Variant Class | Variant Classification | dbSNP RS | HGVSc | HGVSp | HGVSp Short | SWISSPROT | BIOTYPE | SIFT | PolyPhen | Tumor Sample Barcode | Tissue | Histology | Sex | Age | Stage | Therapy Types | Drugs | Outcome |
| ELK1 | SNV | Missense_Mutation | novel | c.923N>G | p.Ser308Cys | p.S308C | P19419 | protein_coding | deleterious(0.02) | benign(0.054) | TCGA-A7-A26J-01 | Breast | breast invasive carcinoma | Female | <65 | I/II | Hormone Therapy | tamoxiphen | SD |
| ELK1 | SNV | Missense_Mutation | c.145N>T | p.Arg49Cys | p.R49C | P19419 | protein_coding | deleterious(0) | benign(0.2) | TCGA-BH-A0H9-01 | Breast | breast invasive carcinoma | Female | >=65 | I/II | Hormone Therapy | arimidex | SD | |
| ELK1 | SNV | Missense_Mutation | rs753575056 | c.581N>T | p.Ser194Leu | p.S194L | P19419 | protein_coding | tolerated(0.22) | benign(0) | TCGA-C8-A26Y-01 | Breast | breast invasive carcinoma | Female | >=65 | I/II | Unknown | Unknown | SD |
| ELK1 | SNV | Missense_Mutation | novel | c.1280N>G | p.Lys427Arg | p.K427R | P19419 | protein_coding | deleterious(0.01) | benign(0.283) | TCGA-D8-A1XK-01 | Breast | breast invasive carcinoma | Female | <65 | I/II | Chemotherapy | doxorubicine+cyclophosphamide | SD |
| ELK1 | SNV | Missense_Mutation | c.260N>G | p.Ser87Cys | p.S87C | P19419 | protein_coding | tolerated(0.07) | benign(0.362) | TCGA-E2-A14W-01 | Breast | breast invasive carcinoma | Male | >=65 | I/II | Chemotherapy | cytoxan | SD | |
| ELK1 | insertion | Frame_Shift_Ins | novel | c.1138_1139insCAGACTGGGTGACCAAAACCACATGTGAGAGACTACGTGGGCAT | p.Ser380ThrfsTer18 | p.S380Tfs*18 | P19419 | protein_coding | TCGA-AN-A04A-01 | Breast | breast invasive carcinoma | Female | <65 | III/IV | Unknown | Unknown | SD | ||
| ELK1 | SNV | Missense_Mutation | novel | c.1052N>T | p.Ala351Val | p.A351V | P19419 | protein_coding | deleterious(0.03) | possibly_damaging(0.493) | TCGA-2W-A8YY-01 | Cervix | cervical & endocervical cancer | Female | <65 | I/II | Chemotherapy | cisplatin | CR |
| ELK1 | SNV | Missense_Mutation | novel | c.902N>T | p.Ala301Val | p.A301V | P19419 | protein_coding | tolerated(0.35) | benign(0.054) | TCGA-2W-A8YY-01 | Cervix | cervical & endocervical cancer | Female | <65 | I/II | Chemotherapy | cisplatin | CR |
| ELK1 | SNV | Missense_Mutation | novel | c.172N>A | p.Asp58Asn | p.D58N | P19419 | protein_coding | deleterious(0) | probably_damaging(0.999) | TCGA-2W-A8YY-01 | Cervix | cervical & endocervical cancer | Female | <65 | I/II | Chemotherapy | cisplatin | CR |
| ELK1 | SNV | Missense_Mutation | c.1226N>T | p.Ser409Phe | p.S409F | P19419 | protein_coding | tolerated(0.13) | possibly_damaging(0.804) | TCGA-C5-A1BQ-01 | Cervix | cervical & endocervical cancer | Female | >=65 | III/IV | Chemotherapy | cisplatin | CR |
| Page: 1 2 3 4 |
Top |
Related drugs of malignant transformation related genes |
| Identification of chemicals and drugs interact with genes involved in malignant transfromation |
| (DGIdb 4.0) |
| Entrez ID | Symbol | Category | Interaction Types | Drug Claim Name | Drug Name | PMIDs |
| 2002 | ELK1 | TRANSCRIPTION FACTOR | DHPG | 12220559 |
| Page: 1 |

Copyright 2023-Present -The University of Texas Health Science Center at Houston |