
|
|||||
|
 | |
| |
| |
| |
| |
| |
|
Gene: EIF4G1 |
Gene summary for EIF4G1 |
| Gene information | Species | Human | Gene symbol | EIF4G1 | Gene ID | 1981 |
| Gene name | eukaryotic translation initiation factor 4 gamma 1 | |
| Gene Alias | EIF-4G1 | |
| Cytomap | 3q27.1 | |
| Gene Type | protein-coding | GO ID | GO:0000082 | UniProtAcc | B2RU06 |
Top |
Malignant transformation analysis |
| Identification of the aberrant gene expression in precancerous and cancerous lesions by comparing the gene expression of stem-like cells in diseased tissues with normal stem cells |
| Entrez ID | Symbol | Replicates | Species | Organ | Tissue | Adj P-value | Log2FC | Malignancy |
| 1981 | EIF4G1 | HTA11_3410_2000001011 | Human | Colorectum | AD | 3.72e-03 | 2.46e-01 | 0.0155 |
| 1981 | EIF4G1 | HTA11_2487_2000001011 | Human | Colorectum | SER | 3.80e-16 | 7.48e-01 | -0.1808 |
| 1981 | EIF4G1 | HTA11_1938_2000001011 | Human | Colorectum | AD | 2.43e-16 | 7.45e-01 | -0.0811 |
| 1981 | EIF4G1 | HTA11_78_2000001011 | Human | Colorectum | AD | 3.84e-08 | 4.62e-01 | -0.1088 |
| 1981 | EIF4G1 | HTA11_347_2000001011 | Human | Colorectum | AD | 2.03e-28 | 7.71e-01 | -0.1954 |
| 1981 | EIF4G1 | HTA11_411_2000001011 | Human | Colorectum | SER | 9.45e-06 | 9.53e-01 | -0.2602 |
| 1981 | EIF4G1 | HTA11_2112_2000001011 | Human | Colorectum | SER | 7.65e-03 | 7.39e-01 | -0.2196 |
| 1981 | EIF4G1 | HTA11_3361_2000001011 | Human | Colorectum | AD | 1.50e-03 | 4.61e-01 | -0.1207 |
| 1981 | EIF4G1 | HTA11_83_2000001011 | Human | Colorectum | SER | 9.81e-13 | 8.19e-01 | -0.1526 |
| 1981 | EIF4G1 | HTA11_696_2000001011 | Human | Colorectum | AD | 8.65e-31 | 9.44e-01 | -0.1464 |
| 1981 | EIF4G1 | HTA11_866_2000001011 | Human | Colorectum | AD | 2.23e-12 | 6.39e-01 | -0.1001 |
| 1981 | EIF4G1 | HTA11_1391_2000001011 | Human | Colorectum | AD | 9.40e-33 | 1.19e+00 | -0.059 |
| 1981 | EIF4G1 | HTA11_2992_2000001011 | Human | Colorectum | SER | 2.64e-04 | 6.38e-01 | -0.1706 |
| 1981 | EIF4G1 | HTA11_546_2000001011 | Human | Colorectum | AD | 3.34e-05 | 5.68e-01 | -0.0842 |
| 1981 | EIF4G1 | HTA11_7862_2000001011 | Human | Colorectum | AD | 4.61e-02 | 4.25e-01 | -0.0179 |
| 1981 | EIF4G1 | HTA11_866_3004761011 | Human | Colorectum | AD | 5.11e-30 | 9.23e-01 | 0.096 |
| 1981 | EIF4G1 | HTA11_4255_2000001011 | Human | Colorectum | SER | 2.97e-03 | 6.13e-01 | 0.0446 |
| 1981 | EIF4G1 | HTA11_8622_2000001021 | Human | Colorectum | SER | 1.44e-04 | 6.30e-01 | 0.0528 |
| 1981 | EIF4G1 | HTA11_7663_2000001011 | Human | Colorectum | SER | 2.23e-14 | 8.92e-01 | 0.0131 |
| 1981 | EIF4G1 | HTA11_10623_2000001011 | Human | Colorectum | AD | 1.03e-02 | 4.90e-01 | -0.0177 |
| Page: 1 2 3 4 5 6 7 8 9 10 |
| Tissue | Expression Dynamics | Abbreviation |
| Colorectum (GSE201348) | 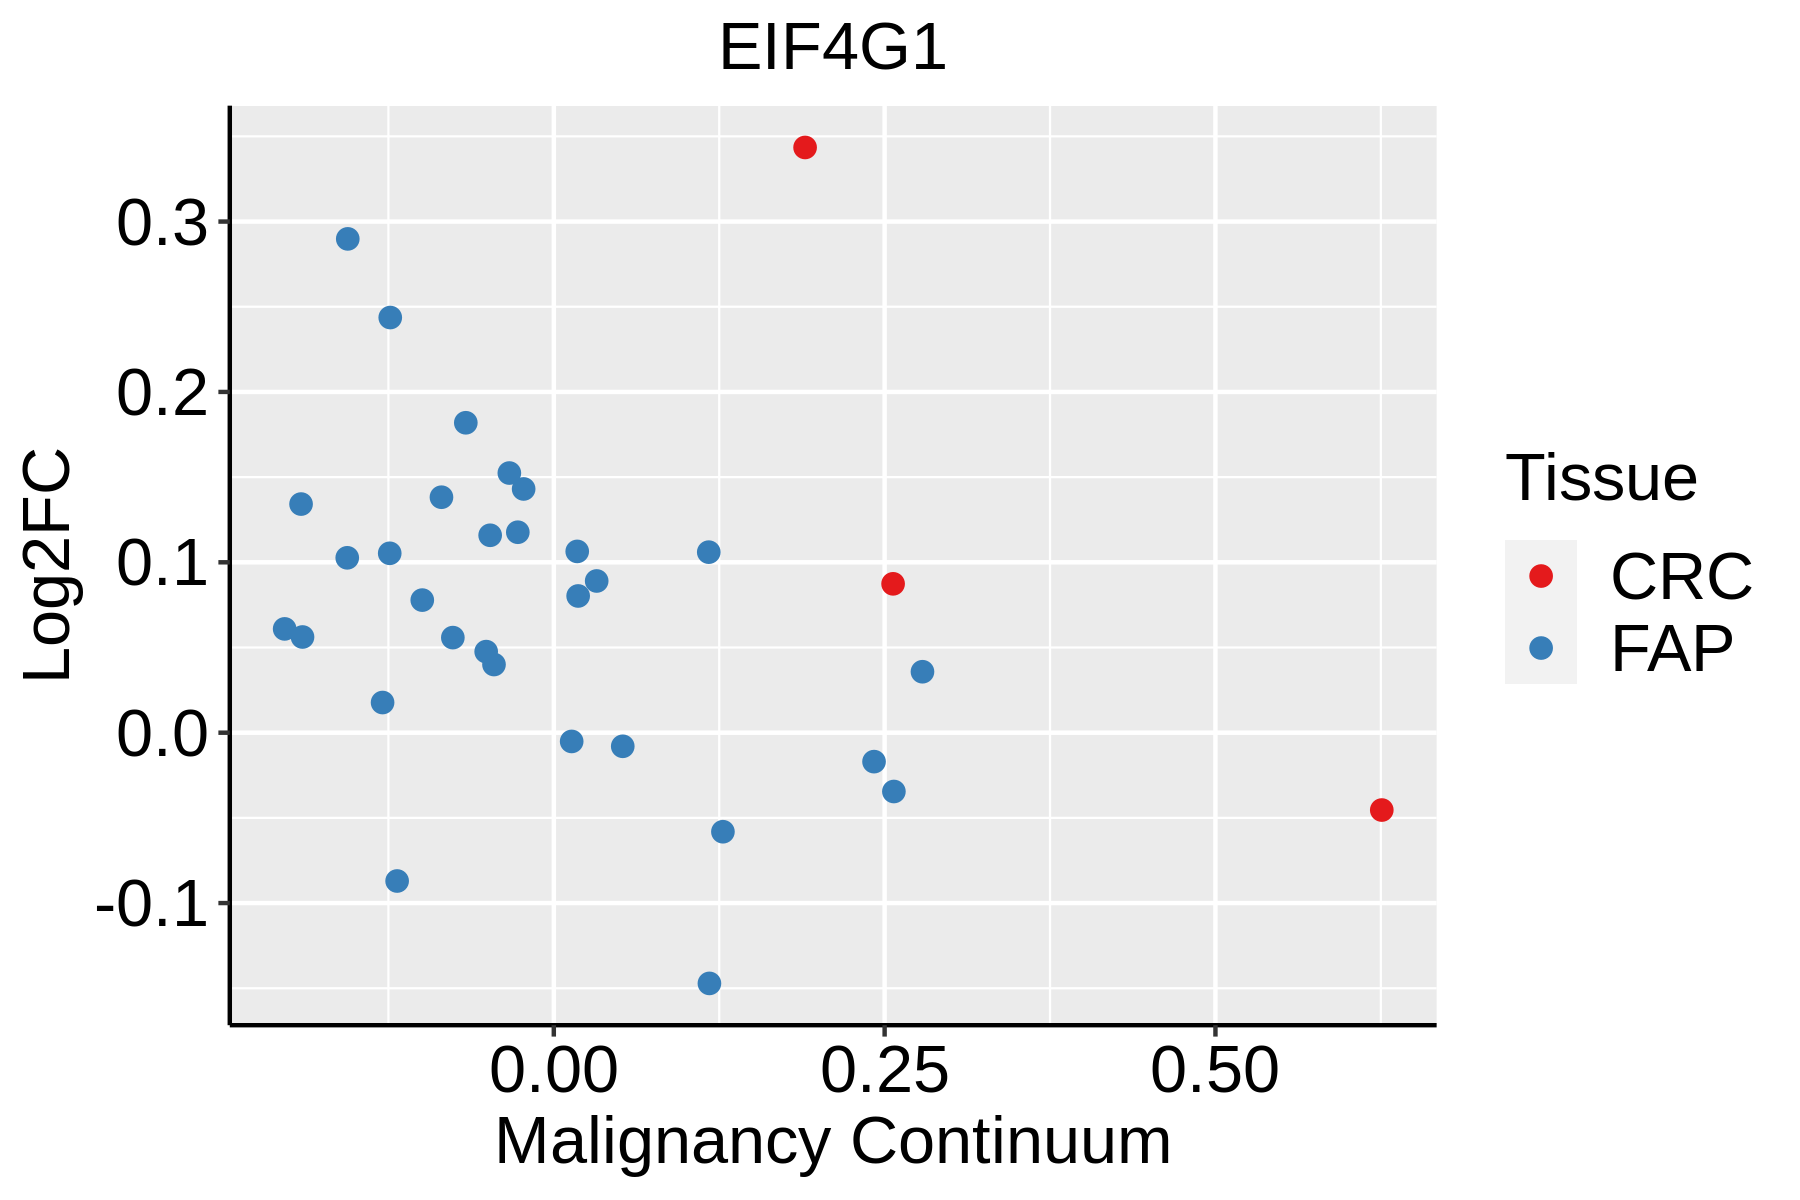 | FAP: Familial adenomatous polyposis |
| CRC: Colorectal cancer | ||
| Colorectum (HTA11) |  | AD: Adenomas |
| SER: Sessile serrated lesions | ||
| MSI-H: Microsatellite-high colorectal cancer | ||
| MSS: Microsatellite stable colorectal cancer | ||
| Esophagus | 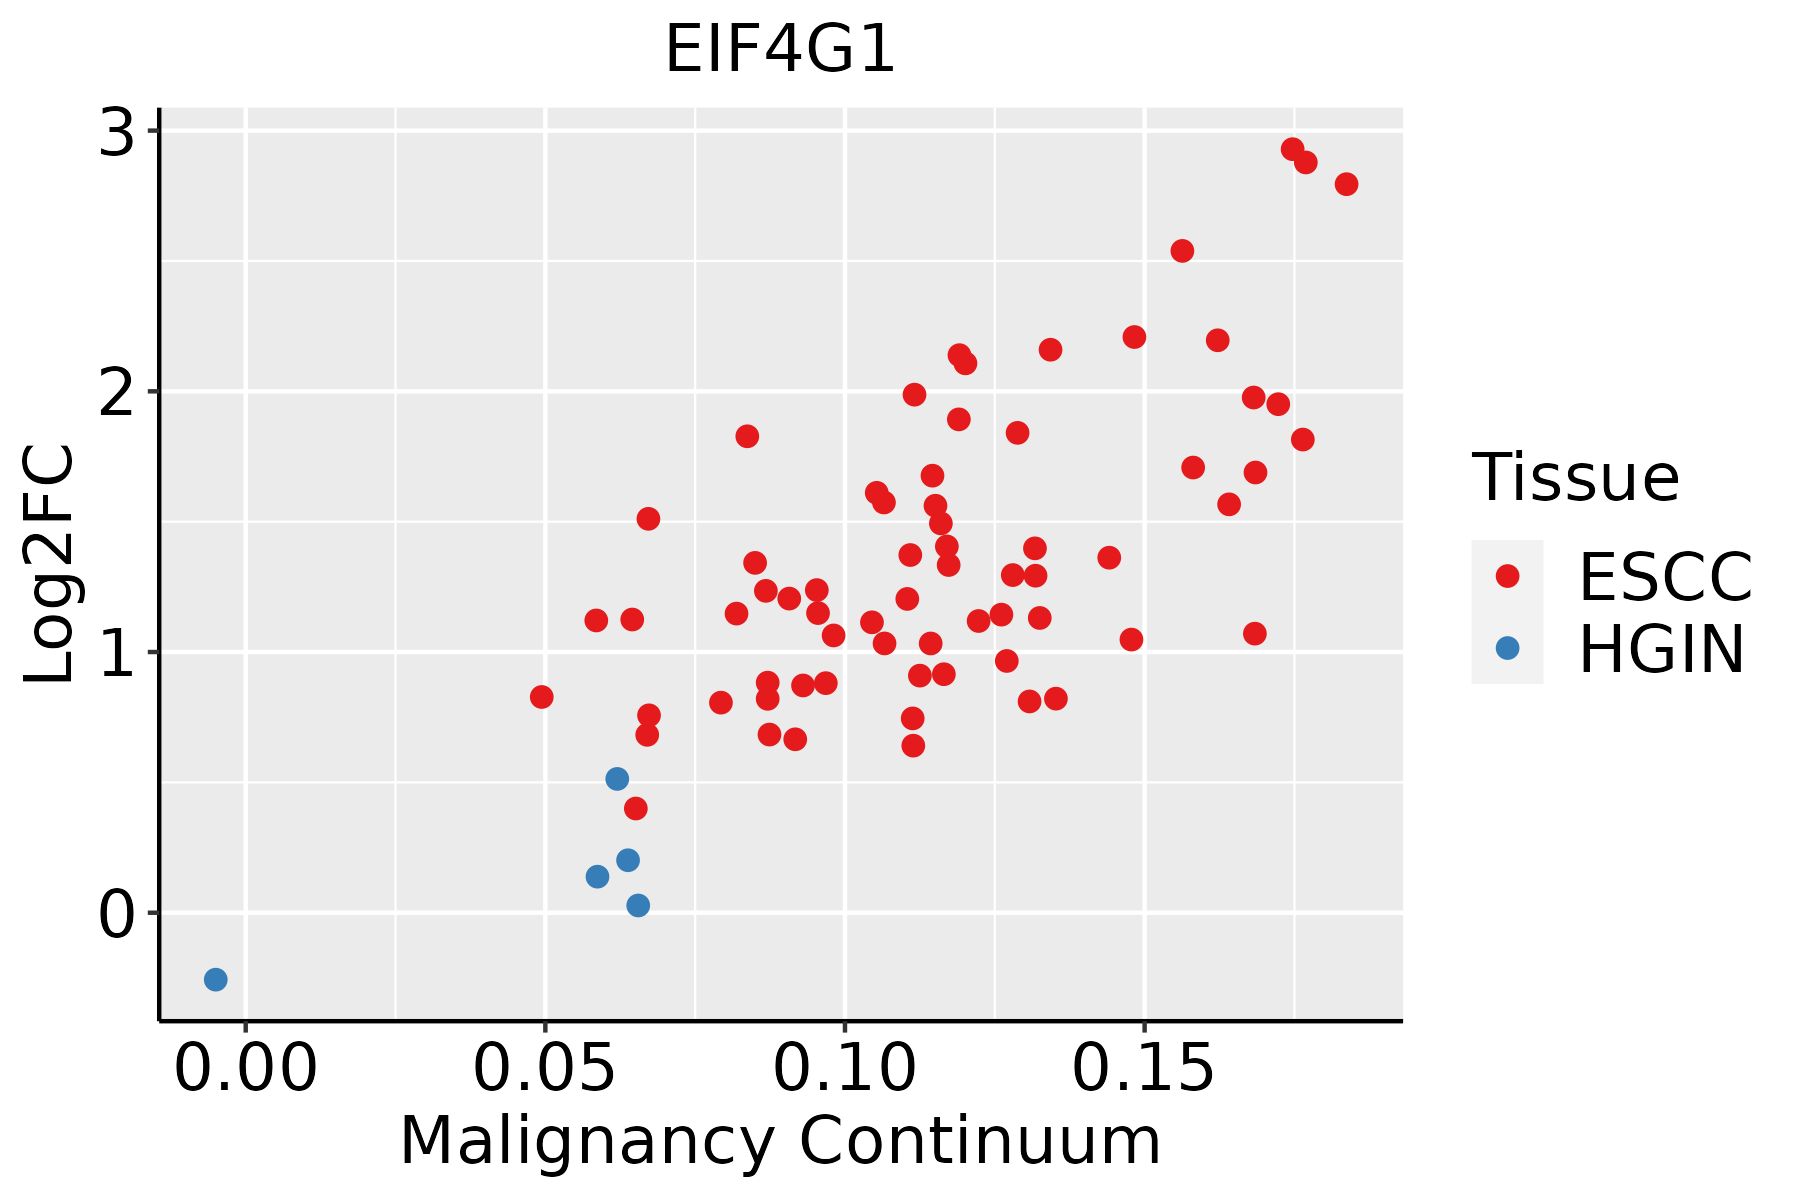 | ESCC: Esophageal squamous cell carcinoma |
| HGIN: High-grade intraepithelial neoplasias | ||
| LGIN: Low-grade intraepithelial neoplasias | ||
| Liver |  | HCC: Hepatocellular carcinoma |
| NAFLD: Non-alcoholic fatty liver disease | ||
| Oral Cavity | 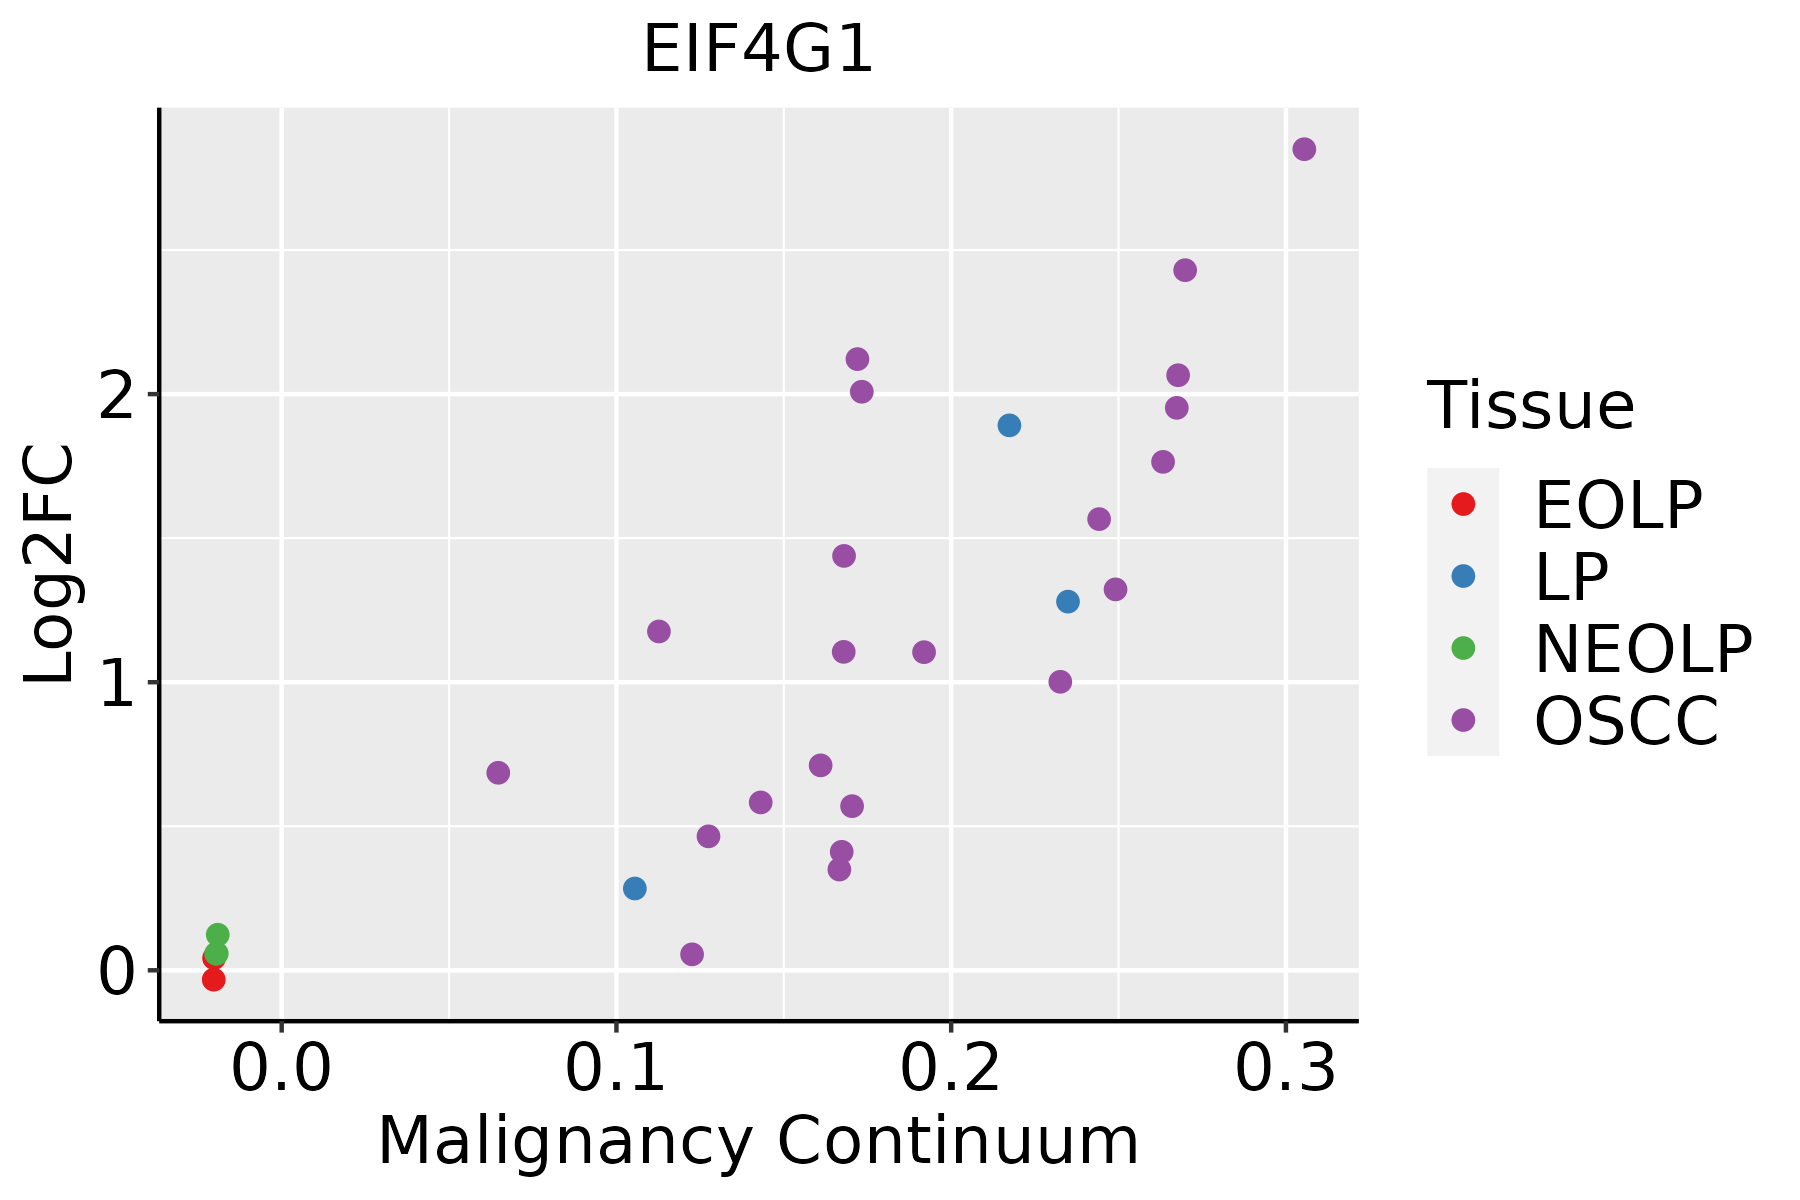 | EOLP: Erosive Oral lichen planus |
| LP: leukoplakia | ||
| NEOLP: Non-erosive oral lichen planus | ||
| OSCC: Oral squamous cell carcinoma | ||
| Prostate | 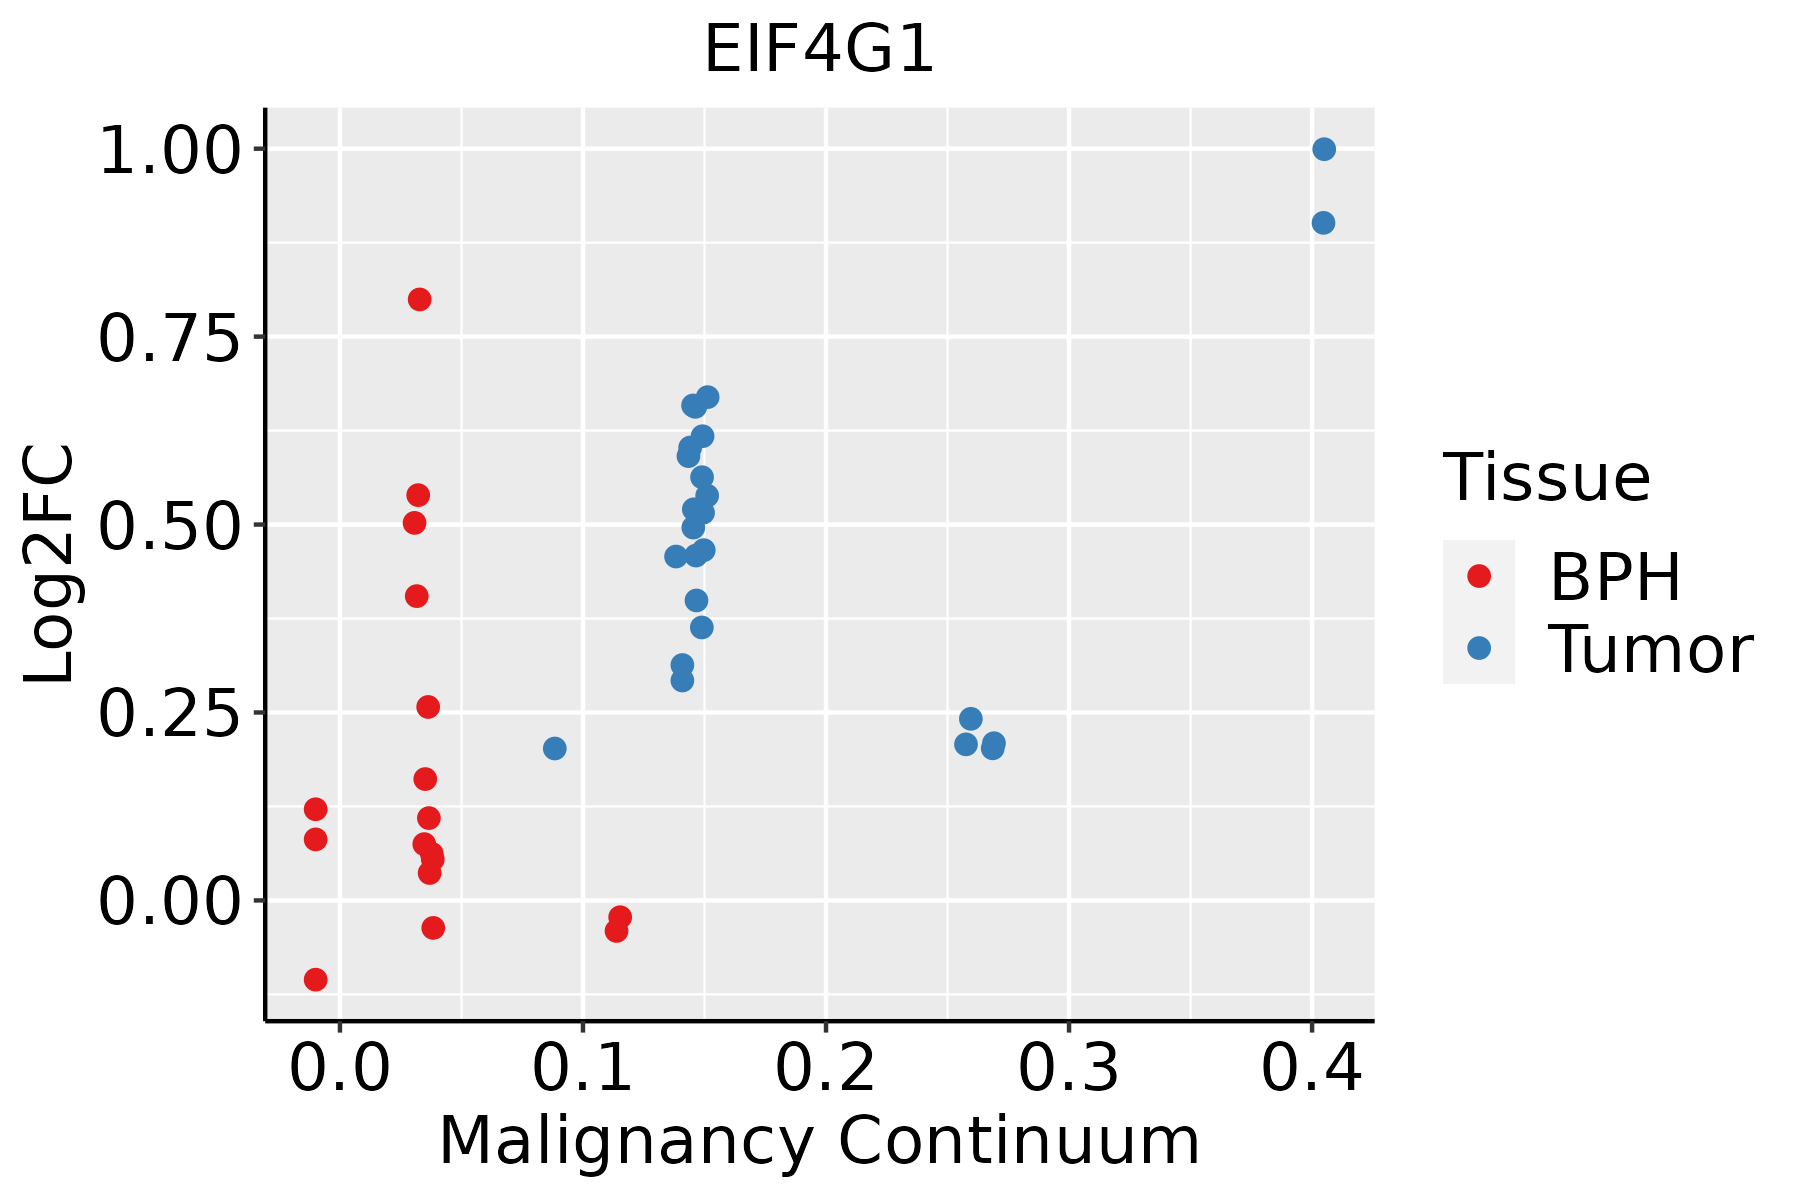 | BPH: Benign Prostatic Hyperplasia |
| Skin | 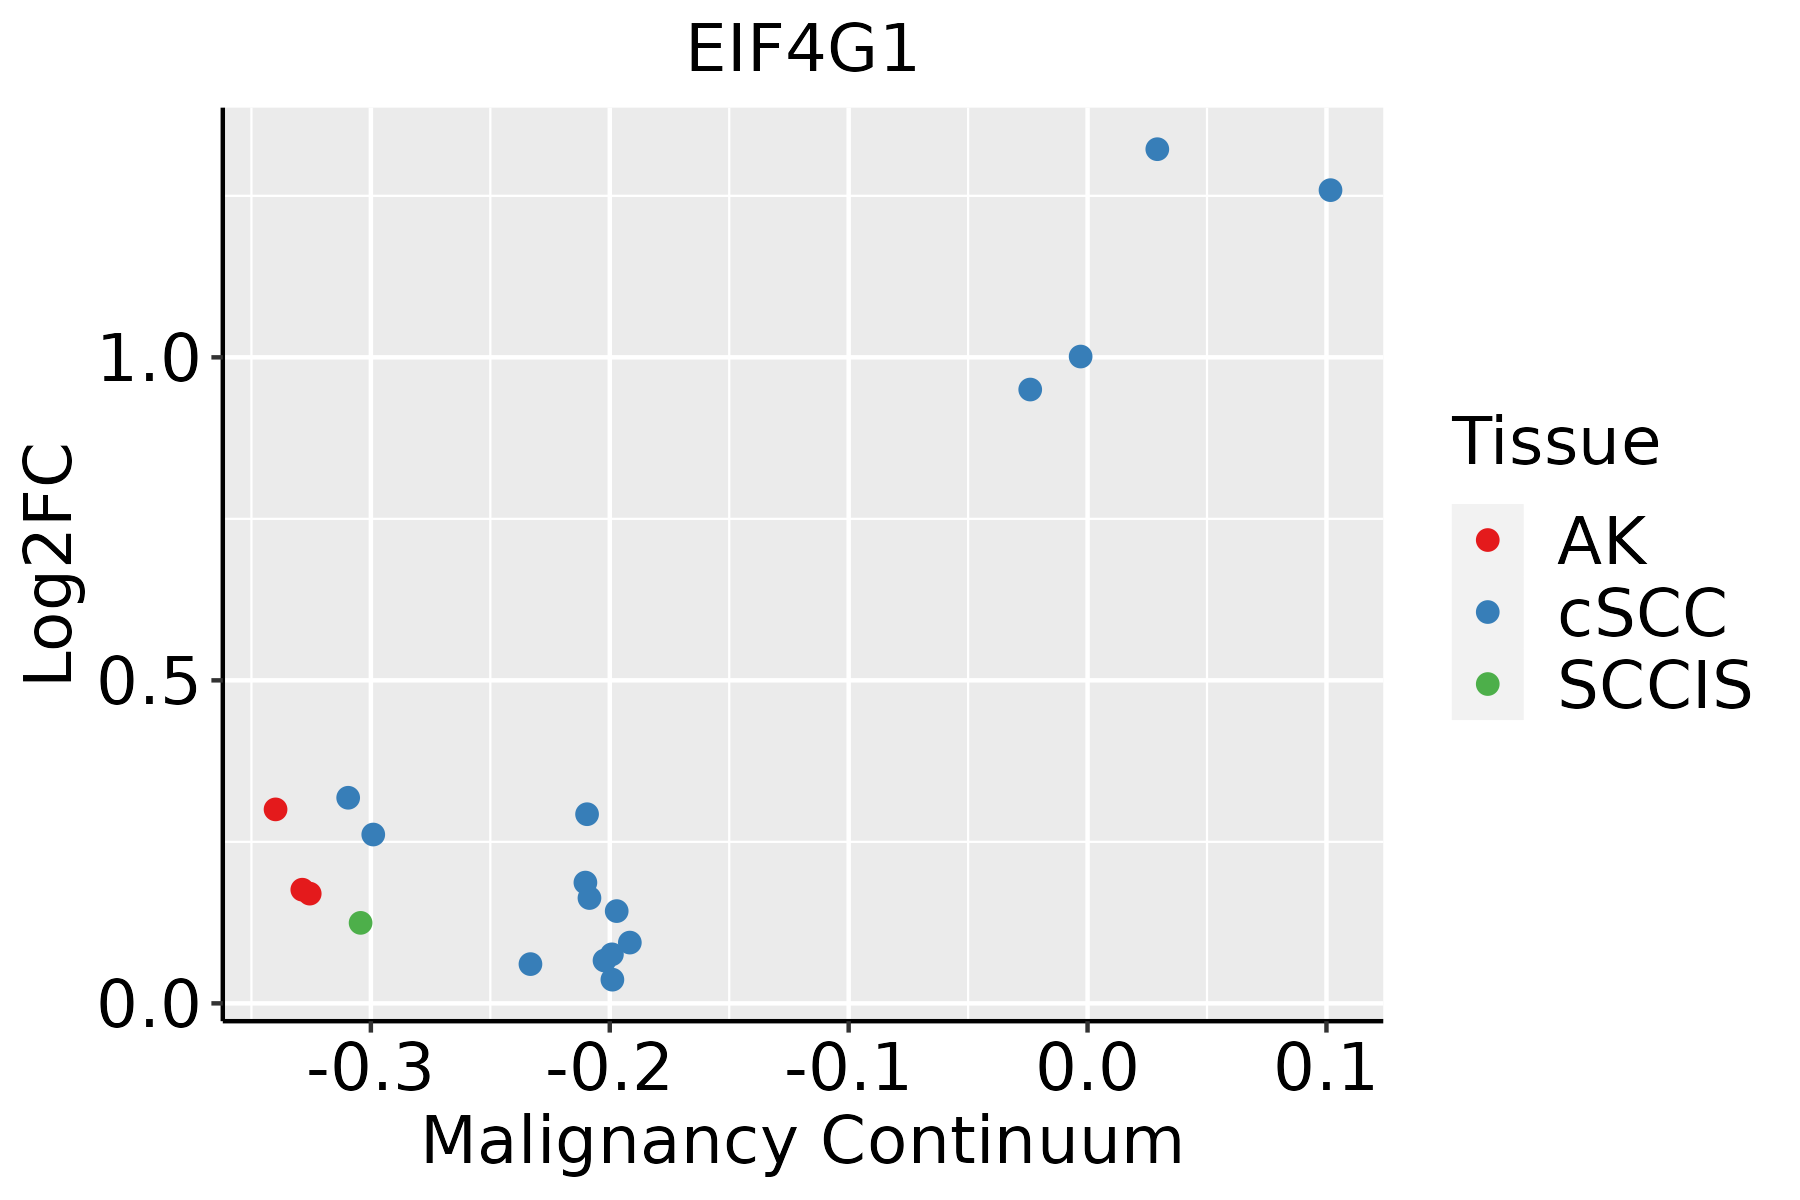 | AK: Actinic keratosis |
| cSCC: Cutaneous squamous cell carcinoma | ||
| SCCIS:squamous cell carcinoma in situ | ||
| Thyroid | 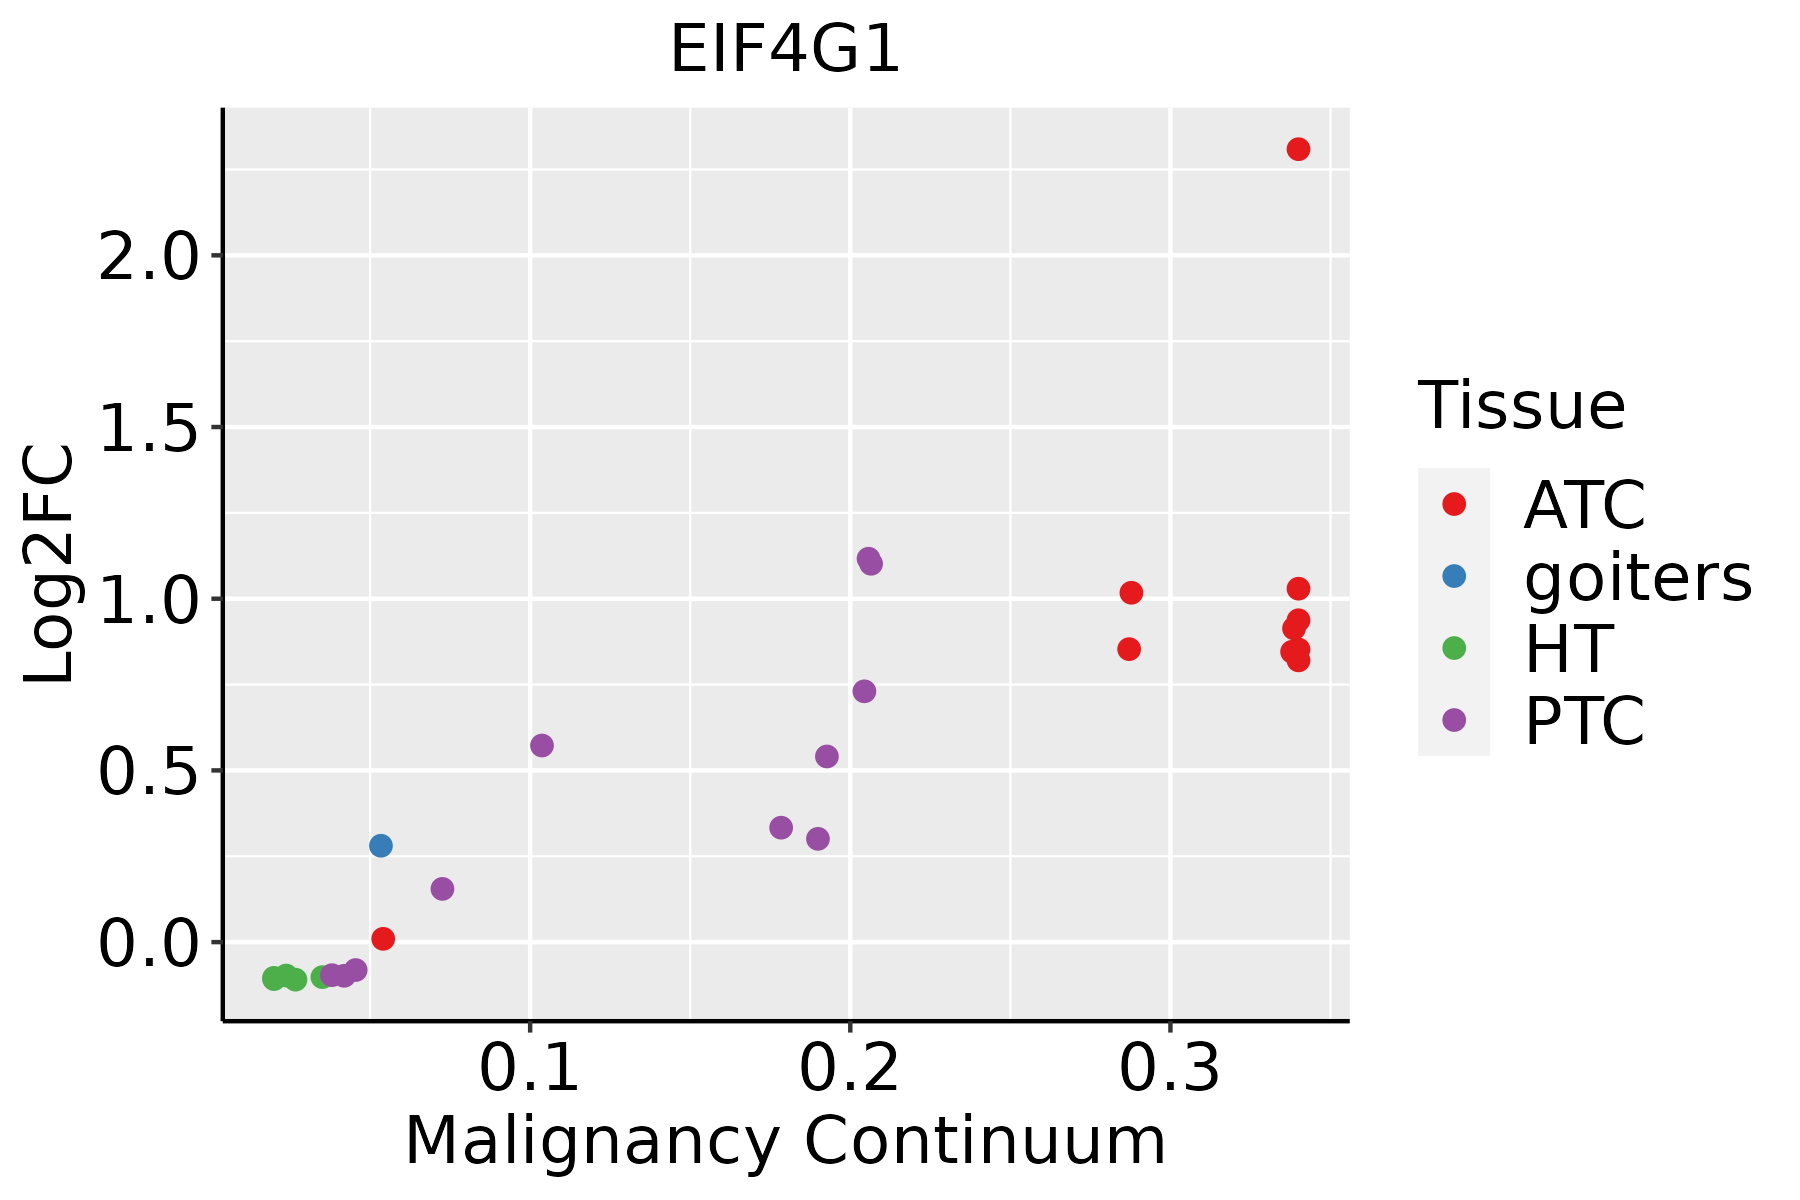 | ATC: Anaplastic thyroid cancer |
| HT: Hashimoto's thyroiditis | ||
| PTC: Papillary thyroid cancer |
| ∗log2FC in expression of this searched gene in stem-like cells from each diseased tissue sample relative to stem-like cells in normal samples in each tissue plotted against the malignancy continuum. Samples are colored based on if they are from different disease stage. |
Top |
Malignant transformation related pathway analysis |
| Find out the enriched GO biological processes and KEGG pathways involved in transition from healthy to precancer to cancer |
| Tissue | Disease Stage | Enriched GO biological Processes |
| Colorectum | AD |  |
| Colorectum | SER |  |
| Colorectum | MSS |  |
| Colorectum | MSI-H |  |
| Colorectum | FAP |  |
| ∗Top 15 enriched GO BP terms are showed in the bar plot of each disease state in each tissue. Each row represents a significant GO biological process which is colored according to the -log10(p.adjust). |
| Page: 1 2 3 4 5 6 7 8 9 |
| GO ID | Tissue | Disease Stage | Description | Gene Ratio | Bg Ratio | pvalue | p.adjust | Count |
| GO:0050807 | Colorectum | AD | regulation of synapse organization | 60/3918 | 211/18723 | 5.67e-03 | 3.64e-02 | 60 |
| GO:0060147 | Colorectum | AD | regulation of posttranscriptional gene silencing | 19/3918 | 52/18723 | 6.92e-03 | 4.26e-02 | 19 |
| GO:0045931 | Colorectum | AD | positive regulation of mitotic cell cycle | 37/3918 | 121/18723 | 7.88e-03 | 4.73e-02 | 37 |
| GO:0060964 | Colorectum | AD | regulation of gene silencing by miRNA | 18/3918 | 49/18723 | 7.93e-03 | 4.73e-02 | 18 |
| GO:00021811 | Colorectum | SER | cytoplasmic translation | 102/2897 | 148/18723 | 1.38e-48 | 8.49e-45 | 102 |
| GO:00432541 | Colorectum | SER | regulation of protein-containing complex assembly | 119/2897 | 428/18723 | 3.34e-11 | 5.86e-09 | 119 |
| GO:00313341 | Colorectum | SER | positive regulation of protein-containing complex assembly | 73/2897 | 237/18723 | 1.89e-09 | 1.84e-07 | 73 |
| GO:00510981 | Colorectum | SER | regulation of binding | 97/2897 | 363/18723 | 1.98e-08 | 1.43e-06 | 97 |
| GO:00349761 | Colorectum | SER | response to endoplasmic reticulum stress | 74/2897 | 256/18723 | 3.01e-08 | 2.05e-06 | 74 |
| GO:00098951 | Colorectum | SER | negative regulation of catabolic process | 84/2897 | 320/18723 | 3.93e-07 | 2.06e-05 | 84 |
| GO:00021831 | Colorectum | SER | cytoplasmic translational initiation | 18/2897 | 34/18723 | 4.42e-07 | 2.24e-05 | 18 |
| GO:00313301 | Colorectum | SER | negative regulation of cellular catabolic process | 70/2897 | 262/18723 | 1.79e-06 | 7.70e-05 | 70 |
| GO:00343291 | Colorectum | SER | cell junction assembly | 100/2897 | 420/18723 | 4.23e-06 | 1.61e-04 | 100 |
| GO:00105631 | Colorectum | SER | negative regulation of phosphorus metabolic process | 101/2897 | 442/18723 | 2.39e-05 | 6.70e-04 | 101 |
| GO:00064131 | Colorectum | SER | translational initiation | 36/2897 | 118/18723 | 2.84e-05 | 7.63e-04 | 36 |
| GO:00459361 | Colorectum | SER | negative regulation of phosphate metabolic process | 100/2897 | 441/18723 | 3.62e-05 | 9.39e-04 | 100 |
| GO:00316671 | Colorectum | SER | response to nutrient levels | 106/2897 | 474/18723 | 3.94e-05 | 1.00e-03 | 106 |
| GO:00709971 | Colorectum | SER | neuron death | 84/2897 | 361/18723 | 5.76e-05 | 1.35e-03 | 84 |
| GO:00510991 | Colorectum | SER | positive regulation of binding | 46/2897 | 173/18723 | 1.12e-04 | 2.34e-03 | 46 |
| GO:00019331 | Colorectum | SER | negative regulation of protein phosphorylation | 79/2897 | 342/18723 | 1.21e-04 | 2.49e-03 | 79 |
| Page: 1 2 3 4 5 6 7 8 9 10 11 12 13 14 15 16 17 18 19 20 21 22 23 24 25 26 27 28 29 30 31 32 33 34 35 36 37 38 39 40 41 42 43 44 45 46 47 48 49 50 51 |
| Pathway ID | Tissue | Disease Stage | Description | Gene Ratio | Bg Ratio | pvalue | p.adjust | qvalue | Count |
| hsa05416 | Colorectum | MSI-H | Viral myocarditis | 14/797 | 60/8465 | 1.09e-03 | 1.20e-02 | 1.01e-02 | 14 |
| hsa054161 | Colorectum | MSI-H | Viral myocarditis | 14/797 | 60/8465 | 1.09e-03 | 1.20e-02 | 1.01e-02 | 14 |
| hsa0541630 | Esophagus | ESCC | Viral myocarditis | 41/4205 | 60/8465 | 2.59e-03 | 7.05e-03 | 3.61e-03 | 41 |
| hsa05416114 | Esophagus | ESCC | Viral myocarditis | 41/4205 | 60/8465 | 2.59e-03 | 7.05e-03 | 3.61e-03 | 41 |
| hsa0541614 | Liver | Cirrhotic | Viral myocarditis | 28/2530 | 60/8465 | 4.38e-03 | 1.68e-02 | 1.03e-02 | 28 |
| hsa0541615 | Liver | Cirrhotic | Viral myocarditis | 28/2530 | 60/8465 | 4.38e-03 | 1.68e-02 | 1.03e-02 | 28 |
| hsa0541629 | Oral cavity | OSCC | Viral myocarditis | 39/3704 | 60/8465 | 7.13e-04 | 2.09e-03 | 1.07e-03 | 39 |
| hsa05416113 | Oral cavity | OSCC | Viral myocarditis | 39/3704 | 60/8465 | 7.13e-04 | 2.09e-03 | 1.07e-03 | 39 |
| hsa05416210 | Oral cavity | LP | Viral myocarditis | 32/2418 | 60/8465 | 4.55e-05 | 2.91e-04 | 1.88e-04 | 32 |
| hsa0541637 | Oral cavity | LP | Viral myocarditis | 32/2418 | 60/8465 | 4.55e-05 | 2.91e-04 | 1.88e-04 | 32 |
| hsa0541662 | Oral cavity | NEOLP | Viral myocarditis | 17/1112 | 60/8465 | 1.38e-03 | 6.45e-03 | 4.06e-03 | 17 |
| hsa0541672 | Oral cavity | NEOLP | Viral myocarditis | 17/1112 | 60/8465 | 1.38e-03 | 6.45e-03 | 4.06e-03 | 17 |
| hsa0541627 | Prostate | BPH | Viral myocarditis | 23/1718 | 60/8465 | 9.59e-04 | 4.47e-03 | 2.76e-03 | 23 |
| hsa05416112 | Prostate | BPH | Viral myocarditis | 23/1718 | 60/8465 | 9.59e-04 | 4.47e-03 | 2.76e-03 | 23 |
| hsa0541628 | Prostate | Tumor | Viral myocarditis | 24/1791 | 60/8465 | 6.83e-04 | 3.33e-03 | 2.06e-03 | 24 |
| hsa0541636 | Prostate | Tumor | Viral myocarditis | 24/1791 | 60/8465 | 6.83e-04 | 3.33e-03 | 2.06e-03 | 24 |
| Page: 1 |
Top |
Cell-cell communication analysis |
| Identification of potential cell-cell interactions between two cell types and their ligand-receptor pairs for different disease states |
| Ligand | Receptor | LRpair | Pathway | Tissue | Disease Stage |
| Page: 1 |
Top |
Single-cell gene regulatory network inference analysis |
| Find out the significant the regulons (TFs) and the target genes of each regulon across cell types for different disease states |
| TF | Cell Type | Tissue | Disease Stage | Target Gene | RSS | Regulon Activity |
| ∗The dot plots of a searched regulon are shown for all cell subpopulations in each disease state of each tissue based on the regulon specific score inferred using pySCENIC and by calculating the average expression. |
| Page: 1 |
Top |
Somatic mutation of malignant transformation related genes |
| Annotation of somatic variants for genes involved in malignant transformation |
| Hugo Symbol | Variant Class | Variant Classification | dbSNP RS | HGVSc | HGVSp | HGVSp Short | SWISSPROT | BIOTYPE | SIFT | PolyPhen | Tumor Sample Barcode | Tissue | Histology | Sex | Age | Stage | Therapy Types | Drugs | Outcome |
| EIF4G1 | SNV | Missense_Mutation | novel | c.4172N>A | p.Cys1391Tyr | p.C1391Y | Q04637 | protein_coding | deleterious(0) | probably_damaging(0.999) | TCGA-A7-A0CG-01 | Breast | breast invasive carcinoma | Female | >=65 | I/II | Unknown | Unknown | SD |
| EIF4G1 | SNV | Missense_Mutation | c.184C>T | p.Arg62Trp | p.R62W | Q04637 | protein_coding | deleterious(0) | possibly_damaging(0.609) | TCGA-A7-A13E-01 | Breast | breast invasive carcinoma | Female | <65 | I/II | Targeted Molecular therapy | bevacizumab | PD | |
| EIF4G1 | SNV | Missense_Mutation | c.2188N>A | p.Glu730Lys | p.E730K | Q04637 | protein_coding | deleterious(0.01) | possibly_damaging(0.905) | TCGA-AN-A046-01 | Breast | breast invasive carcinoma | Female | >=65 | I/II | Unknown | Unknown | SD | |
| EIF4G1 | SNV | Missense_Mutation | c.2701N>T | p.Arg901Cys | p.R901C | Q04637 | protein_coding | deleterious(0.01) | benign(0.344) | TCGA-BH-A0B3-01 | Breast | breast invasive carcinoma | Female | <65 | I/II | Chemotherapy | cyclophosphamide | SD | |
| EIF4G1 | SNV | Missense_Mutation | novel | c.364N>T | p.Val122Phe | p.V122F | Q04637 | protein_coding | deleterious(0.04) | possibly_damaging(0.862) | TCGA-BH-A0HL-01 | Breast | breast invasive carcinoma | Female | <65 | I/II | Chemotherapy | cyclophosphamide | SD |
| EIF4G1 | SNV | Missense_Mutation | rs571849011 | c.197C>T | p.Pro66Leu | p.P66L | Q04637 | protein_coding | deleterious(0) | benign(0.098) | TCGA-BH-A18U-01 | Breast | breast invasive carcinoma | Female | >=65 | III/IV | Unknown | Unknown | SD |
| EIF4G1 | SNV | Missense_Mutation | c.1457N>T | p.Gly486Val | p.G486V | Q04637 | protein_coding | tolerated(0.31) | probably_damaging(0.942) | TCGA-D8-A27G-01 | Breast | breast invasive carcinoma | Female | >=65 | I/II | Unknown | Unknown | SD | |
| EIF4G1 | SNV | Missense_Mutation | rs73053766 | c.3791A>G | p.Asn1264Ser | p.N1264S | Q04637 | protein_coding | deleterious(0.05) | benign(0.076) | TCGA-LD-A74U-01 | Breast | breast invasive carcinoma | Female | >=65 | III/IV | Chemotherapy | taxotere | SD |
| EIF4G1 | insertion | Frame_Shift_Ins | novel | c.3123_3124insGTTAA | p.Pro1042ValfsTer59 | p.P1042Vfs*59 | Q04637 | protein_coding | TCGA-A8-A093-01 | Breast | breast invasive carcinoma | Female | <65 | I/II | Hormone Therapy | tamoxiphen | SD | ||
| EIF4G1 | insertion | Nonsense_Mutation | novel | c.3124_3125insAGAGGCAATAATGCATGA | p.Pro1042delinsGlnArgGlnTerCysMetThr | p.P1042delinsQRQ*CMT | Q04637 | protein_coding | TCGA-A8-A093-01 | Breast | breast invasive carcinoma | Female | <65 | I/II | Hormone Therapy | tamoxiphen | SD |
| Page: 1 2 3 4 5 6 7 8 9 10 11 12 13 14 15 16 17 18 19 |
Top |
Related drugs of malignant transformation related genes |
| Identification of chemicals and drugs interact with genes involved in malignant transfromation |
| (DGIdb 4.0) |
| Entrez ID | Symbol | Category | Interaction Types | Drug Claim Name | Drug Name | PMIDs |
| 1981 | EIF4G1 | NA | INSULIN | INSULIN | 8521827 |
| Page: 1 |

Copyright 2023-Present -The University of Texas Health Science Center at Houston |