Schematic overview of the cellular and molecular mechanisms involved in the cancer progression, including the proposed cellular and molecular mechanisms in cancer cells trajectory. AT1: alveolar type 1 cells; AT2: alveolar type 2 cells; AAH: atypical adenomatous hyperplasia; AIS: adenocarcinoma in situ; MIA: minimally invasive adenocarcinoma; IA: invasive adenocarcinoma; EMT: epithelial-mesenchymal transition

Home

Download

Statistics

Help

Contact

Center for Computational Systems Medicine
leaf

Gene summary

leaf

Malignant transformation analysis

leaf

Malignant transformation related pathway analysis

leaf

Cell-cell communication analysis

leaf

Single-cell gene regulatory network inference analysis

leaf

Somatic mutation of malignant transformation related genes

leaf

Related drugs of malignant transformation related genes

Gene: EIF4A2

Gene summary for EIF4A2

check button Gene summary.

Gene informationSpeciesHuman
Gene symbol

EIF4A2

Gene ID

1974

Gene nameeukaryotic translation initiation factor 4A2
Gene AliasBM-010
Cytomap3q27.3
Gene Typeprotein-coding
GO ID

GO:0002181

UniProtAcc

Q14240


Top

Malignant transformation analysis

check button Identification of the aberrant gene expression in precancerous and cancerous lesions by comparing the gene expression of stem-like cells in diseased tissues with normal stem cells
check button Malignant transformation involving gene list.
Entrez IDSymbolReplicatesSpeciesOrganTissueAdj P-valueLog2FCMalignancy
1974EIF4A2GSM4909277HumanBreastPrecancer3.86e-023.20e-010.0177
1974EIF4A2GSM4909285HumanBreastIDC2.54e-163.96e-010.21
1974EIF4A2GSM4909286HumanBreastIDC2.80e-08-4.46e-020.1081
1974EIF4A2GSM4909287HumanBreastIDC6.59e-07-3.59e-010.2057
1974EIF4A2GSM4909288HumanBreastIDC7.57e-07-5.61e-010.0988
1974EIF4A2GSM4909290HumanBreastIDC3.11e-13-4.83e-010.2096
1974EIF4A2GSM4909291HumanBreastIDC1.49e-12-5.69e-010.1753
1974EIF4A2GSM4909294HumanBreastIDC3.09e-10-4.54e-010.2022
1974EIF4A2GSM4909296HumanBreastIDC1.43e-52-9.30e-010.1524
1974EIF4A2GSM4909297HumanBreastIDC3.74e-307.95e-020.1517
1974EIF4A2GSM4909298HumanBreastIDC4.57e-12-2.75e-010.1551
1974EIF4A2GSM4909301HumanBreastIDC4.86e-23-6.29e-010.1577
1974EIF4A2GSM4909302HumanBreastIDC3.18e-08-3.73e-010.1545
1974EIF4A2GSM4909304HumanBreastIDC1.00e-06-2.79e-010.1636
1974EIF4A2GSM4909306HumanBreastIDC6.35e-06-2.45e-010.1564
1974EIF4A2GSM4909307HumanBreastIDC6.37e-09-3.99e-010.1569
1974EIF4A2GSM4909309HumanBreastIDC2.15e-10-4.15e-010.0483
1974EIF4A2GSM4909311HumanBreastIDC7.60e-59-8.43e-010.1534
1974EIF4A2GSM4909312HumanBreastIDC1.19e-07-1.63e-010.1552
1974EIF4A2GSM4909313HumanBreastIDC7.43e-05-1.29e-010.0391
Page: 1 2 3 4 5 6 7 8 9 10 11 12 13 14 15 

check button Transcriptomic changes along malignancy continuum.
TissueExpression DynamicsAbbreviation
BreastThe image shows the transcriptomic changes along malignancy continuum.log2FC in expression of this searched gene in stem-like cells from each diseased tissue sample relative to stem-like cells in normal samples in each tissue plotted against the malignancy continuum. Samples are colored based on if they are from different disease stage.
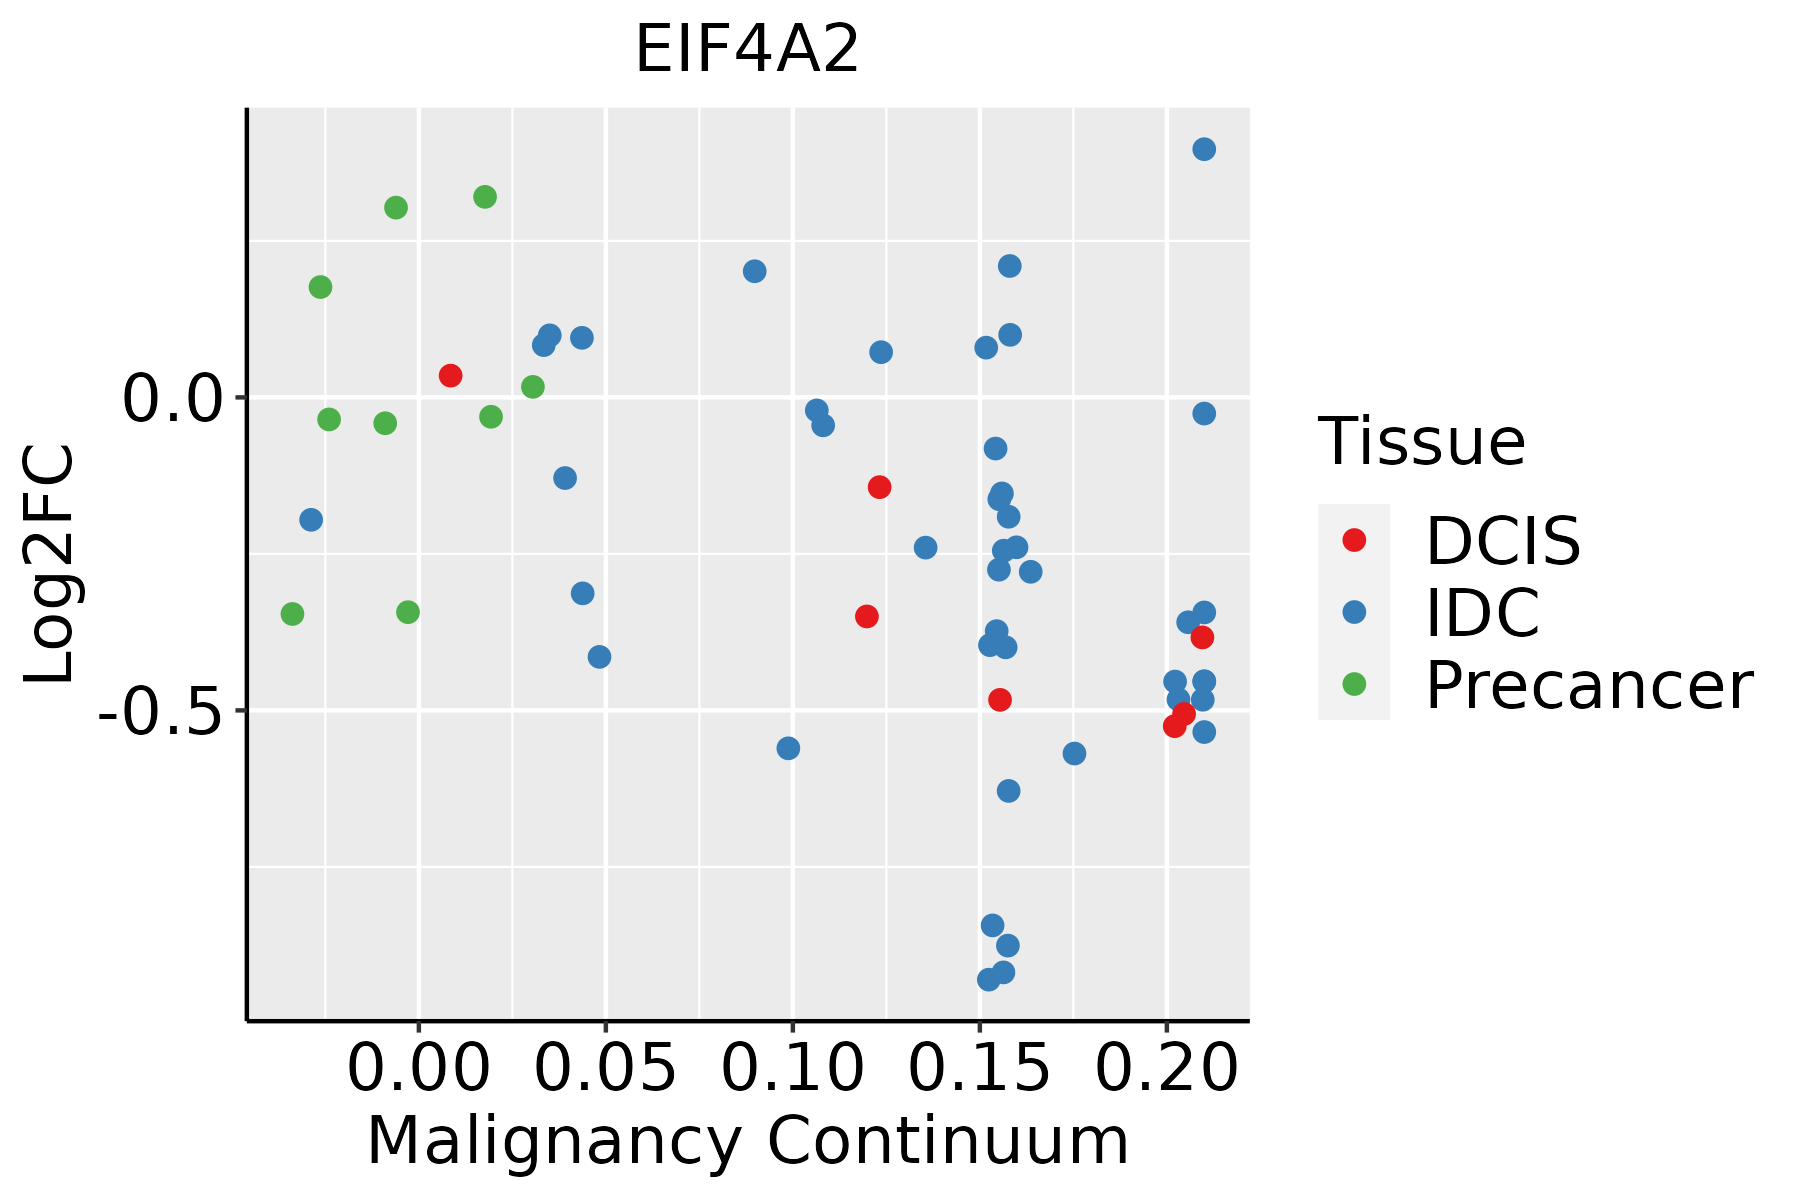
IDC: Invasive ductal carcinoma
DCIS: Ductal carcinoma in situ
Precancer(BRCA1-mut): Precancerous lesion from BRCA1 mutation carriers
Colorectum (GSE201348)The image shows the transcriptomic changes along malignancy continuum.log2FC in expression of this searched gene in stem-like cells from each diseased tissue sample relative to stem-like cells in normal samples in each tissue plotted against the malignancy continuum. Samples are colored based on if they are from different disease stage.FAP: Familial adenomatous polyposis
CRC: Colorectal cancer
Colorectum (HTA11)The image shows the transcriptomic changes along malignancy continuum.log2FC in expression of this searched gene in stem-like cells from each diseased tissue sample relative to stem-like cells in normal samples in each tissue plotted against the malignancy continuum. Samples are colored based on if they are from different disease stage.AD: Adenomas
SER: Sessile serrated lesions
MSI-H: Microsatellite-high colorectal cancer
MSS: Microsatellite stable colorectal cancer
EndometriumThe image shows the transcriptomic changes along malignancy continuum.log2FC in expression of this searched gene in stem-like cells from each diseased tissue sample relative to stem-like cells in normal samples in each tissue plotted against the malignancy continuum. Samples are colored based on if they are from different disease stage.
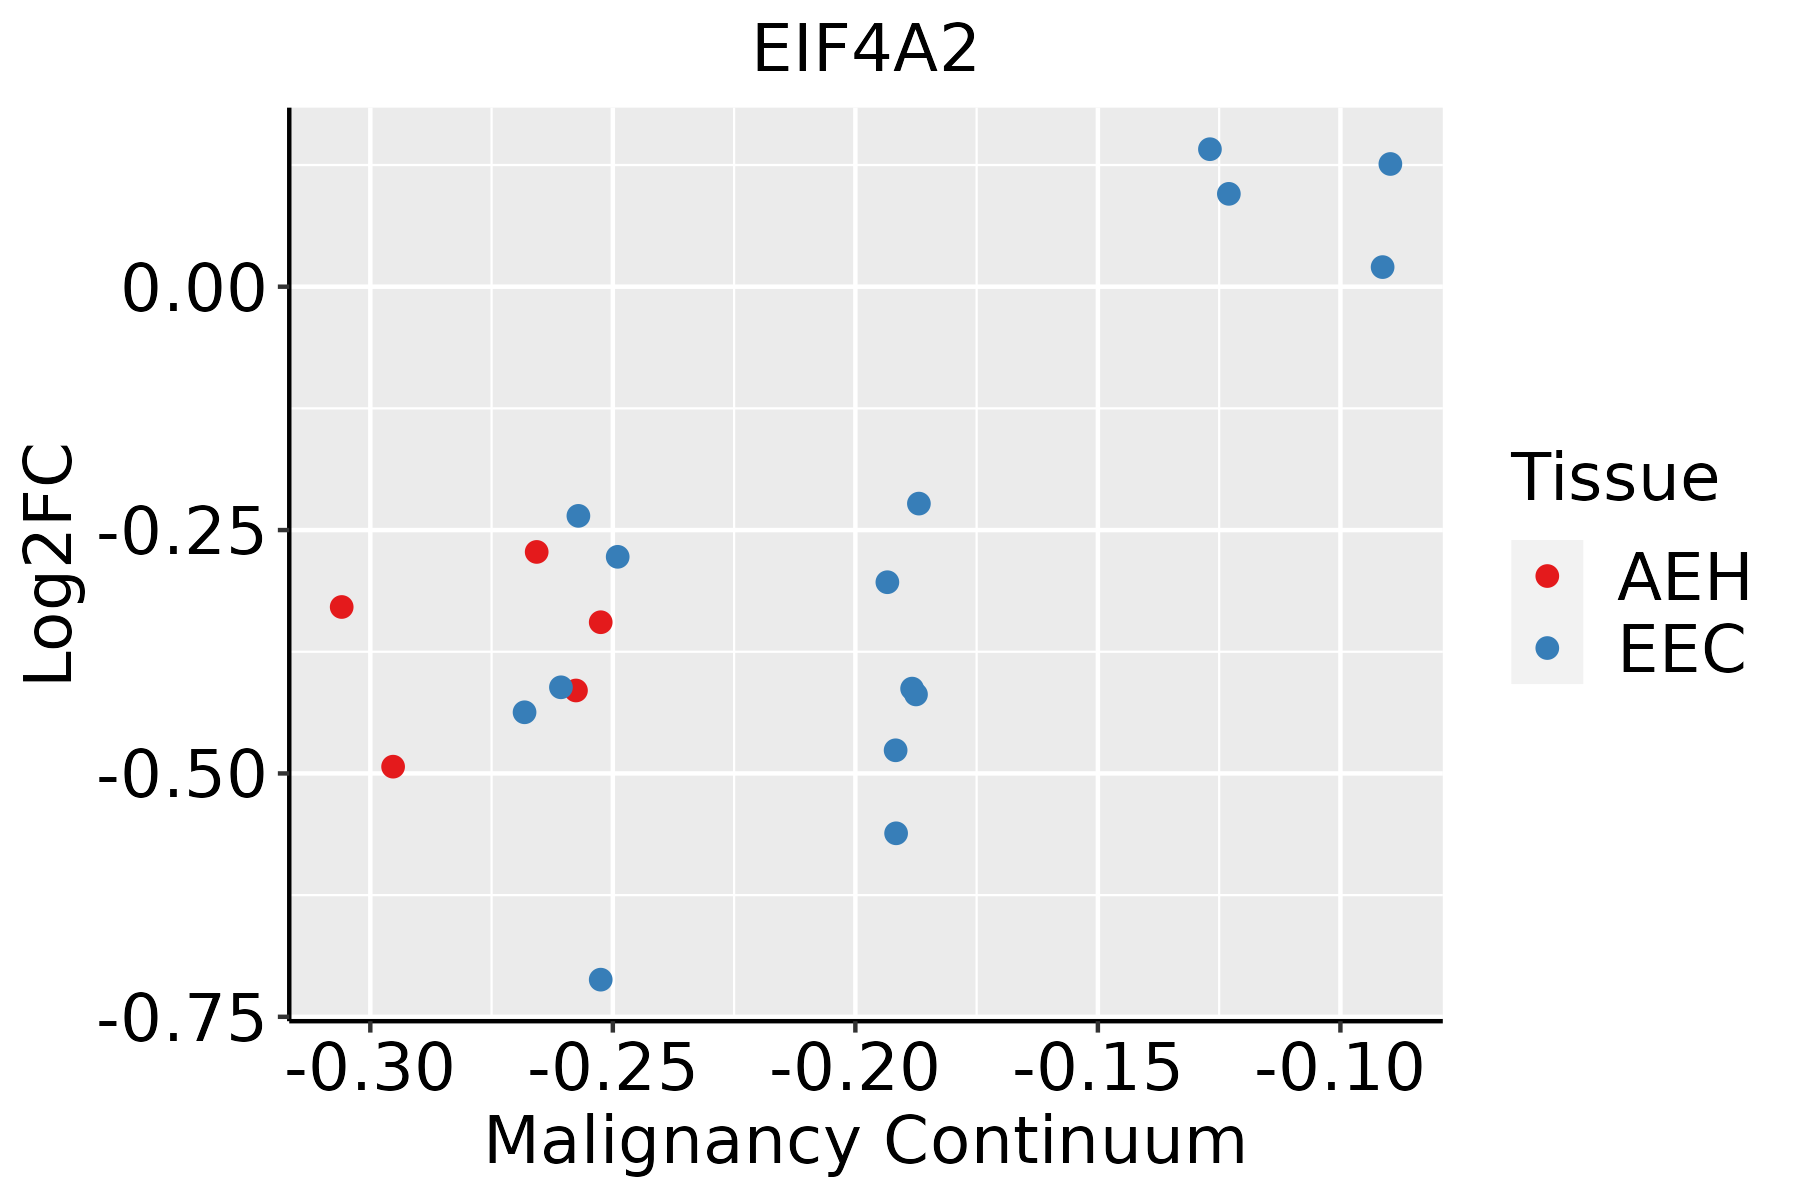
AEH: Atypical endometrial hyperplasia
EEC: Endometrioid Cancer
EsophagusThe image shows the transcriptomic changes along malignancy continuum.log2FC in expression of this searched gene in stem-like cells from each diseased tissue sample relative to stem-like cells in normal samples in each tissue plotted against the malignancy continuum. Samples are colored based on if they are from different disease stage.ESCC: Esophageal squamous cell carcinoma
HGIN: High-grade intraepithelial neoplasias
LGIN: Low-grade intraepithelial neoplasias
GCThe image shows the transcriptomic changes along malignancy continuum.log2FC in expression of this searched gene in stem-like cells from each diseased tissue sample relative to stem-like cells in normal samples in each tissue plotted against the malignancy continuum. Samples are colored based on if they are from different disease stage.
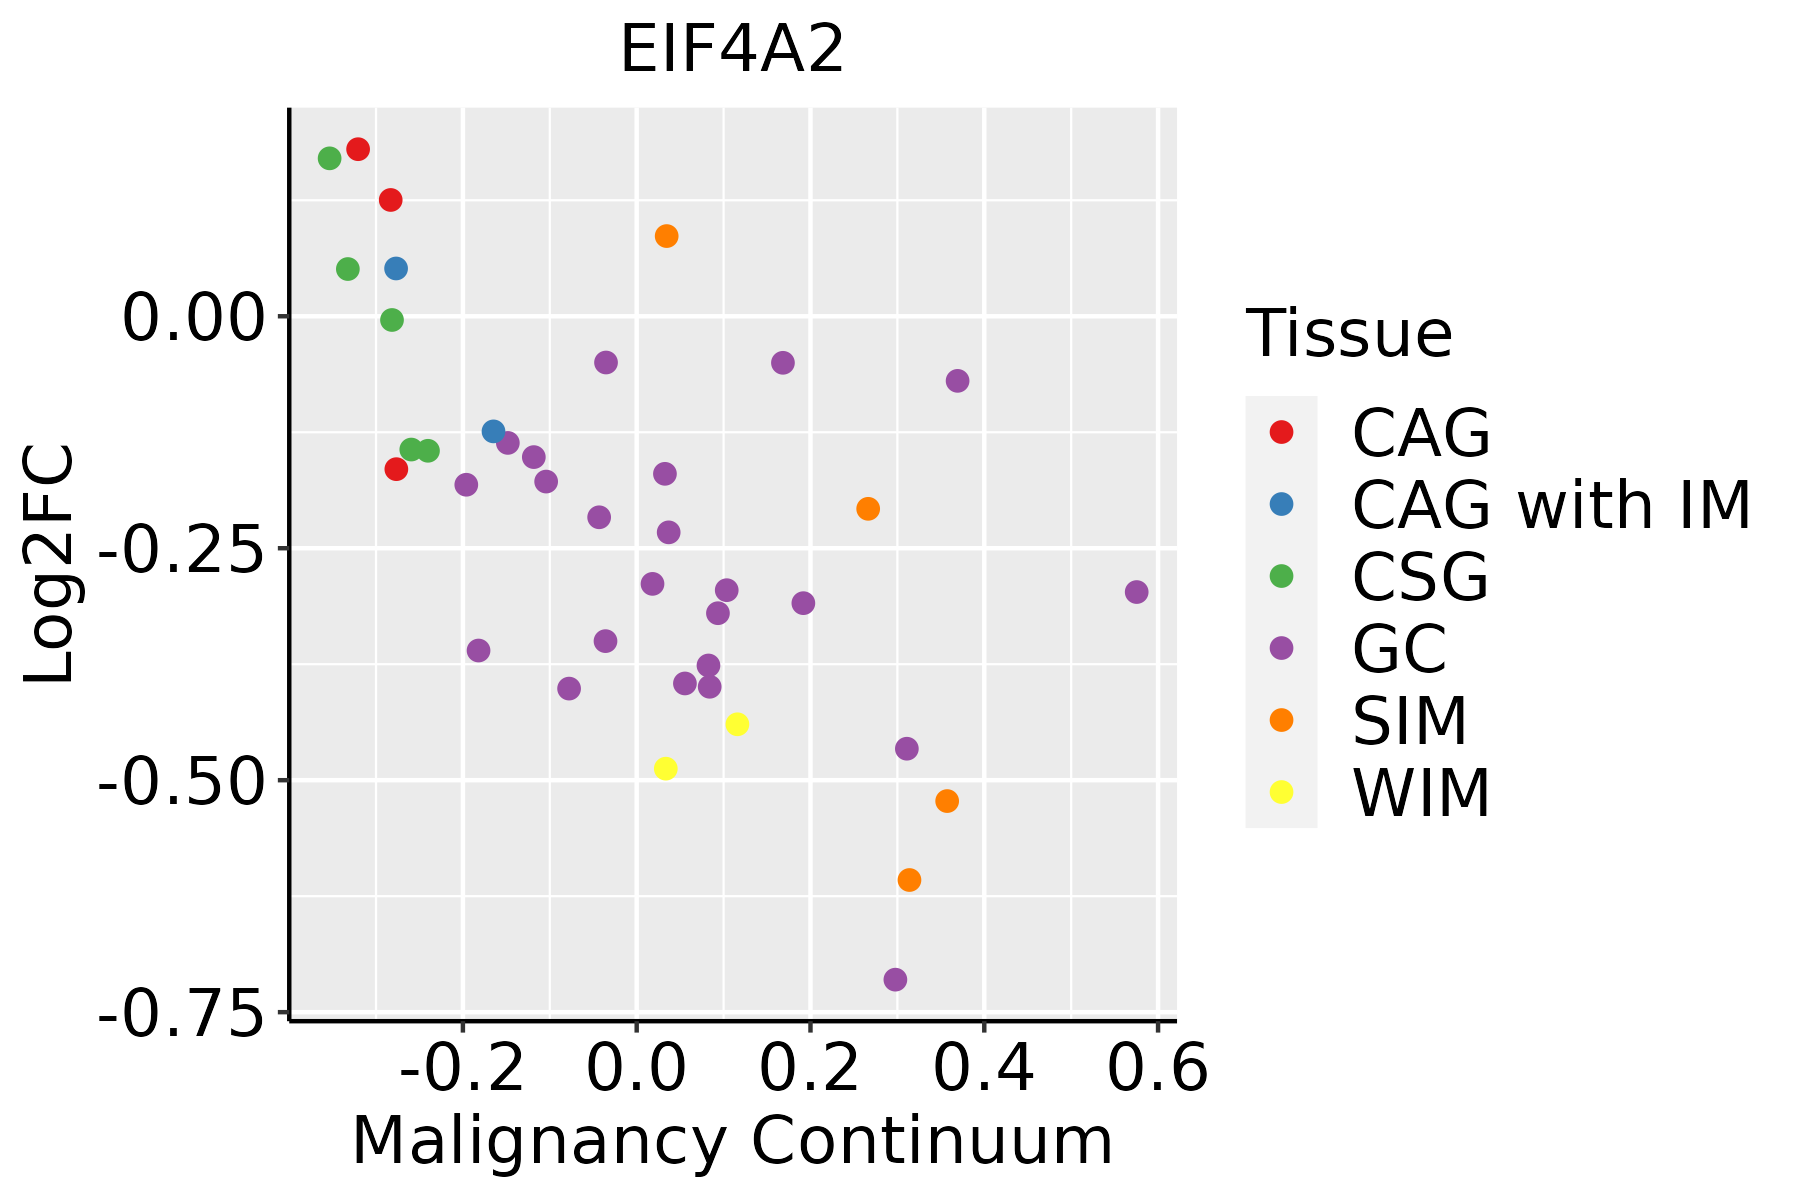
CAG: Chronic atrophic gastritis
CAG with IM: Chronic atrophic gastritis with intestinal metaplasia
CSG: Chronic superficial gastritis
GC: Gastric cancer
SIM: Severe intestinal metaplasia
WIM: Wild intestinal metaplasia
LiverThe image shows the transcriptomic changes along malignancy continuum.log2FC in expression of this searched gene in stem-like cells from each diseased tissue sample relative to stem-like cells in normal samples in each tissue plotted against the malignancy continuum. Samples are colored based on if they are from different disease stage.
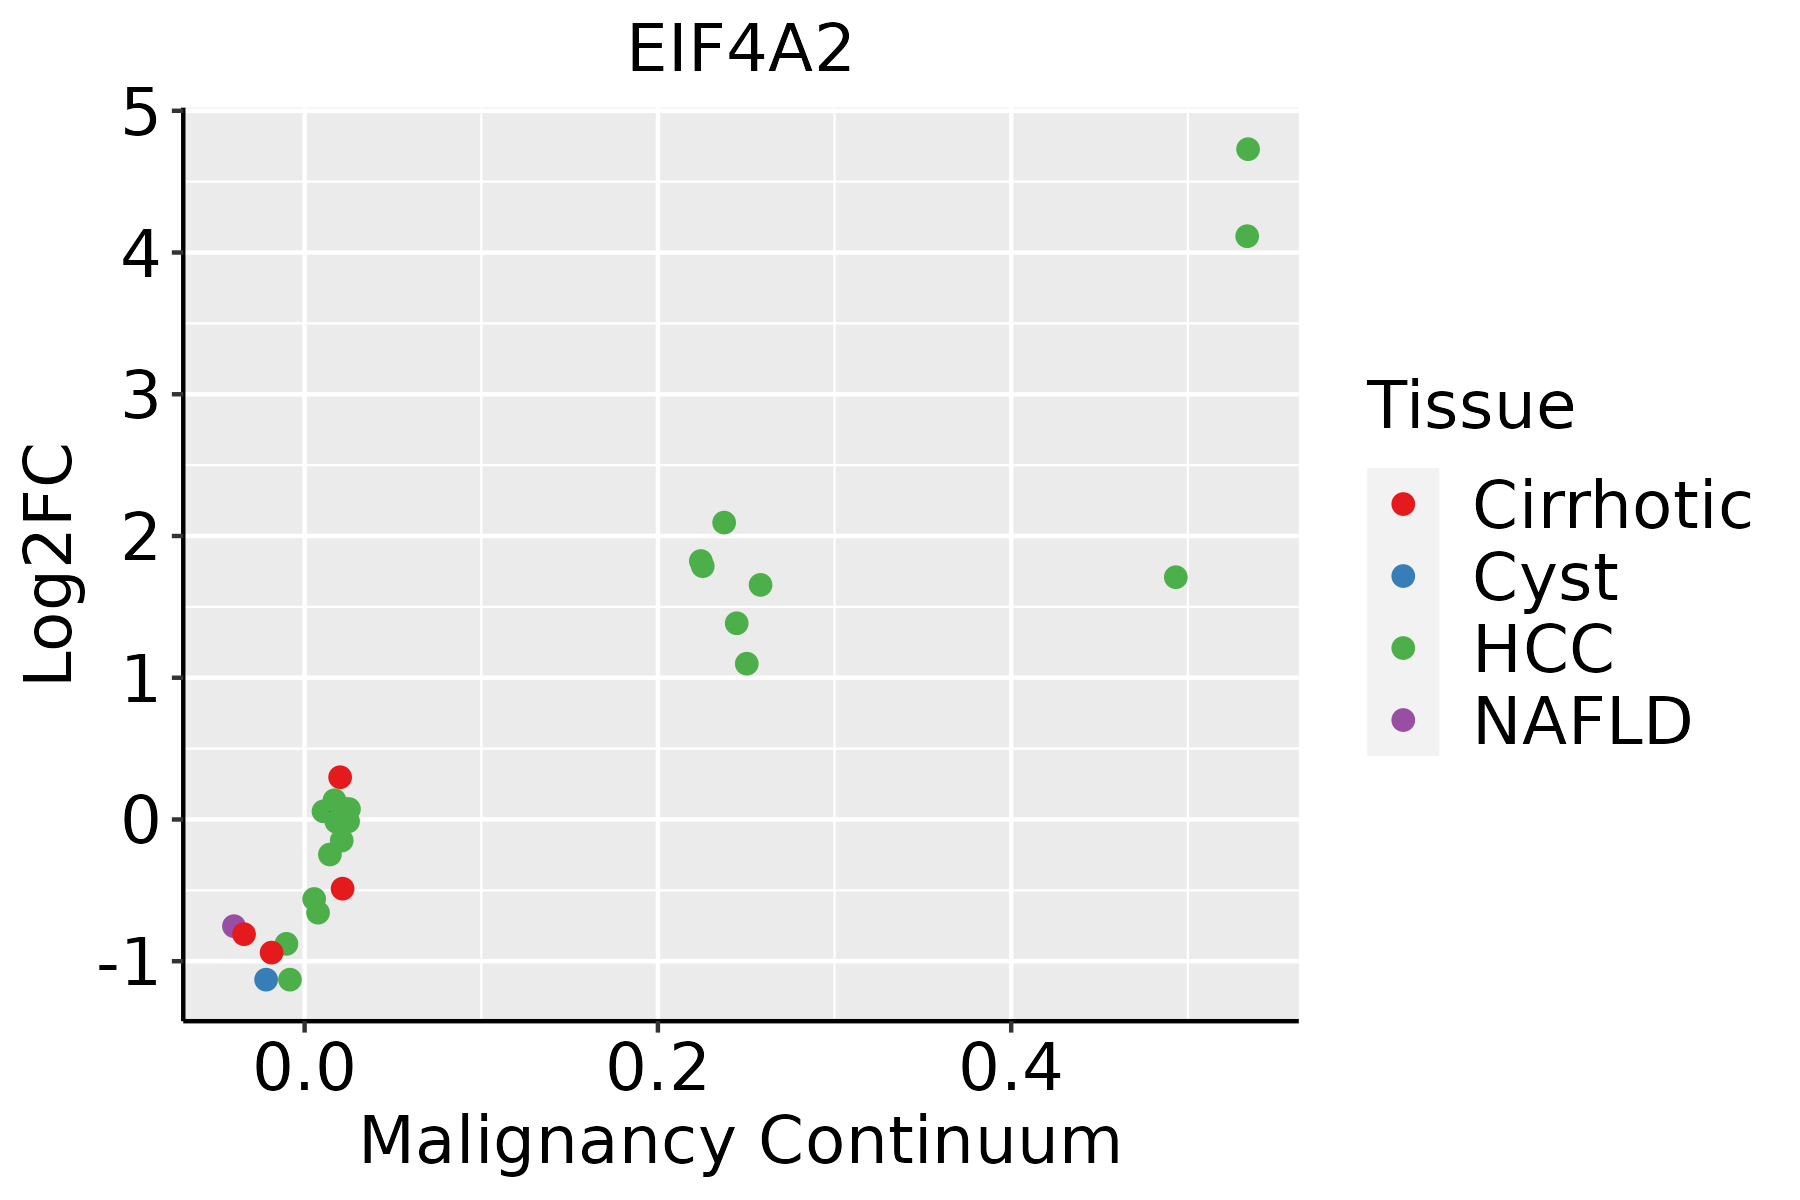
HCC: Hepatocellular carcinoma
NAFLD: Non-alcoholic fatty liver disease
Oral CavityThe image shows the transcriptomic changes along malignancy continuum.log2FC in expression of this searched gene in stem-like cells from each diseased tissue sample relative to stem-like cells in normal samples in each tissue plotted against the malignancy continuum. Samples are colored based on if they are from different disease stage.
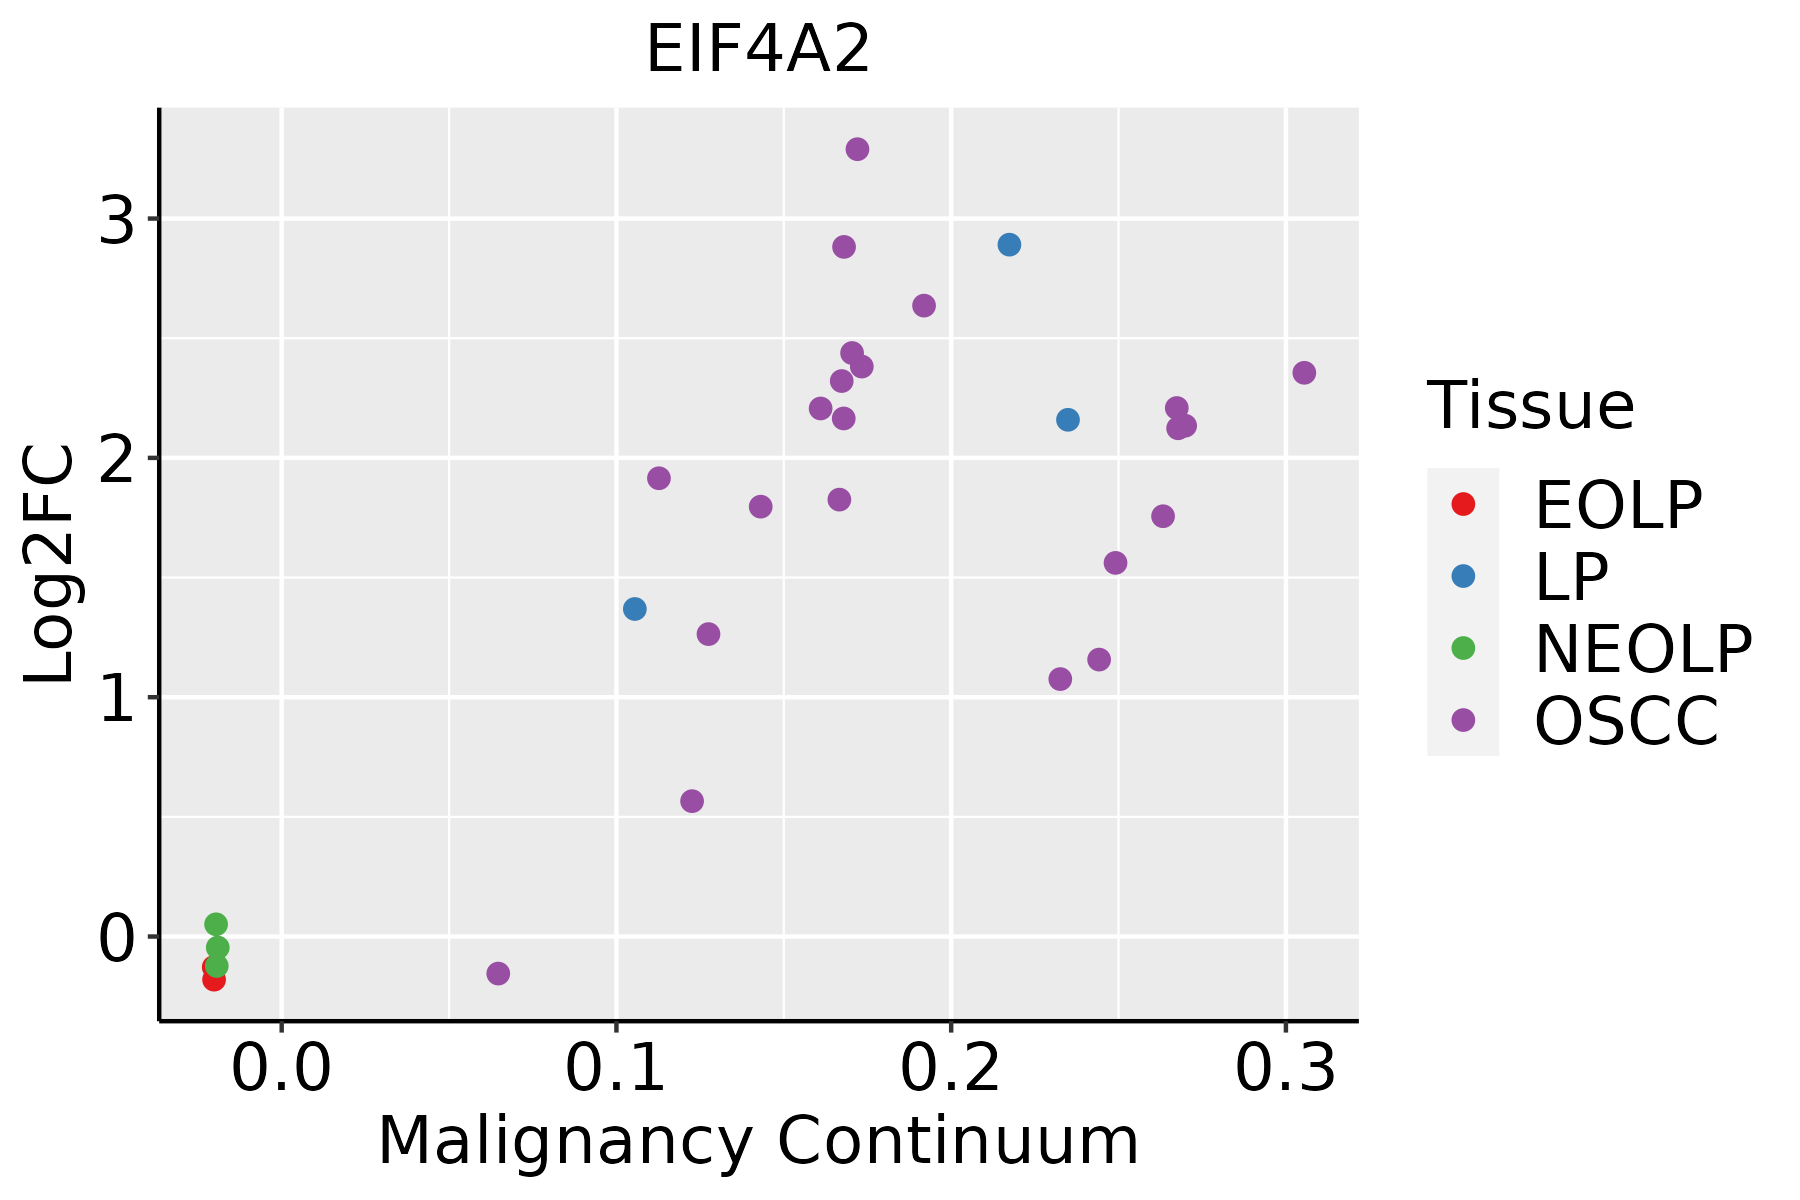
EOLP: Erosive Oral lichen planus
LP: leukoplakia
NEOLP: Non-erosive oral lichen planus
OSCC: Oral squamous cell carcinoma
ProstateThe image shows the transcriptomic changes along malignancy continuum.log2FC in expression of this searched gene in stem-like cells from each diseased tissue sample relative to stem-like cells in normal samples in each tissue plotted against the malignancy continuum. Samples are colored based on if they are from different disease stage.
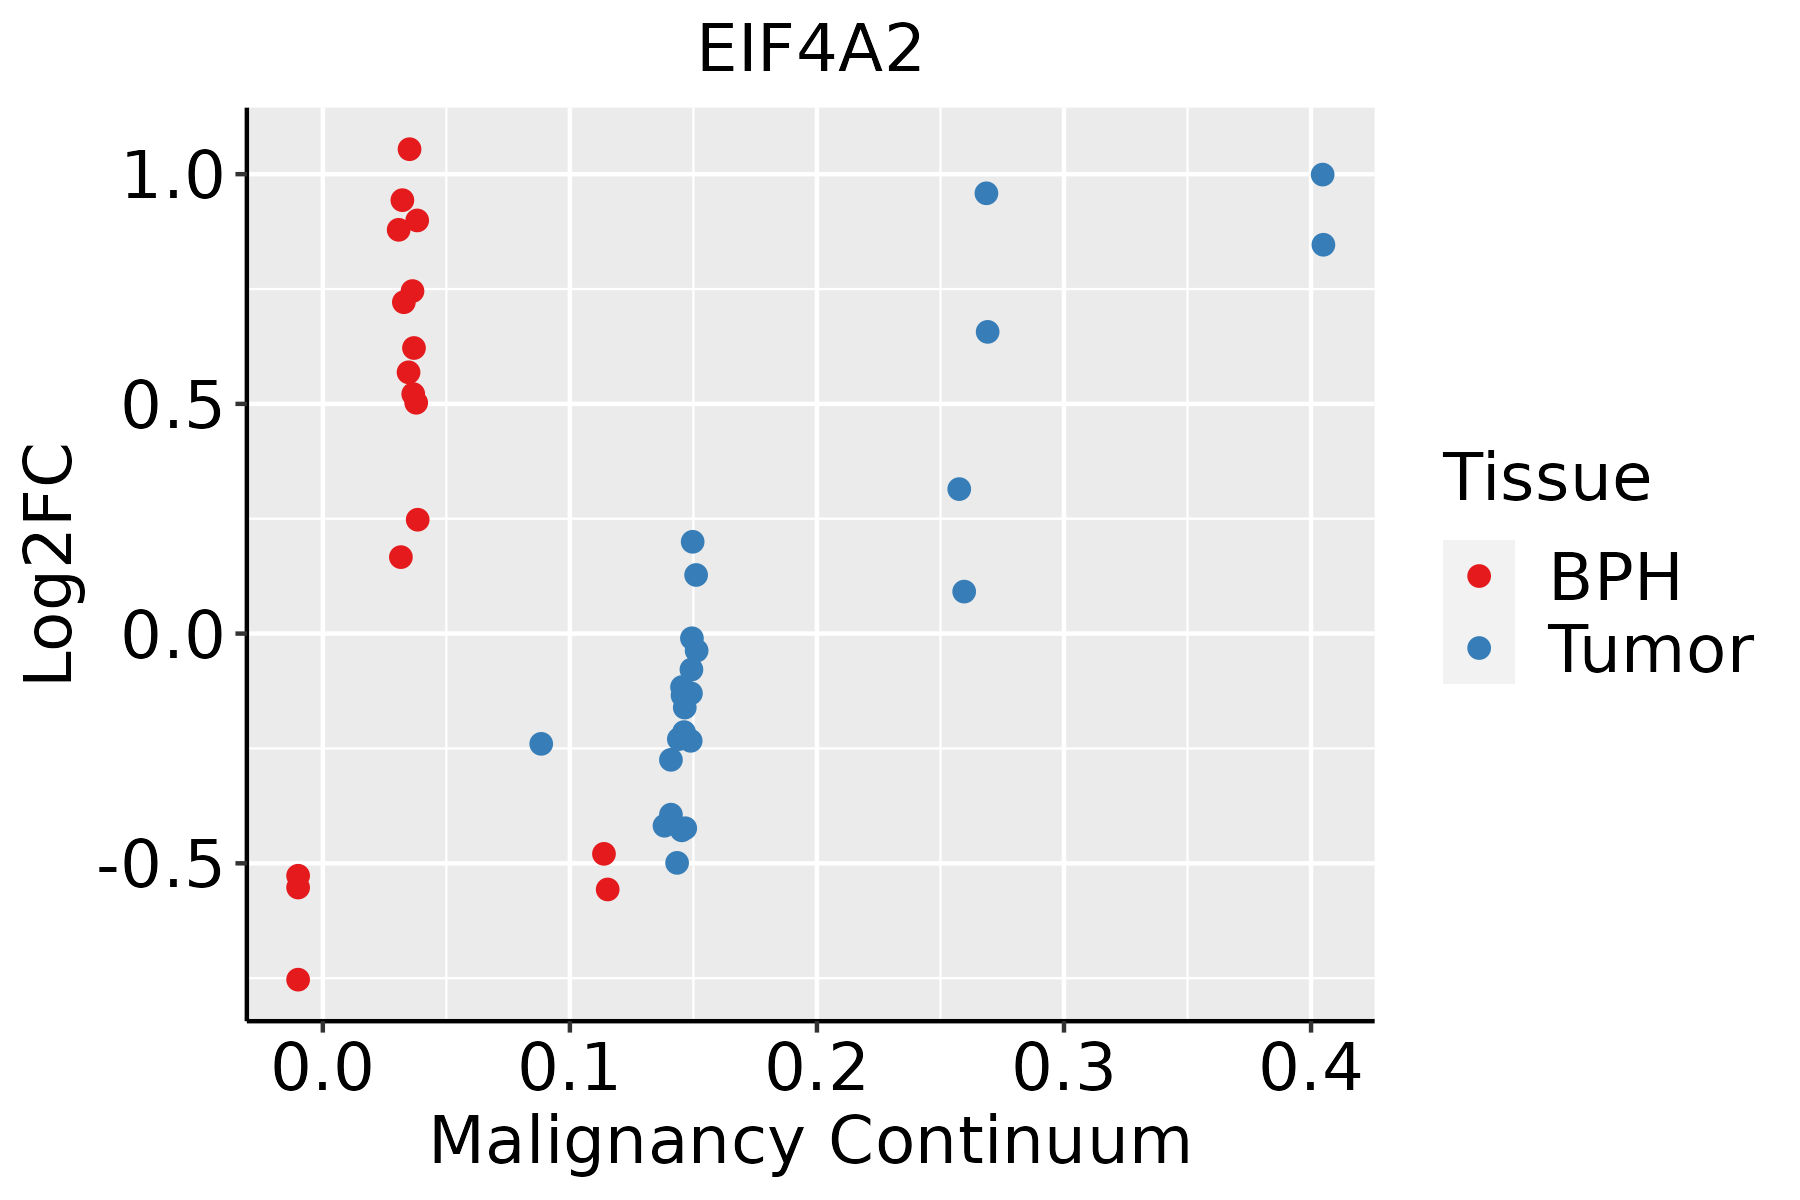
BPH: Benign Prostatic Hyperplasia
SkinThe image shows the transcriptomic changes along malignancy continuum.log2FC in expression of this searched gene in stem-like cells from each diseased tissue sample relative to stem-like cells in normal samples in each tissue plotted against the malignancy continuum. Samples are colored based on if they are from different disease stage.
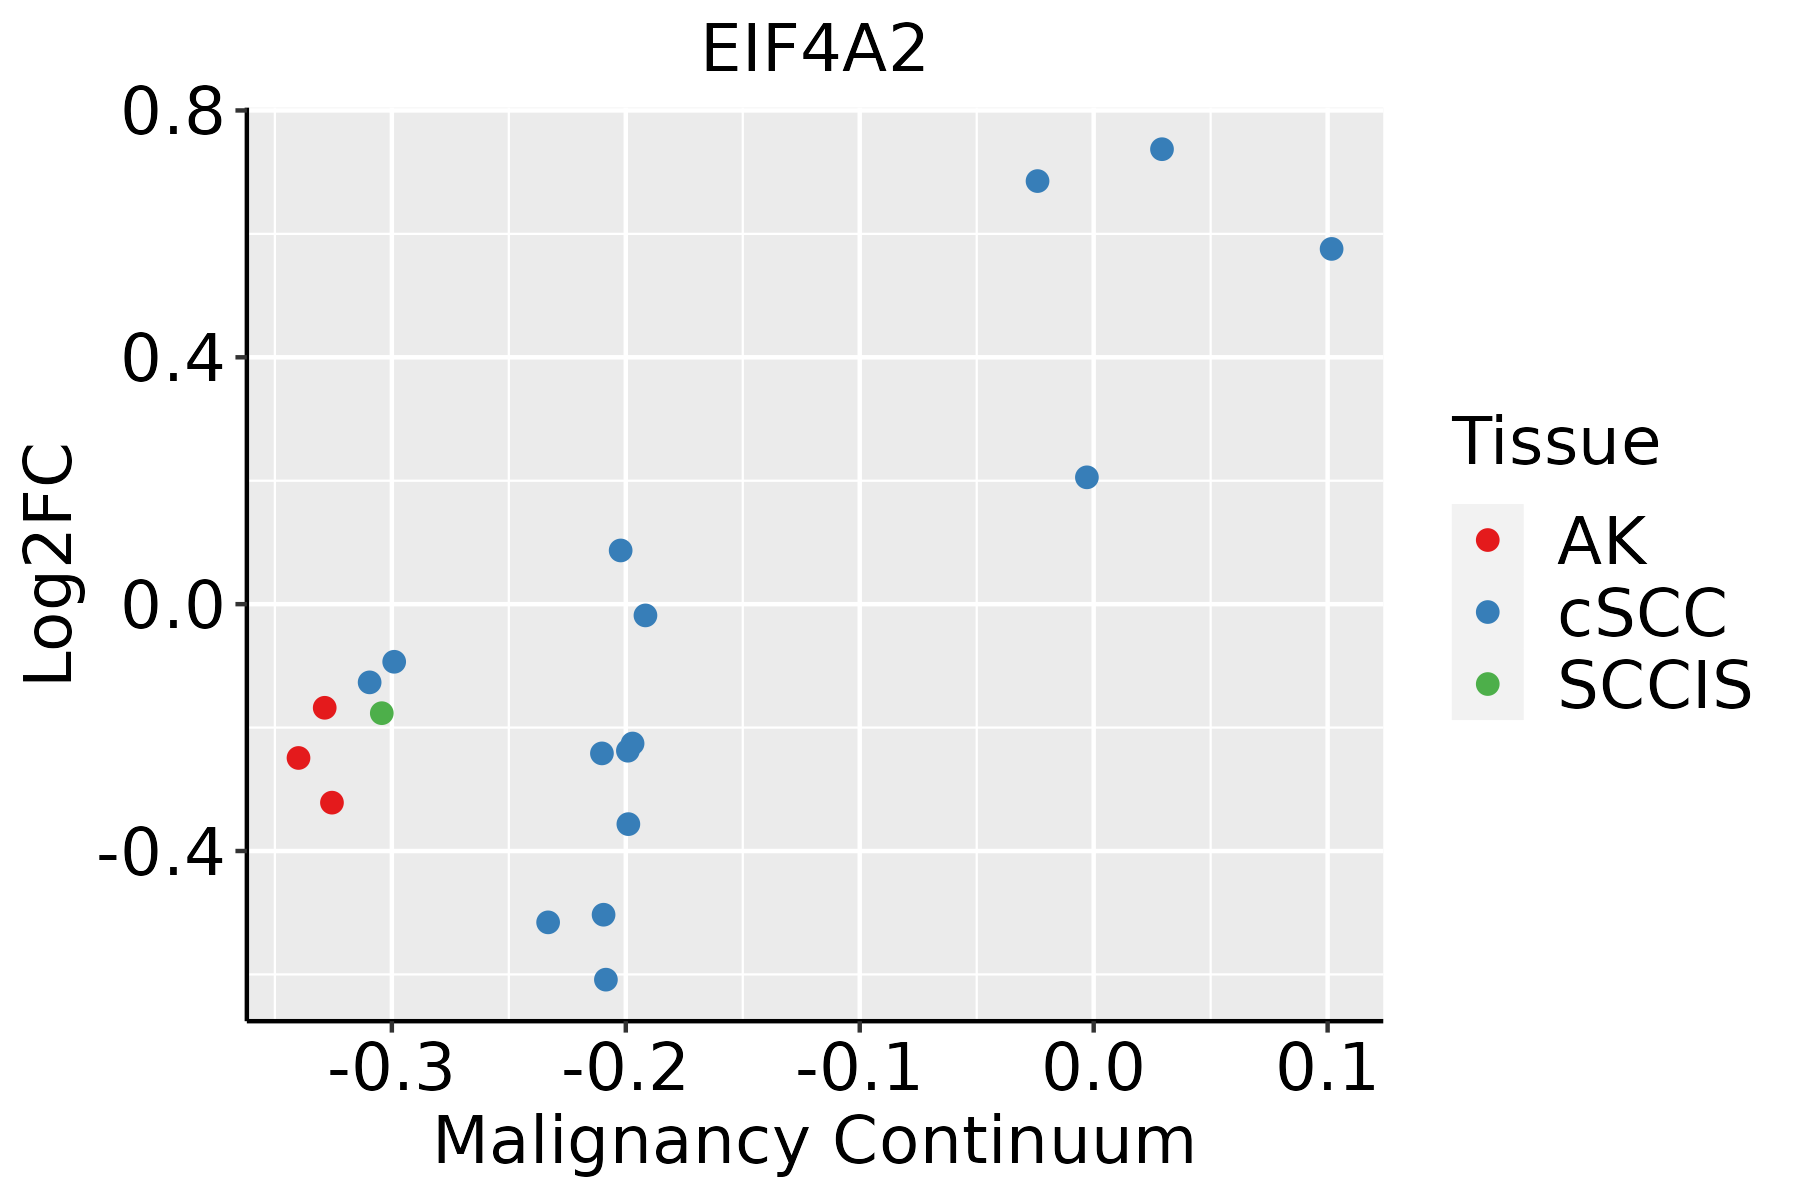
AK: Actinic keratosis
cSCC: Cutaneous squamous cell carcinoma
SCCIS:squamous cell carcinoma in situ
ThyroidThe image shows the transcriptomic changes along malignancy continuum.log2FC in expression of this searched gene in stem-like cells from each diseased tissue sample relative to stem-like cells in normal samples in each tissue plotted against the malignancy continuum. Samples are colored based on if they are from different disease stage.
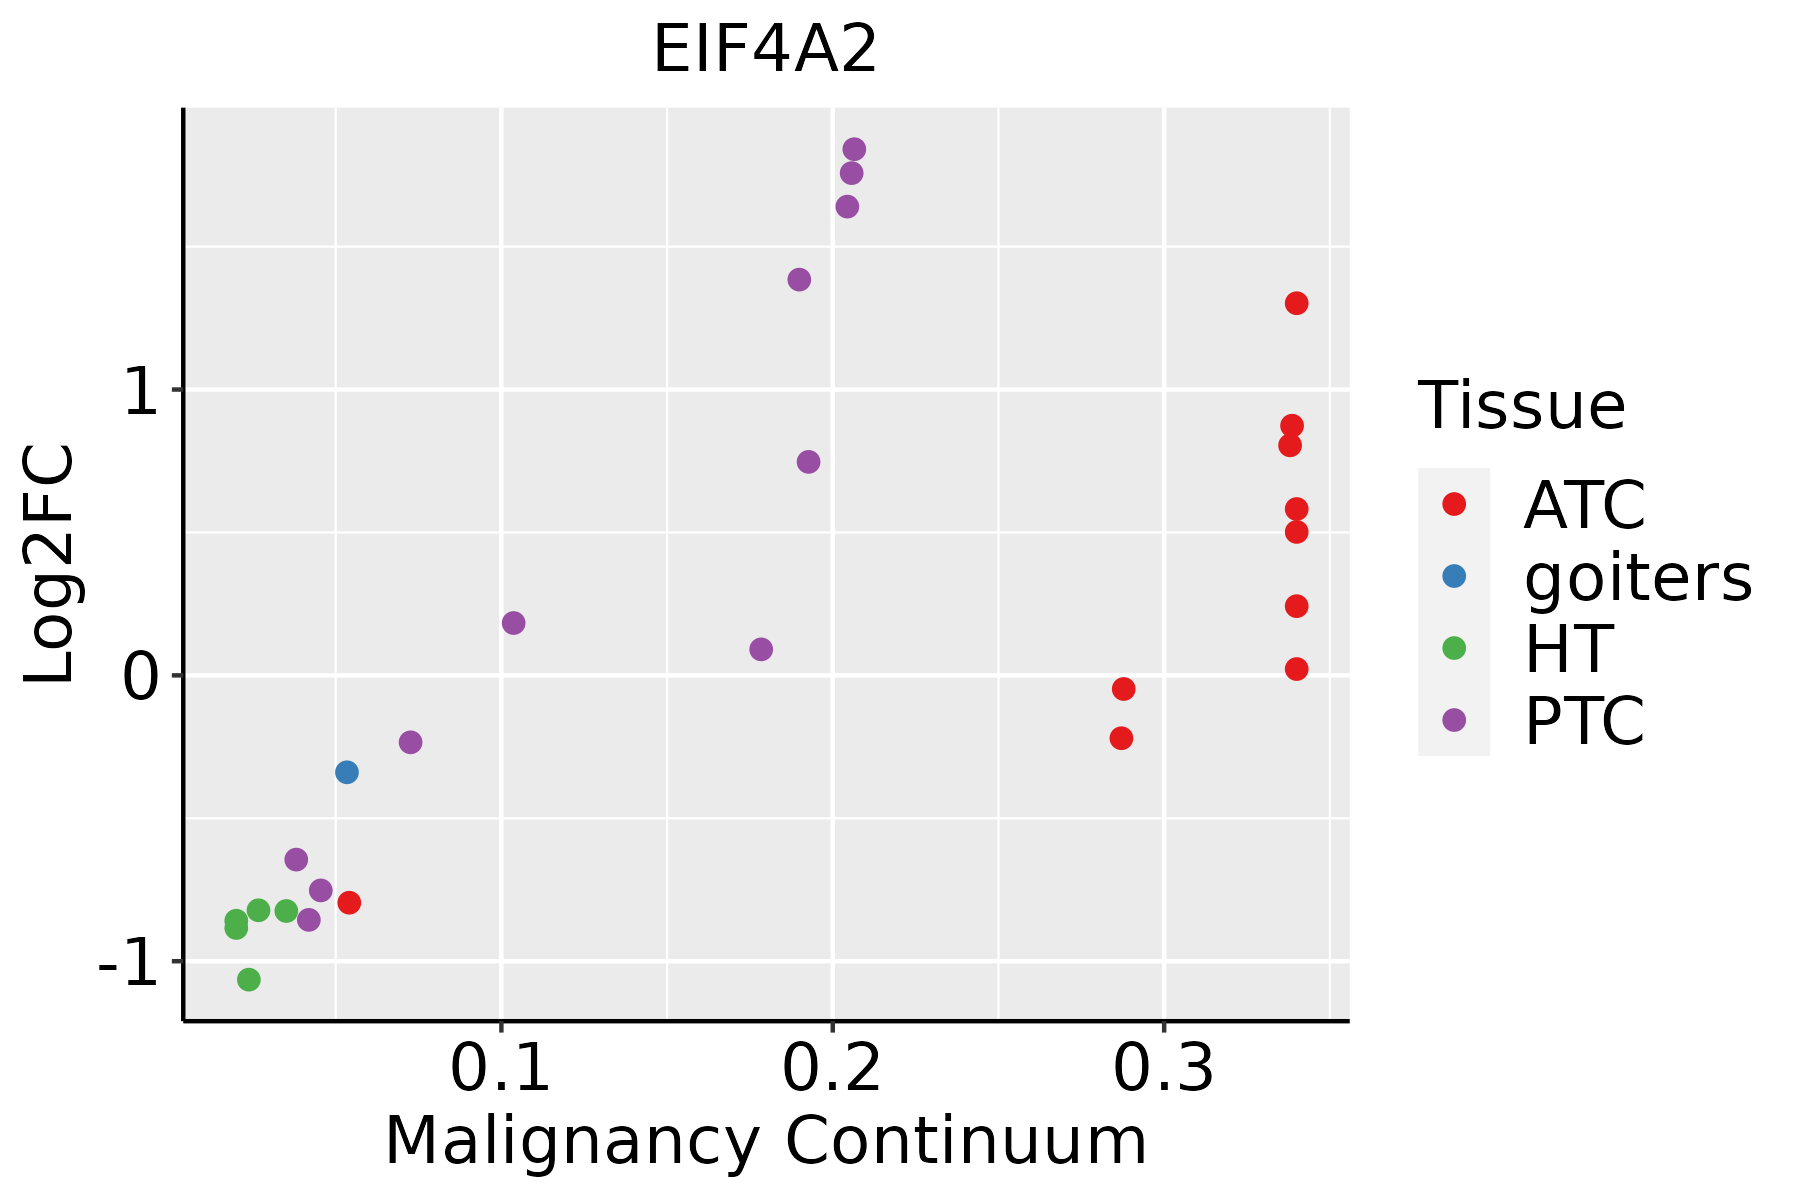
ATC: Anaplastic thyroid cancer
HT: Hashimoto's thyroiditis
PTC: Papillary thyroid cancer
∗log2FC in expression of this searched gene in stem-like cells from each diseased tissue sample relative to stem-like cells in normal samples in each tissue plotted against the malignancy continuum. Samples are colored based on if they are from different disease stage.

Top

Malignant transformation related pathway analysis

check buttonFind out the enriched GO biological processes and KEGG pathways involved in transition from healthy to precancer to cancer
check button Figure of enriched GO biological processes.
TissueDisease StageEnriched GO biological Processes
ColorectumADGO analysis - Figure of enriched GO biological processes: Top 15 enriched GO BP terms are showed in the bar plot of each disease state in each tissue. Each row represents a significant GO biological process which is colored according to the -log10(p.adjust).
ColorectumSERGO analysis - Figure of enriched GO biological processes: Top 15 enriched GO BP terms are showed in the bar plot of each disease state in each tissue. Each row represents a significant GO biological process which is colored according to the -log10(p.adjust).
ColorectumMSSGO analysis - Figure of enriched GO biological processes: Top 15 enriched GO BP terms are showed in the bar plot of each disease state in each tissue. Each row represents a significant GO biological process which is colored according to the -log10(p.adjust).
ColorectumMSI-HGO analysis - Figure of enriched GO biological processes: Top 15 enriched GO BP terms are showed in the bar plot of each disease state in each tissue. Each row represents a significant GO biological process which is colored according to the -log10(p.adjust).
ColorectumFAPGO analysis - Figure of enriched GO biological processes: Top 15 enriched GO BP terms are showed in the bar plot of each disease state in each tissue. Each row represents a significant GO biological process which is colored according to the -log10(p.adjust).
∗Top 15 enriched GO BP terms are showed in the bar plot of each disease state in each tissue. Each row represents a significant GO biological process which is colored according to the -log10(p.adjust).
Page: 1 2 3 4 5 6 7 8 9 

check button Enriched GO biological processes.
GO IDTissueDisease StageDescriptionGene RatioBg Ratiopvaluep.adjustCount
GO:00064461ColorectumMSSregulation of translational initiation26/346779/187231.56e-031.42e-0226
GO:00021813ColorectumMSI-Hcytoplasmic translation100/1319148/187231.50e-798.31e-76100
GO:00064133ColorectumMSI-Htranslational initiation37/1319118/187233.18e-158.83e-1337
GO:00021833ColorectumMSI-Hcytoplasmic translational initiation19/131934/187237.60e-141.84e-1119
GO:00064173ColorectumMSI-Hregulation of translation73/1319468/187239.89e-111.66e-0873
GO:00064462ColorectumMSI-Hregulation of translational initiation21/131979/187237.80e-088.02e-0621
GO:00513483ColorectumMSI-Hnegative regulation of transferase activity38/1319268/187232.89e-051.17e-0338
GO:00021814ColorectumFAPcytoplasmic translation76/2622148/187233.31e-272.03e-2376
GO:00064174ColorectumFAPregulation of translation111/2622468/187238.47e-091.13e-06111
GO:00021834ColorectumFAPcytoplasmic translational initiation16/262234/187233.74e-061.29e-0416
GO:00064463ColorectumFAPregulation of translational initiation26/262279/187231.54e-054.01e-0426
GO:00513484ColorectumFAPnegative regulation of transferase activity63/2622268/187231.82e-054.57e-0463
GO:00064134ColorectumFAPtranslational initiation34/2622118/187232.13e-055.12e-0434
GO:1990823ColorectumFAPresponse to leukemia inhibitory factor23/262295/187235.32e-033.49e-0223
GO:000218116EndometriumAEHcytoplasmic translation104/2100148/187231.01e-646.07e-61104
GO:000641310EndometriumAEHtranslational initiation42/2100118/187232.68e-124.67e-1042
GO:000218310EndometriumAEHcytoplasmic translational initiation18/210034/187232.75e-092.06e-0718
GO:000641716EndometriumAEHregulation of translation94/2100468/187231.14e-087.62e-0794
GO:00064467EndometriumAEHregulation of translational initiation25/210079/187238.99e-073.19e-0525
GO:005134816EndometriumAEHnegative regulation of transferase activity51/2100268/187231.06e-041.52e-0351
Page: 1 2 3 4 5 6 7 8 9 10 11 12 

check button Enriched KEGG pathways.
Pathway IDTissueDisease StageDescriptionGene RatioBg Ratiopvaluep.adjustqvalueCount
Page: 1 

Top

Cell-cell communication analysis

check buttonIdentification of potential cell-cell interactions between two cell types and their ligand-receptor pairs for different disease states
LigandReceptorLRpairPathwayTissueDisease Stage
Page: 1 

Top

Single-cell gene regulatory network inference analysis

check buttonFind out the significant the regulons (TFs) and the target genes of each regulon across cell types for different disease states
TFCell TypeTissueDisease StageTarget GeneRSSRegulon Activity
∗The dot plots of a searched regulon are shown for all cell subpopulations in each disease state of each tissue based on the regulon specific score inferred using pySCENIC and by calculating the average expression.
Page: 1 

Top

Somatic mutation of malignant transformation related genes

check buttonAnnotation of somatic variants for genes involved in malignant transformation
Hugo SymbolVariant ClassVariant ClassificationdbSNP RSHGVScHGVSpHGVSp ShortSWISSPROTBIOTYPESIFTPolyPhenTumor Sample BarcodeTissueHistologySexAgeStageTherapy TypesDrugsOutcome
EIF4A2SNVMissense_Mutationc.73G>Cp.Glu25Glnp.E25QQ14240protein_codingtolerated_low_confidence(0.1)benign(0.027)TCGA-5L-AAT1-01Breastbreast invasive carcinomaFemale<65III/IVHormone TherapyletrozolSD
EIF4A2SNVMissense_Mutationc.1055N>Gp.Thr352Serp.T352SQ14240protein_codingtolerated(0.37)benign(0.001)TCGA-A8-A079-01Breastbreast invasive carcinomaFemale>=65III/IVChemotherapy5-fluorouracilSD
EIF4A2SNVMissense_Mutationc.595G>Cp.Glu199Glnp.E199QQ14240protein_codingdeleterious(0.05)benign(0.141)TCGA-A8-A09G-01Breastbreast invasive carcinomaFemale>=65III/IVUnknownUnknownSD
EIF4A2SNVMissense_Mutationc.1107N>Tp.Arg369Serp.R369SQ14240protein_codingdeleterious(0.01)benign(0.246)TCGA-AC-A23H-01Breastbreast invasive carcinomaFemale>=65I/IIUnknownUnknownPD
EIF4A2SNVMissense_Mutationc.97N>Ap.Asp33Asnp.D33NQ14240protein_codingtolerated(0.06)benign(0.005)TCGA-AR-A0TV-01Breastbreast invasive carcinomaFemale>=65I/IIUnknownUnknownSD
EIF4A2SNVMissense_Mutationnovelc.55G>Ap.Asp19Asnp.D19NQ14240protein_codingtolerated_low_confidence(0.14)benign(0)TCGA-AR-A2LH-01Breastbreast invasive carcinomaFemale<65III/IVChemotherapyadriamycinPD
EIF4A2SNVMissense_Mutationc.595N>Ap.Glu199Lysp.E199KQ14240protein_codingdeleterious(0.03)benign(0.035)TCGA-BH-A0B6-01Breastbreast invasive carcinomaFemale<65I/IIUnknownUnknownSD
EIF4A2SNVMissense_Mutationrs199556041c.1184C>Tp.Thr395Ilep.T395IQ14240protein_codingdeleterious(0.05)benign(0.005)TCGA-C8-A26X-01Breastbreast invasive carcinomaFemale<65I/IIChemotherapy5-fluorouracilCR
EIF4A2SNVMissense_Mutationc.1165G>Ap.Glu389Lysp.E389KQ14240protein_codingdeleterious(0)possibly_damaging(0.648)TCGA-C8-A26Y-01Breastbreast invasive carcinomaFemale>=65I/IIUnknownUnknownSD
EIF4A2SNVMissense_Mutationnovelc.769N>Cp.Glu257Glnp.E257QQ14240protein_codingdeleterious(0)benign(0.372)TCGA-GI-A2C9-01Breastbreast invasive carcinomaFemale<65I/IIUnspecificSD
Page: 1 2 3 4 5 6 7 

Top

Related drugs of malignant transformation related genes

check buttonIdentification of chemicals and drugs interact with genes involved in malignant transfromation
(DGIdb 4.0)
Entrez IDSymbolCategoryInteraction TypesDrug Claim NameDrug NamePMIDs
Page: 1