
|
|||||
|
 | |
| |
| |
| |
| |
| |
|
Gene: EHD2 |
Gene summary for EHD2 |
| Gene information | Species | Human | Gene symbol | EHD2 | Gene ID | 30846 |
| Gene name | EH domain containing 2 | |
| Gene Alias | PAST2 | |
| Cytomap | 19q13.33 | |
| Gene Type | protein-coding | GO ID | GO:0000768 | UniProtAcc | A0A024R0S6 |
Top |
Malignant transformation analysis |
| Identification of the aberrant gene expression in precancerous and cancerous lesions by comparing the gene expression of stem-like cells in diseased tissues with normal stem cells |
| Entrez ID | Symbol | Replicates | Species | Organ | Tissue | Adj P-value | Log2FC | Malignancy |
| 30846 | EHD2 | LZE4T | Human | Esophagus | ESCC | 2.31e-18 | 3.32e-01 | 0.0811 |
| 30846 | EHD2 | LZE8T | Human | Esophagus | ESCC | 1.80e-11 | 2.75e-01 | 0.067 |
| 30846 | EHD2 | LZE20T | Human | Esophagus | ESCC | 3.00e-07 | 1.90e-01 | 0.0662 |
| 30846 | EHD2 | LZE24T | Human | Esophagus | ESCC | 1.52e-12 | 3.12e-01 | 0.0596 |
| 30846 | EHD2 | LZE6T | Human | Esophagus | ESCC | 7.40e-08 | 3.99e-01 | 0.0845 |
| 30846 | EHD2 | P1T-E | Human | Esophagus | ESCC | 1.35e-04 | 3.24e-01 | 0.0875 |
| 30846 | EHD2 | P2T-E | Human | Esophagus | ESCC | 1.25e-06 | 6.50e-02 | 0.1177 |
| 30846 | EHD2 | P4T-E | Human | Esophagus | ESCC | 2.81e-13 | 2.95e-01 | 0.1323 |
| 30846 | EHD2 | P5T-E | Human | Esophagus | ESCC | 4.08e-26 | 5.07e-01 | 0.1327 |
| 30846 | EHD2 | P8T-E | Human | Esophagus | ESCC | 1.93e-32 | 6.66e-01 | 0.0889 |
| 30846 | EHD2 | P9T-E | Human | Esophagus | ESCC | 7.11e-08 | 2.70e-01 | 0.1131 |
| 30846 | EHD2 | P10T-E | Human | Esophagus | ESCC | 4.04e-22 | 3.44e-01 | 0.116 |
| 30846 | EHD2 | P11T-E | Human | Esophagus | ESCC | 1.35e-30 | 9.68e-01 | 0.1426 |
| 30846 | EHD2 | P12T-E | Human | Esophagus | ESCC | 2.88e-23 | 5.06e-01 | 0.1122 |
| 30846 | EHD2 | P15T-E | Human | Esophagus | ESCC | 3.11e-27 | 5.79e-01 | 0.1149 |
| 30846 | EHD2 | P16T-E | Human | Esophagus | ESCC | 3.31e-08 | 5.20e-02 | 0.1153 |
| 30846 | EHD2 | P17T-E | Human | Esophagus | ESCC | 1.57e-19 | 7.63e-01 | 0.1278 |
| 30846 | EHD2 | P19T-E | Human | Esophagus | ESCC | 6.85e-10 | 8.49e-01 | 0.1662 |
| 30846 | EHD2 | P20T-E | Human | Esophagus | ESCC | 3.97e-19 | 4.27e-01 | 0.1124 |
| 30846 | EHD2 | P21T-E | Human | Esophagus | ESCC | 1.60e-40 | 8.96e-01 | 0.1617 |
| Page: 1 2 3 4 5 |
| Tissue | Expression Dynamics | Abbreviation |
| Esophagus |  | ESCC: Esophageal squamous cell carcinoma |
| HGIN: High-grade intraepithelial neoplasias | ||
| LGIN: Low-grade intraepithelial neoplasias | ||
| Liver | 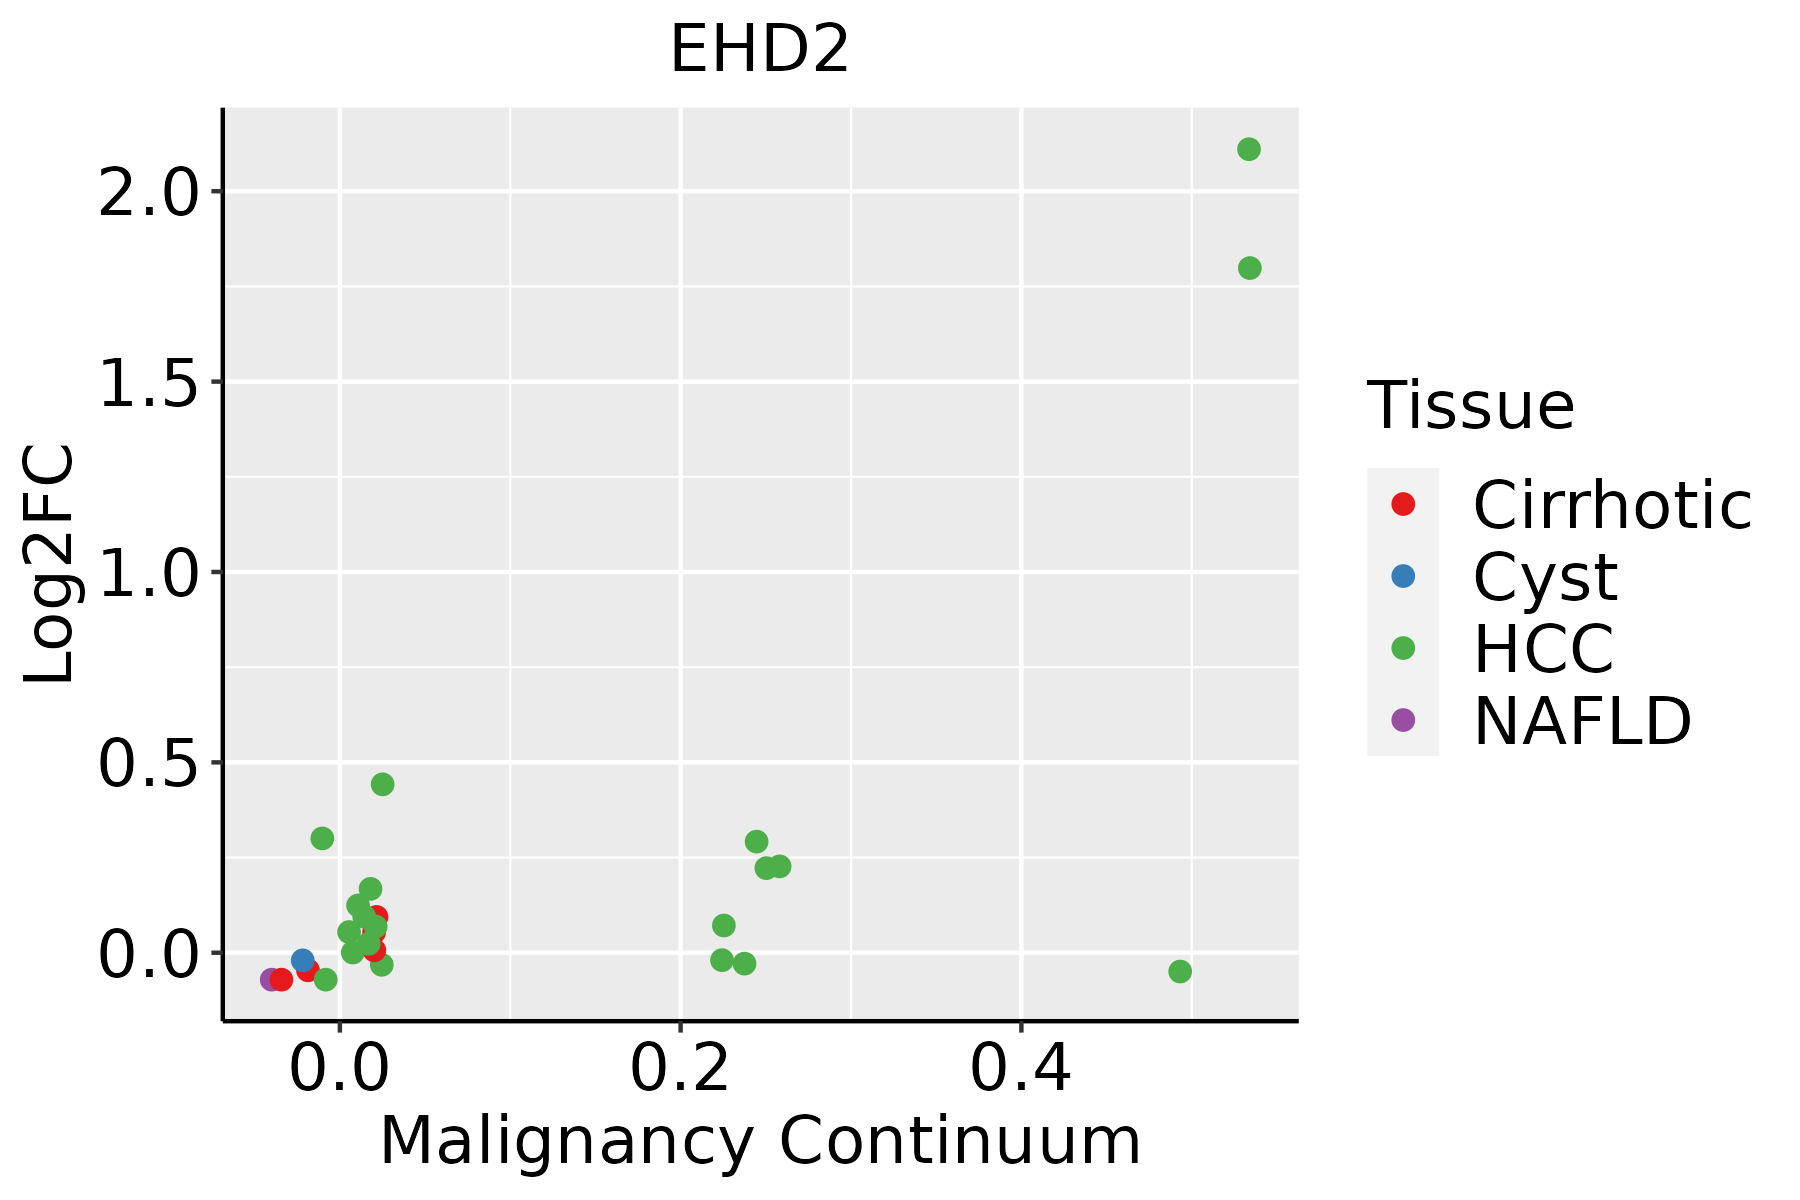 | HCC: Hepatocellular carcinoma |
| NAFLD: Non-alcoholic fatty liver disease | ||
| Oral Cavity | 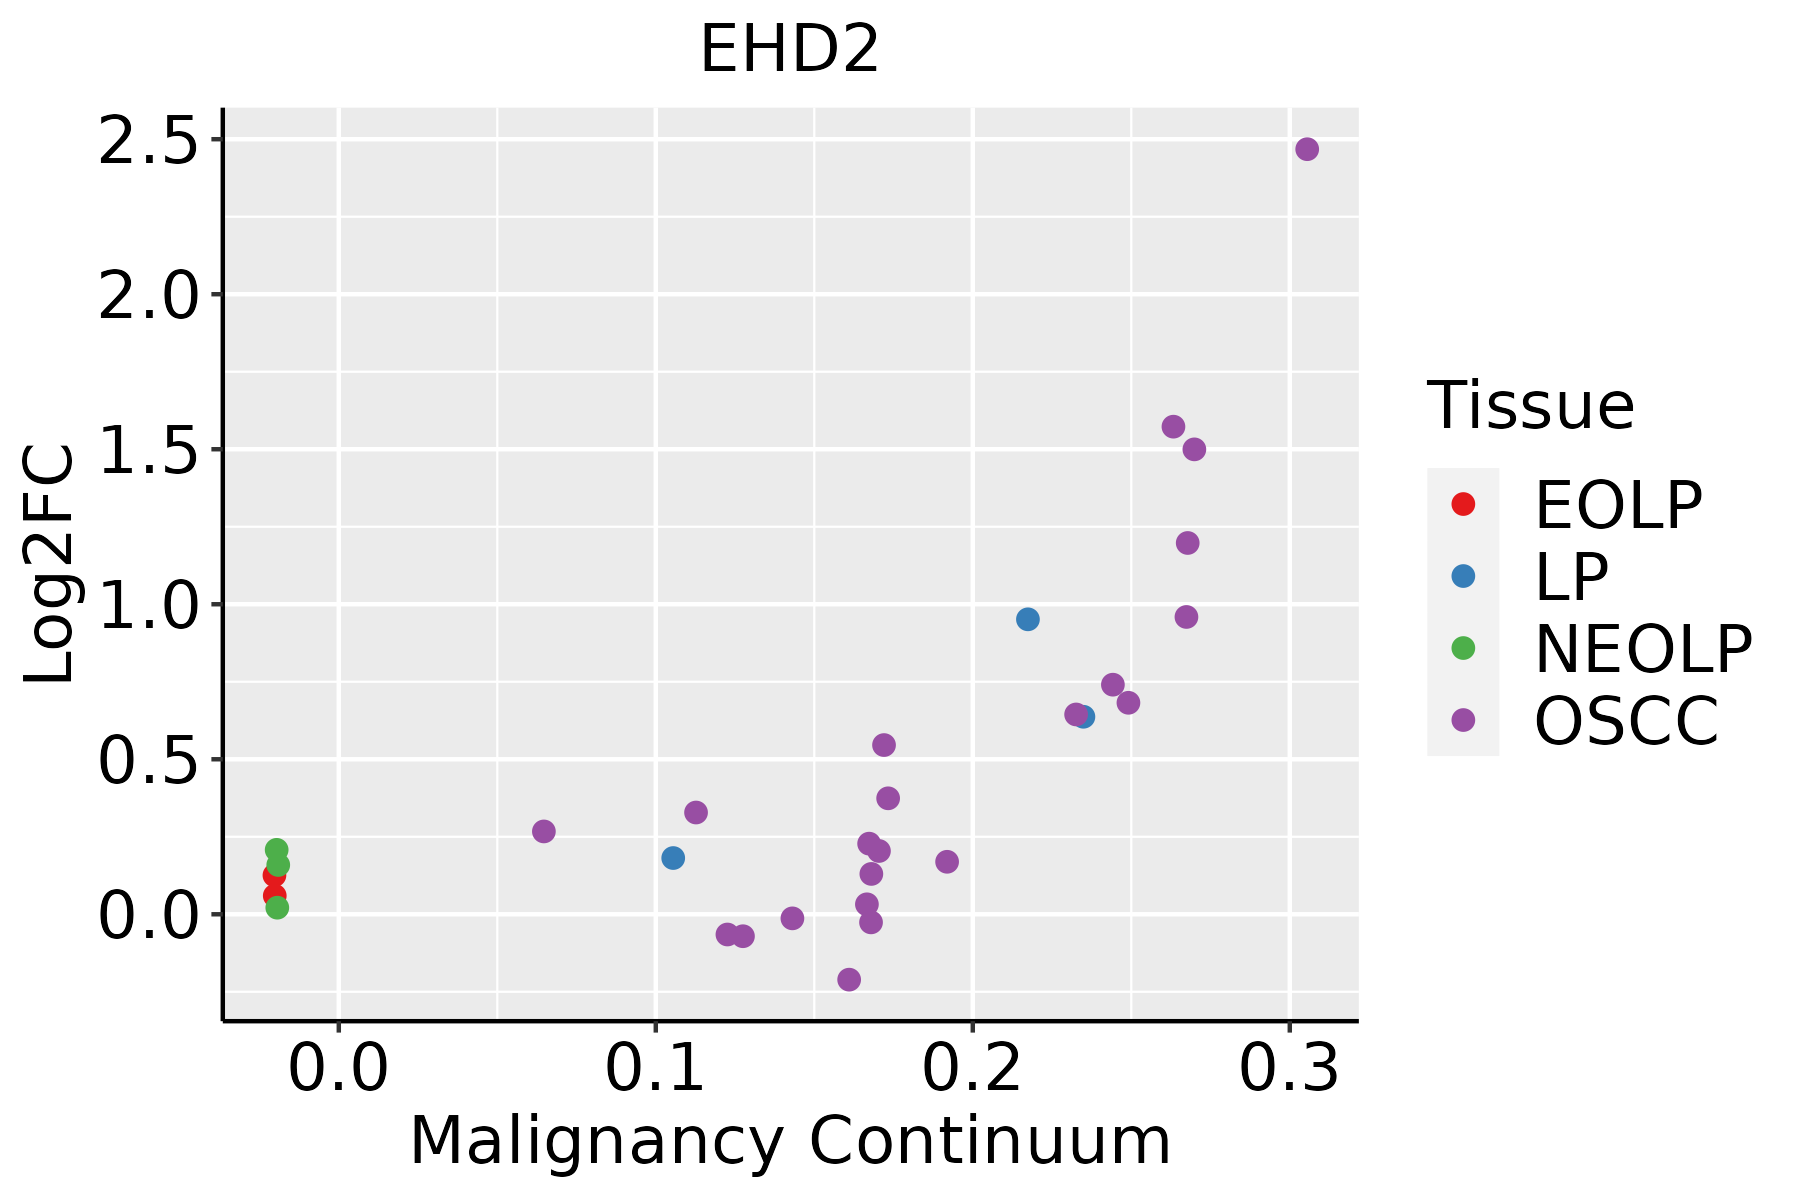 | EOLP: Erosive Oral lichen planus |
| LP: leukoplakia | ||
| NEOLP: Non-erosive oral lichen planus | ||
| OSCC: Oral squamous cell carcinoma | ||
| Skin | 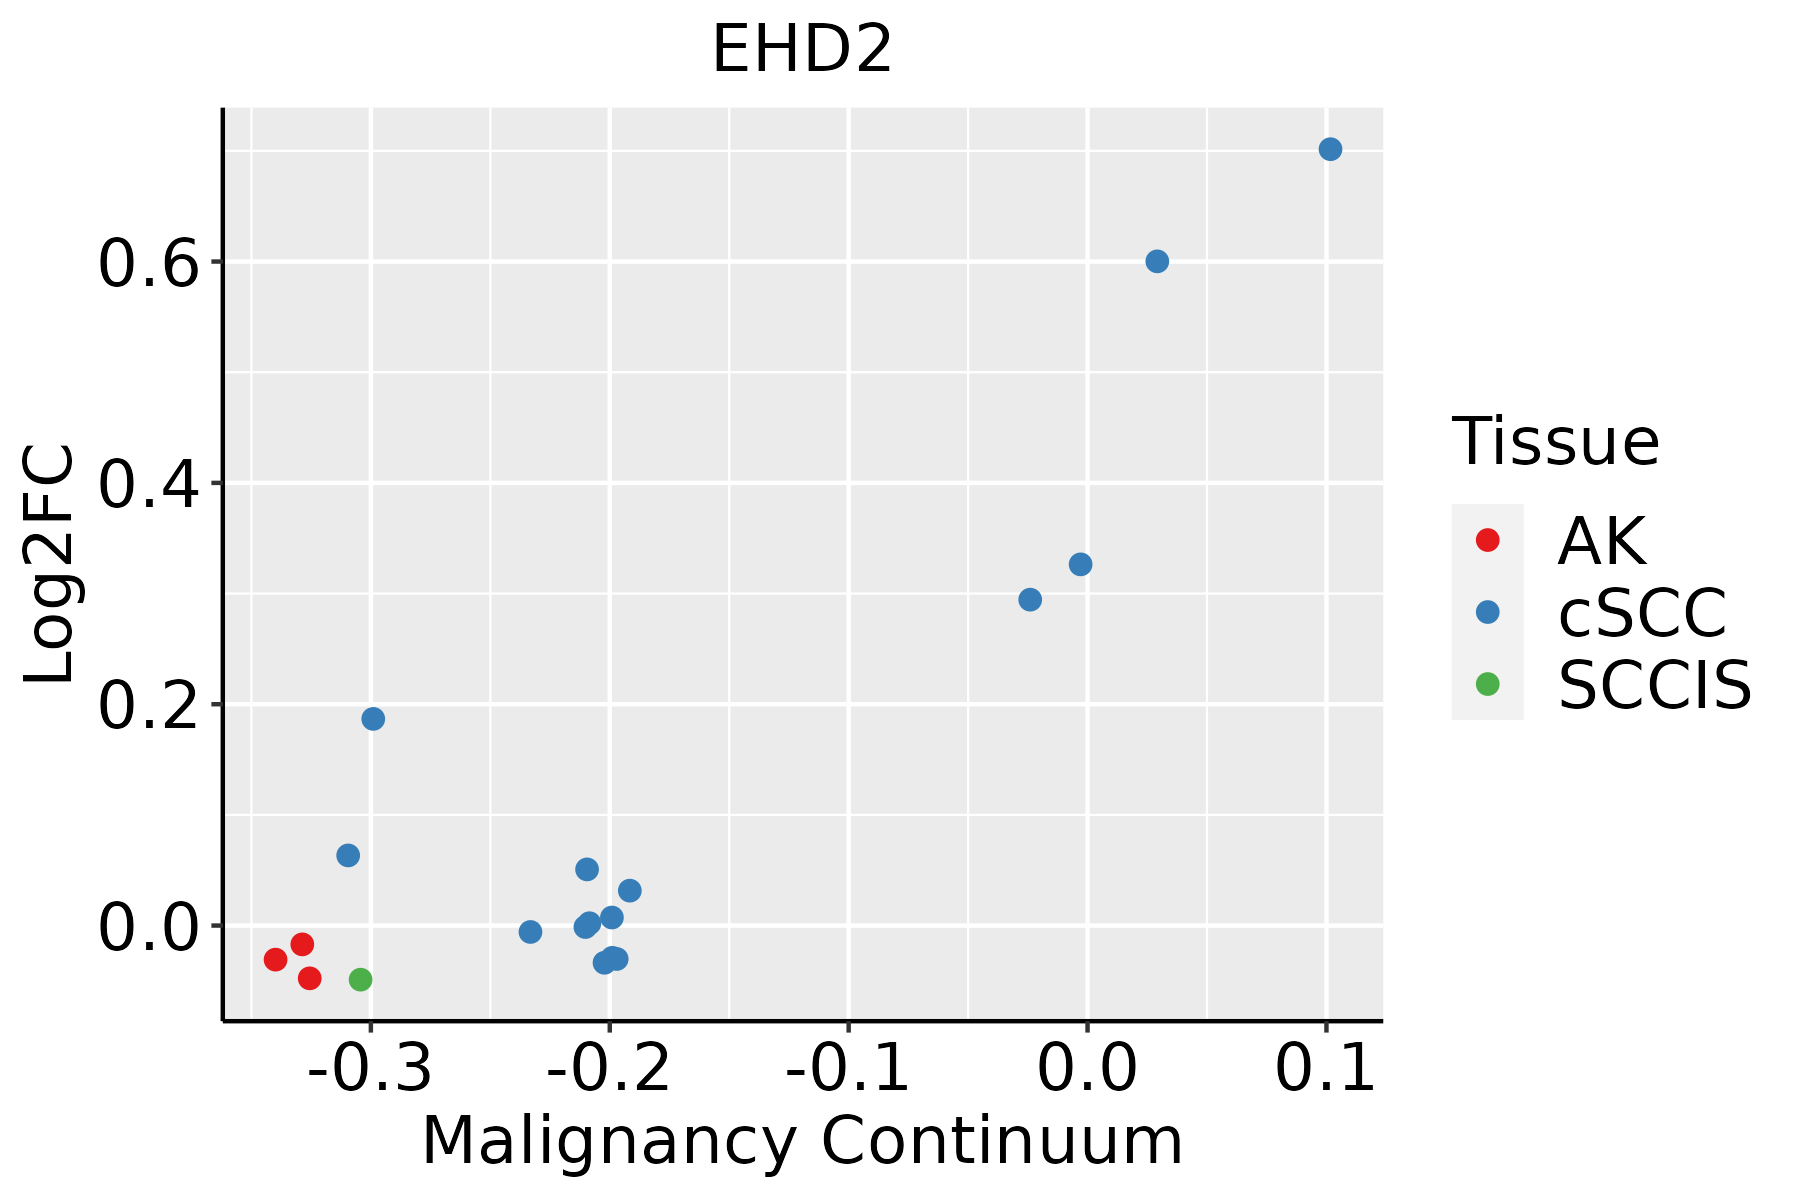 | AK: Actinic keratosis |
| cSCC: Cutaneous squamous cell carcinoma | ||
| SCCIS:squamous cell carcinoma in situ | ||
| Thyroid | 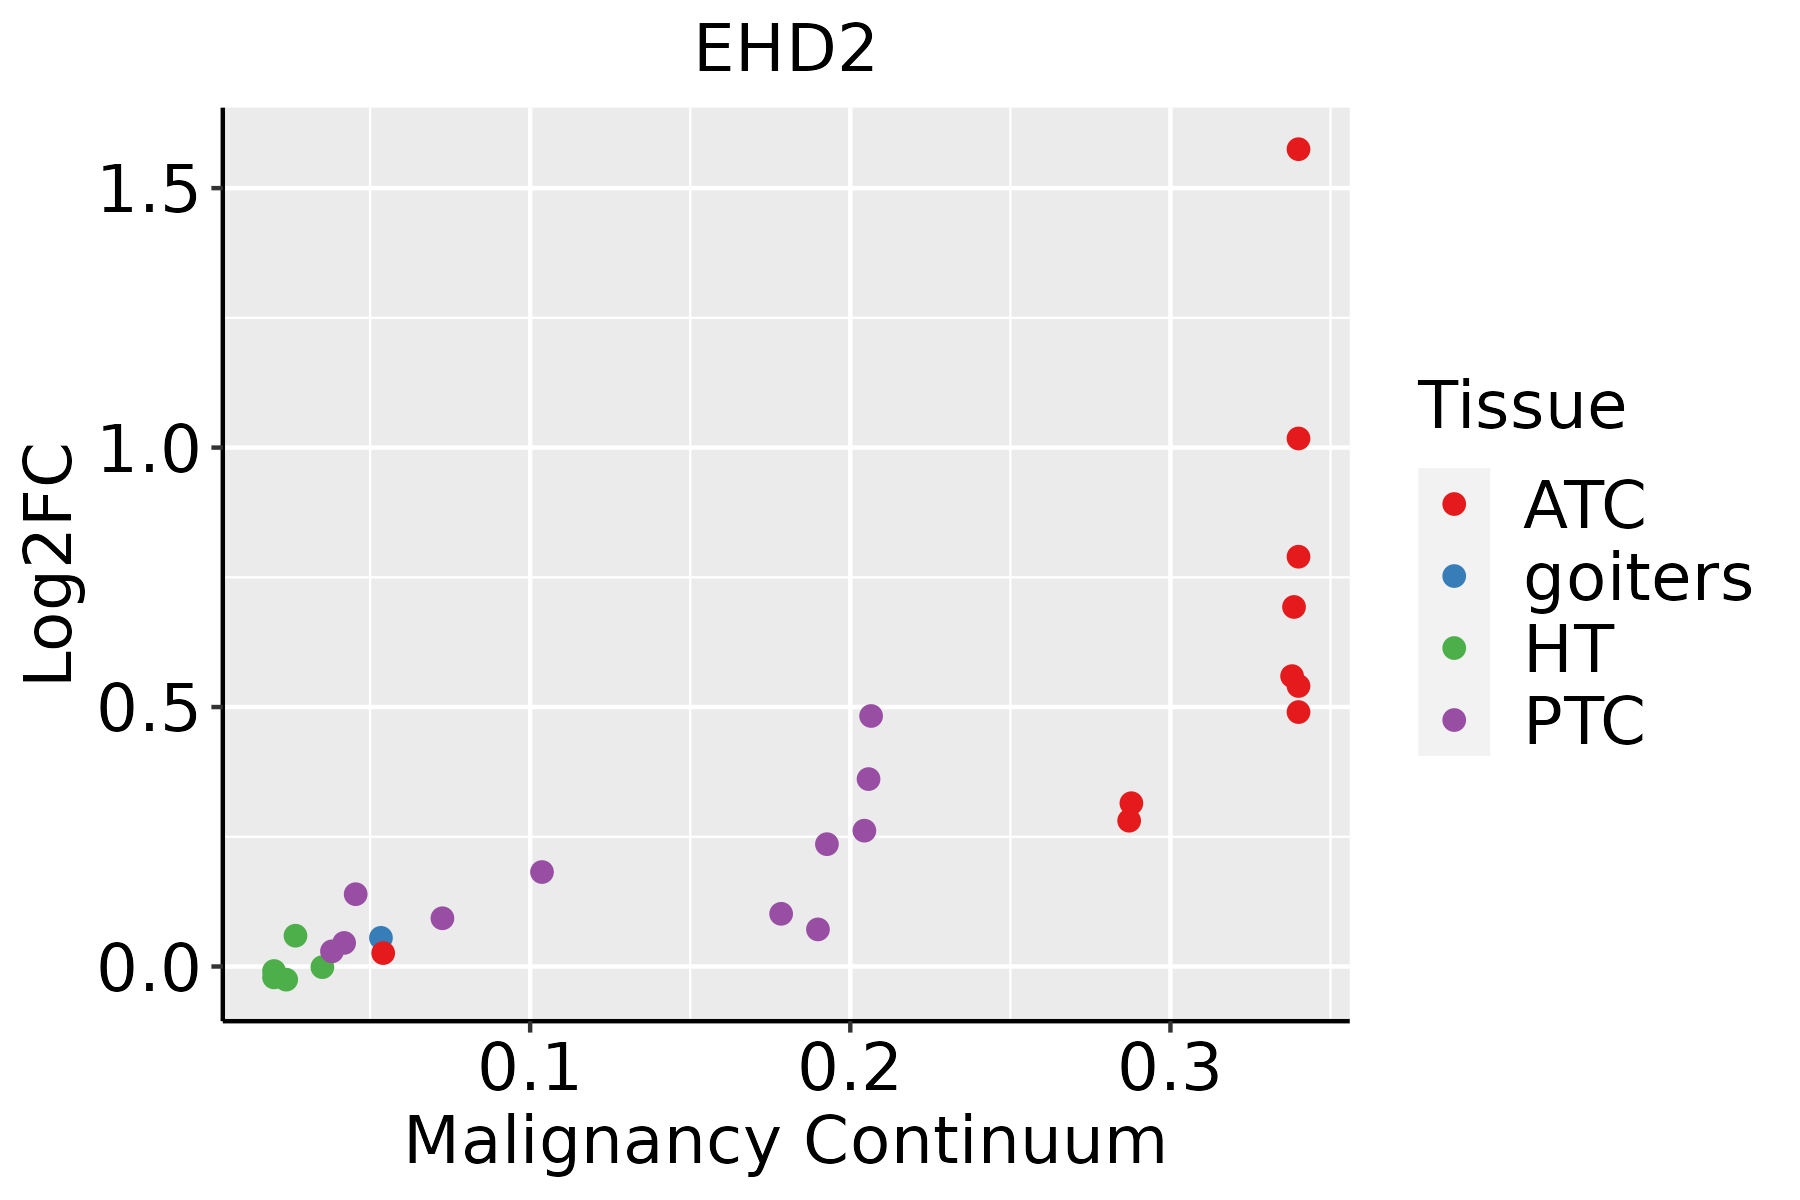 | ATC: Anaplastic thyroid cancer |
| HT: Hashimoto's thyroiditis | ||
| PTC: Papillary thyroid cancer |
| ∗log2FC in expression of this searched gene in stem-like cells from each diseased tissue sample relative to stem-like cells in normal samples in each tissue plotted against the malignancy continuum. Samples are colored based on if they are from different disease stage. |
Top |
Malignant transformation related pathway analysis |
| Find out the enriched GO biological processes and KEGG pathways involved in transition from healthy to precancer to cancer |
| Tissue | Disease Stage | Enriched GO biological Processes |
| Colorectum | AD |  |
| Colorectum | SER |  |
| Colorectum | MSS |  |
| Colorectum | MSI-H |  |
| Colorectum | FAP |  |
| ∗Top 15 enriched GO BP terms are showed in the bar plot of each disease state in each tissue. Each row represents a significant GO biological process which is colored according to the -log10(p.adjust). |
| Page: 1 2 3 4 5 6 7 8 9 |
| GO ID | Tissue | Disease Stage | Description | Gene Ratio | Bg Ratio | pvalue | p.adjust | Count |
| GO:001619717 | Skin | cSCC | endosomal transport | 98/4864 | 230/18723 | 2.71e-08 | 7.41e-07 | 98 |
| GO:009887617 | Skin | cSCC | vesicle-mediated transport to the plasma membrane | 59/4864 | 136/18723 | 7.60e-06 | 1.04e-04 | 59 |
| GO:003086519 | Skin | cSCC | cortical cytoskeleton organization | 29/4864 | 61/18723 | 2.33e-04 | 1.91e-03 | 29 |
| GO:003086615 | Skin | cSCC | cortical actin cytoskeleton organization | 18/4864 | 40/18723 | 7.10e-03 | 3.40e-02 | 18 |
| GO:0032386111 | Thyroid | PTC | regulation of intracellular transport | 202/5968 | 337/18723 | 1.12e-26 | 3.93e-24 | 202 |
| GO:0032388112 | Thyroid | PTC | positive regulation of intracellular transport | 132/5968 | 202/18723 | 1.10e-22 | 2.57e-20 | 132 |
| GO:0072659112 | Thyroid | PTC | protein localization to plasma membrane | 153/5968 | 284/18723 | 9.90e-15 | 6.50e-13 | 153 |
| GO:1990778111 | Thyroid | PTC | protein localization to cell periphery | 172/5968 | 333/18723 | 3.71e-14 | 2.30e-12 | 172 |
| GO:001619718 | Thyroid | PTC | endosomal transport | 128/5968 | 230/18723 | 6.26e-14 | 3.52e-12 | 128 |
| GO:009887618 | Thyroid | PTC | vesicle-mediated transport to the plasma membrane | 74/5968 | 136/18723 | 4.20e-08 | 9.08e-07 | 74 |
| GO:0030865110 | Thyroid | PTC | cortical cytoskeleton organization | 38/5968 | 61/18723 | 9.77e-07 | 1.46e-05 | 38 |
| GO:003086616 | Thyroid | PTC | cortical actin cytoskeleton organization | 25/5968 | 40/18723 | 6.51e-05 | 5.72e-04 | 25 |
| GO:00973202 | Thyroid | PTC | plasma membrane tubulation | 13/5968 | 20/18723 | 2.37e-03 | 1.24e-02 | 13 |
| GO:003238632 | Thyroid | ATC | regulation of intracellular transport | 203/6293 | 337/18723 | 6.16e-24 | 1.85e-21 | 203 |
| GO:003238825 | Thyroid | ATC | positive regulation of intracellular transport | 131/6293 | 202/18723 | 8.20e-20 | 1.24e-17 | 131 |
| GO:007265928 | Thyroid | ATC | protein localization to plasma membrane | 161/6293 | 284/18723 | 8.45e-16 | 6.52e-14 | 161 |
| GO:199077826 | Thyroid | ATC | protein localization to cell periphery | 181/6293 | 333/18723 | 3.72e-15 | 2.56e-13 | 181 |
| GO:001619719 | Thyroid | ATC | endosomal transport | 128/6293 | 230/18723 | 4.44e-12 | 1.75e-10 | 128 |
| GO:009887619 | Thyroid | ATC | vesicle-mediated transport to the plasma membrane | 77/6293 | 136/18723 | 2.86e-08 | 5.43e-07 | 77 |
| GO:003086523 | Thyroid | ATC | cortical cytoskeleton organization | 41/6293 | 61/18723 | 8.28e-08 | 1.43e-06 | 41 |
| Page: 1 2 3 4 |
| Pathway ID | Tissue | Disease Stage | Description | Gene Ratio | Bg Ratio | pvalue | p.adjust | qvalue | Count |
| hsa04144210 | Esophagus | ESCC | Endocytosis | 186/4205 | 251/8465 | 9.74e-16 | 4.66e-14 | 2.39e-14 | 186 |
| hsa0414437 | Esophagus | ESCC | Endocytosis | 186/4205 | 251/8465 | 9.74e-16 | 4.66e-14 | 2.39e-14 | 186 |
| hsa0414422 | Liver | HCC | Endocytosis | 178/4020 | 251/8465 | 2.03e-14 | 5.22e-13 | 2.91e-13 | 178 |
| hsa0414432 | Liver | HCC | Endocytosis | 178/4020 | 251/8465 | 2.03e-14 | 5.22e-13 | 2.91e-13 | 178 |
| hsa0414427 | Oral cavity | OSCC | Endocytosis | 174/3704 | 251/8465 | 9.42e-17 | 4.51e-15 | 2.29e-15 | 174 |
| hsa04144112 | Oral cavity | OSCC | Endocytosis | 174/3704 | 251/8465 | 9.42e-17 | 4.51e-15 | 2.29e-15 | 174 |
| hsa0414428 | Oral cavity | LP | Endocytosis | 121/2418 | 251/8465 | 1.89e-11 | 3.70e-10 | 2.38e-10 | 121 |
| hsa0414436 | Oral cavity | LP | Endocytosis | 121/2418 | 251/8465 | 1.89e-11 | 3.70e-10 | 2.38e-10 | 121 |
| Page: 1 |
Top |
Cell-cell communication analysis |
| Identification of potential cell-cell interactions between two cell types and their ligand-receptor pairs for different disease states |
| Ligand | Receptor | LRpair | Pathway | Tissue | Disease Stage |
| Page: 1 |
Top |
Single-cell gene regulatory network inference analysis |
| Find out the significant the regulons (TFs) and the target genes of each regulon across cell types for different disease states |
| TF | Cell Type | Tissue | Disease Stage | Target Gene | RSS | Regulon Activity |
| ∗The dot plots of a searched regulon are shown for all cell subpopulations in each disease state of each tissue based on the regulon specific score inferred using pySCENIC and by calculating the average expression. |
| Page: 1 |
Top |
Somatic mutation of malignant transformation related genes |
| Annotation of somatic variants for genes involved in malignant transformation |
| Hugo Symbol | Variant Class | Variant Classification | dbSNP RS | HGVSc | HGVSp | HGVSp Short | SWISSPROT | BIOTYPE | SIFT | PolyPhen | Tumor Sample Barcode | Tissue | Histology | Sex | Age | Stage | Therapy Types | Drugs | Outcome |
| EHD2 | SNV | Missense_Mutation | c.666C>G | p.Asp222Glu | p.D222E | Q9NZN4 | protein_coding | deleterious(0) | probably_damaging(0.966) | TCGA-B6-A0RE-01 | Breast | breast invasive carcinoma | Female | <65 | I/II | Unknown | Unknown | SD | |
| EHD2 | SNV | Missense_Mutation | novel | c.1114N>T | p.His372Tyr | p.H372Y | Q9NZN4 | protein_coding | deleterious(0.03) | benign(0.396) | TCGA-BH-A0B6-01 | Breast | breast invasive carcinoma | Female | <65 | I/II | Unknown | Unknown | SD |
| EHD2 | SNV | Missense_Mutation | novel | c.1525G>A | p.Ala509Thr | p.A509T | Q9NZN4 | protein_coding | deleterious(0) | probably_damaging(0.998) | TCGA-BH-A0RX-01 | Breast | breast invasive carcinoma | Female | <65 | I/II | Chemotherapy | fluorouracil | SD |
| EHD2 | SNV | Missense_Mutation | c.956C>T | p.Pro319Leu | p.P319L | Q9NZN4 | protein_coding | deleterious(0) | probably_damaging(0.984) | TCGA-C8-A12U-01 | Breast | breast invasive carcinoma | Female | <65 | I/II | Unknown | Unknown | SD | |
| EHD2 | SNV | Missense_Mutation | rs146188664 | c.457N>A | p.Asp153Asn | p.D153N | Q9NZN4 | protein_coding | deleterious(0.01) | probably_damaging(0.995) | TCGA-2W-A8YY-01 | Cervix | cervical & endocervical cancer | Female | <65 | I/II | Chemotherapy | cisplatin | CR |
| EHD2 | SNV | Missense_Mutation | rs772336133 | c.1321N>A | p.Glu441Lys | p.E441K | Q9NZN4 | protein_coding | tolerated(0.06) | benign(0.029) | TCGA-DG-A2KM-01 | Cervix | cervical & endocervical cancer | Female | <65 | I/II | Chemotherapy | cisplatin | SD |
| EHD2 | SNV | Missense_Mutation | novel | c.922N>A | p.Ala308Thr | p.A308T | Q9NZN4 | protein_coding | deleterious(0.01) | possibly_damaging(0.51) | TCGA-MA-AA42-01 | Cervix | cervical & endocervical cancer | Female | >=65 | I/II | Unknown | Unknown | SD |
| EHD2 | SNV | Missense_Mutation | novel | c.820G>A | p.Glu274Lys | p.E274K | Q9NZN4 | protein_coding | deleterious(0) | benign(0.327) | TCGA-VS-A958-01 | Cervix | cervical & endocervical cancer | Female | <65 | I/II | Chemotherapy | cisplatin | CR |
| EHD2 | SNV | Missense_Mutation | c.608N>A | p.Ala203Asp | p.A203D | Q9NZN4 | protein_coding | deleterious(0) | possibly_damaging(0.616) | TCGA-AA-3715-01 | Colorectum | colon adenocarcinoma | Male | >=65 | I/II | Unknown | Unknown | PD | |
| EHD2 | SNV | Missense_Mutation | c.865G>A | p.Ala289Thr | p.A289T | Q9NZN4 | protein_coding | deleterious(0.03) | benign(0.135) | TCGA-AA-3864-01 | Colorectum | colon adenocarcinoma | Male | >=65 | I/II | Unknown | Unknown | SD |
| Page: 1 2 3 4 5 6 7 8 |
Top |
Related drugs of malignant transformation related genes |
| Identification of chemicals and drugs interact with genes involved in malignant transfromation |
| (DGIdb 4.0) |
| Entrez ID | Symbol | Category | Interaction Types | Drug Claim Name | Drug Name | PMIDs |
| Page: 1 |

Copyright 2023-Present -The University of Texas Health Science Center at Houston |