
|
|||||
|
 | |
| |
| |
| |
| |
| |
|
Gene: ECH1 |
Gene summary for ECH1 |
| Gene information | Species | Human | Gene symbol | ECH1 | Gene ID | 1891 |
| Gene name | enoyl-CoA hydratase 1 | |
| Gene Alias | HPXEL | |
| Cytomap | 19q13.2 | |
| Gene Type | protein-coding | GO ID | GO:0006082 | UniProtAcc | Q13011 |
Top |
Malignant transformation analysis |
| Identification of the aberrant gene expression in precancerous and cancerous lesions by comparing the gene expression of stem-like cells in diseased tissues with normal stem cells |
| Entrez ID | Symbol | Replicates | Species | Organ | Tissue | Adj P-value | Log2FC | Malignancy |
| 1891 | ECH1 | HTA11_3410_2000001011 | Human | Colorectum | AD | 9.87e-23 | 5.06e-01 | 0.0155 |
| 1891 | ECH1 | HTA11_2487_2000001011 | Human | Colorectum | SER | 1.56e-28 | 9.11e-01 | -0.1808 |
| 1891 | ECH1 | HTA11_2951_2000001011 | Human | Colorectum | AD | 3.48e-13 | 7.92e-01 | 0.0216 |
| 1891 | ECH1 | HTA11_1938_2000001011 | Human | Colorectum | AD | 4.57e-21 | 9.49e-01 | -0.0811 |
| 1891 | ECH1 | HTA11_78_2000001011 | Human | Colorectum | AD | 8.23e-17 | 6.35e-01 | -0.1088 |
| 1891 | ECH1 | HTA11_347_2000001011 | Human | Colorectum | AD | 1.35e-56 | 1.24e+00 | -0.1954 |
| 1891 | ECH1 | HTA11_411_2000001011 | Human | Colorectum | SER | 2.74e-17 | 1.51e+00 | -0.2602 |
| 1891 | ECH1 | HTA11_2112_2000001011 | Human | Colorectum | SER | 1.64e-06 | 8.98e-01 | -0.2196 |
| 1891 | ECH1 | HTA11_3361_2000001011 | Human | Colorectum | AD | 4.79e-22 | 9.36e-01 | -0.1207 |
| 1891 | ECH1 | HTA11_83_2000001011 | Human | Colorectum | SER | 1.02e-17 | 8.96e-01 | -0.1526 |
| 1891 | ECH1 | HTA11_696_2000001011 | Human | Colorectum | AD | 1.02e-51 | 1.04e+00 | -0.1464 |
| 1891 | ECH1 | HTA11_866_2000001011 | Human | Colorectum | AD | 2.37e-33 | 7.84e-01 | -0.1001 |
| 1891 | ECH1 | HTA11_1391_2000001011 | Human | Colorectum | AD | 1.77e-36 | 1.19e+00 | -0.059 |
| 1891 | ECH1 | HTA11_2992_2000001011 | Human | Colorectum | SER | 1.12e-20 | 1.22e+00 | -0.1706 |
| 1891 | ECH1 | HTA11_5212_2000001011 | Human | Colorectum | AD | 2.25e-19 | 9.62e-01 | -0.2061 |
| 1891 | ECH1 | HTA11_5216_2000001011 | Human | Colorectum | SER | 2.03e-14 | 9.53e-01 | -0.1462 |
| 1891 | ECH1 | HTA11_546_2000001011 | Human | Colorectum | AD | 7.06e-18 | 9.09e-01 | -0.0842 |
| 1891 | ECH1 | HTA11_9341_2000001011 | Human | Colorectum | SER | 3.06e-10 | 9.82e-01 | -0.00410000000000005 |
| 1891 | ECH1 | HTA11_7862_2000001011 | Human | Colorectum | AD | 2.54e-24 | 1.07e+00 | -0.0179 |
| 1891 | ECH1 | HTA11_866_3004761011 | Human | Colorectum | AD | 5.24e-27 | 7.49e-01 | 0.096 |
| Page: 1 2 3 4 5 6 7 8 9 10 11 |
| Tissue | Expression Dynamics | Abbreviation |
| Colorectum (GSE201348) |  | FAP: Familial adenomatous polyposis |
| CRC: Colorectal cancer | ||
| Colorectum (HTA11) |  | AD: Adenomas |
| SER: Sessile serrated lesions | ||
| MSI-H: Microsatellite-high colorectal cancer | ||
| MSS: Microsatellite stable colorectal cancer | ||
| Endometrium | 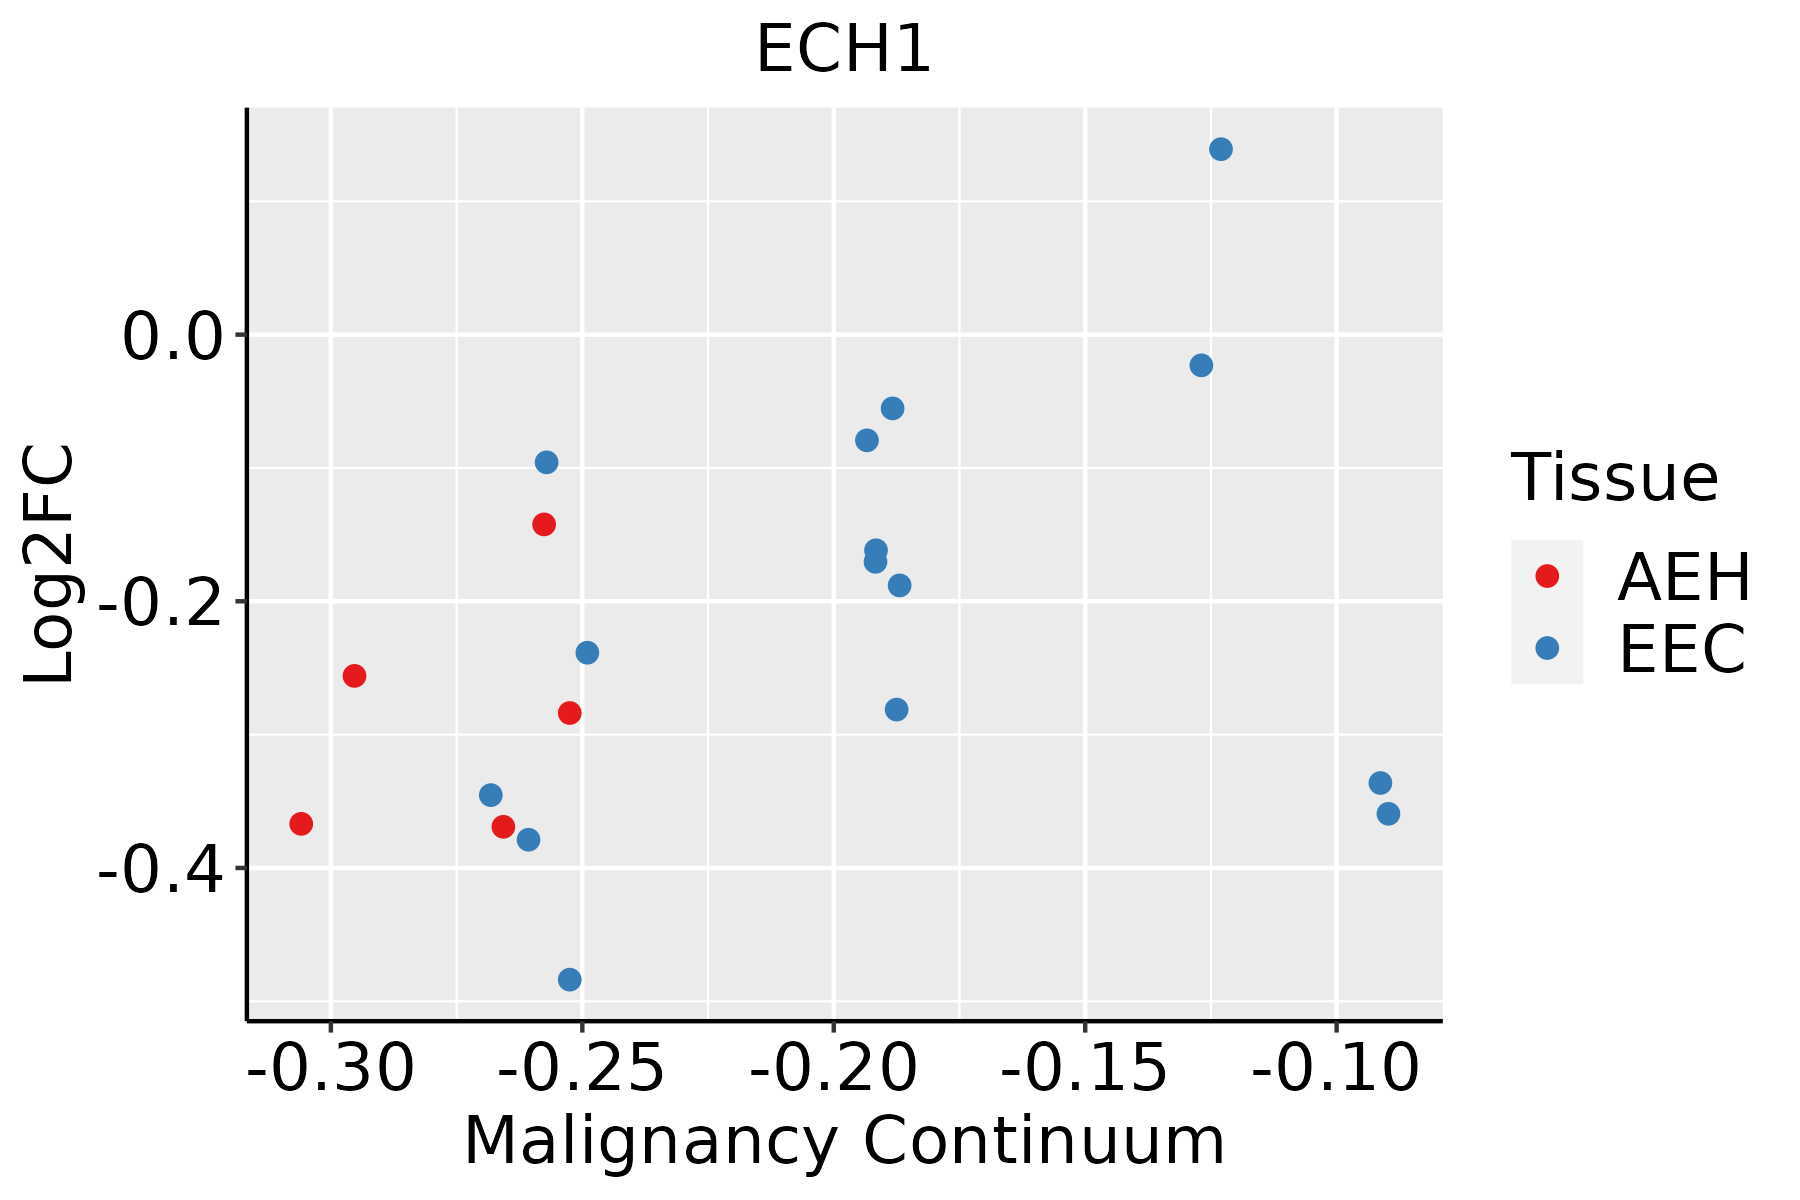 | AEH: Atypical endometrial hyperplasia |
| EEC: Endometrioid Cancer | ||
| Esophagus | 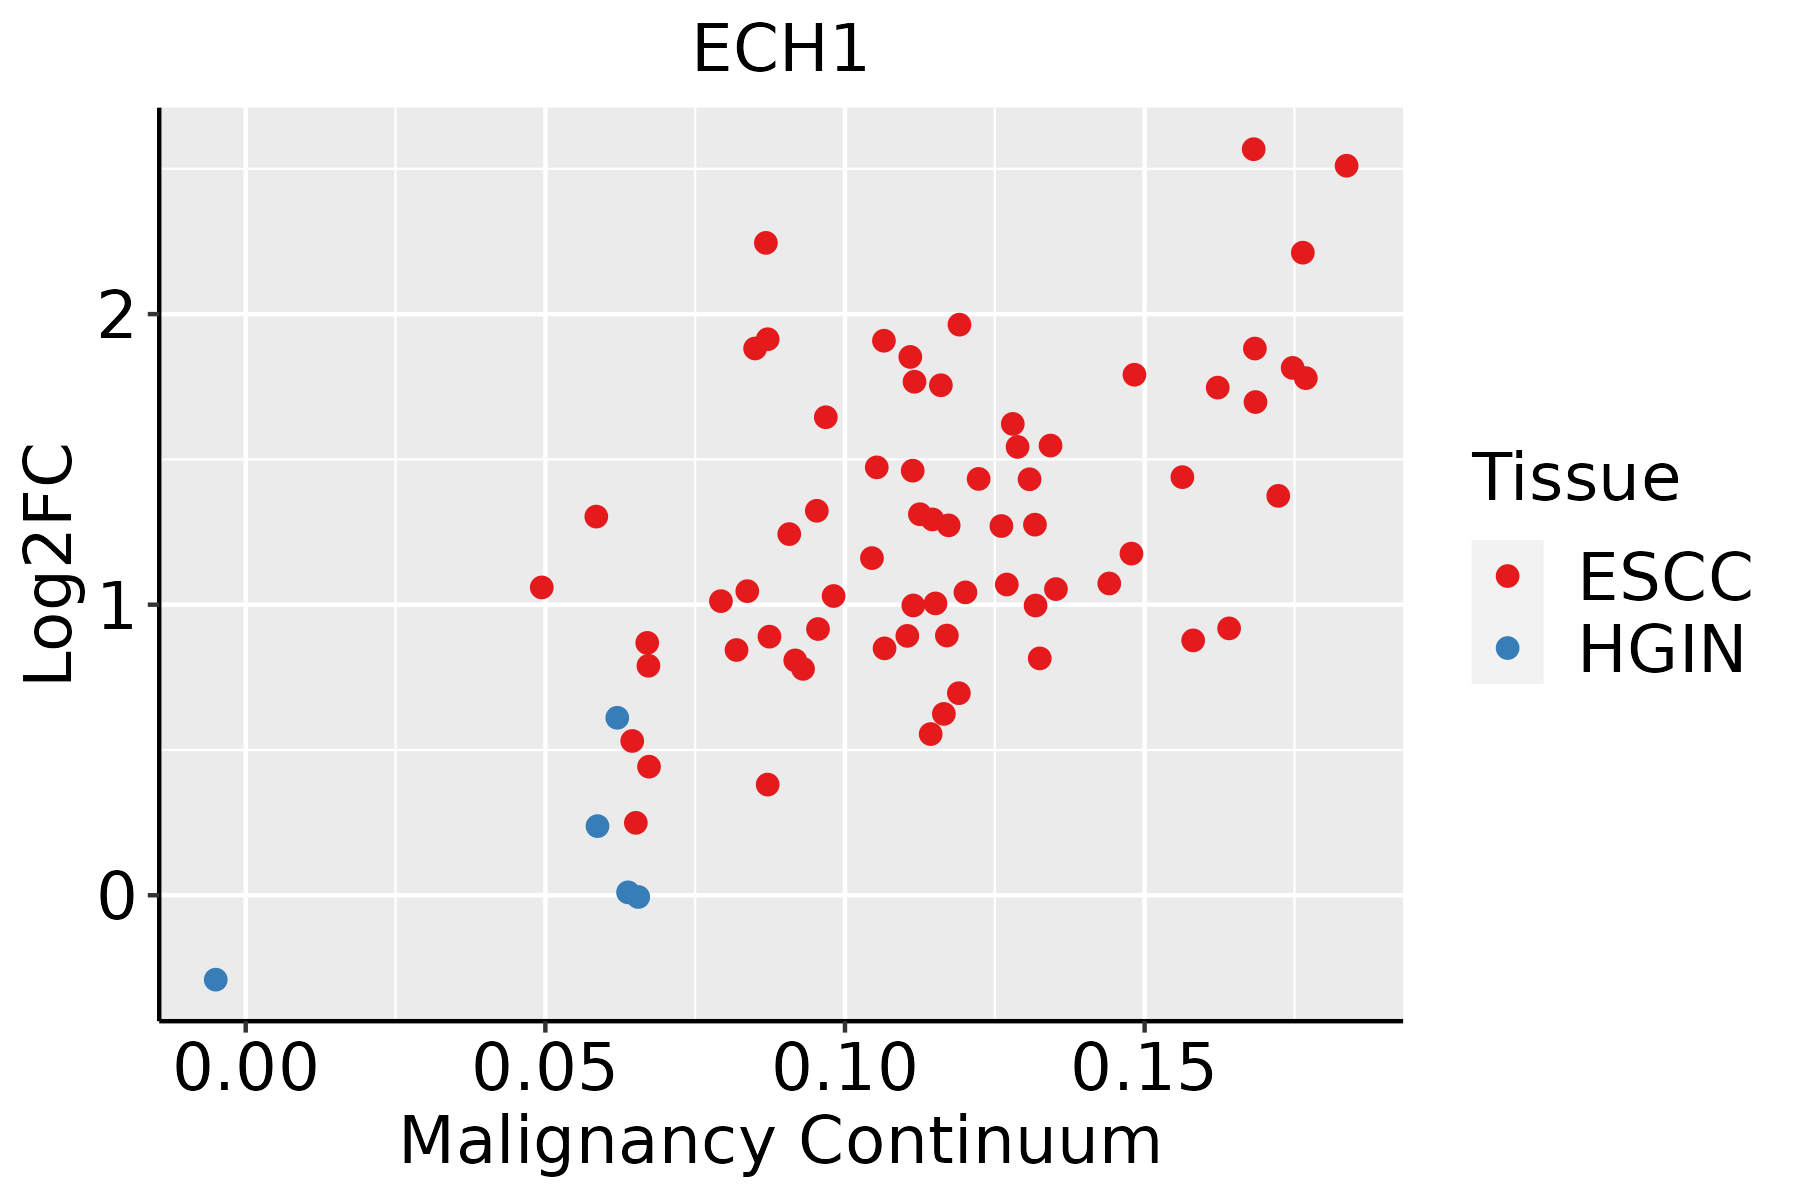 | ESCC: Esophageal squamous cell carcinoma |
| HGIN: High-grade intraepithelial neoplasias | ||
| LGIN: Low-grade intraepithelial neoplasias | ||
| GC | 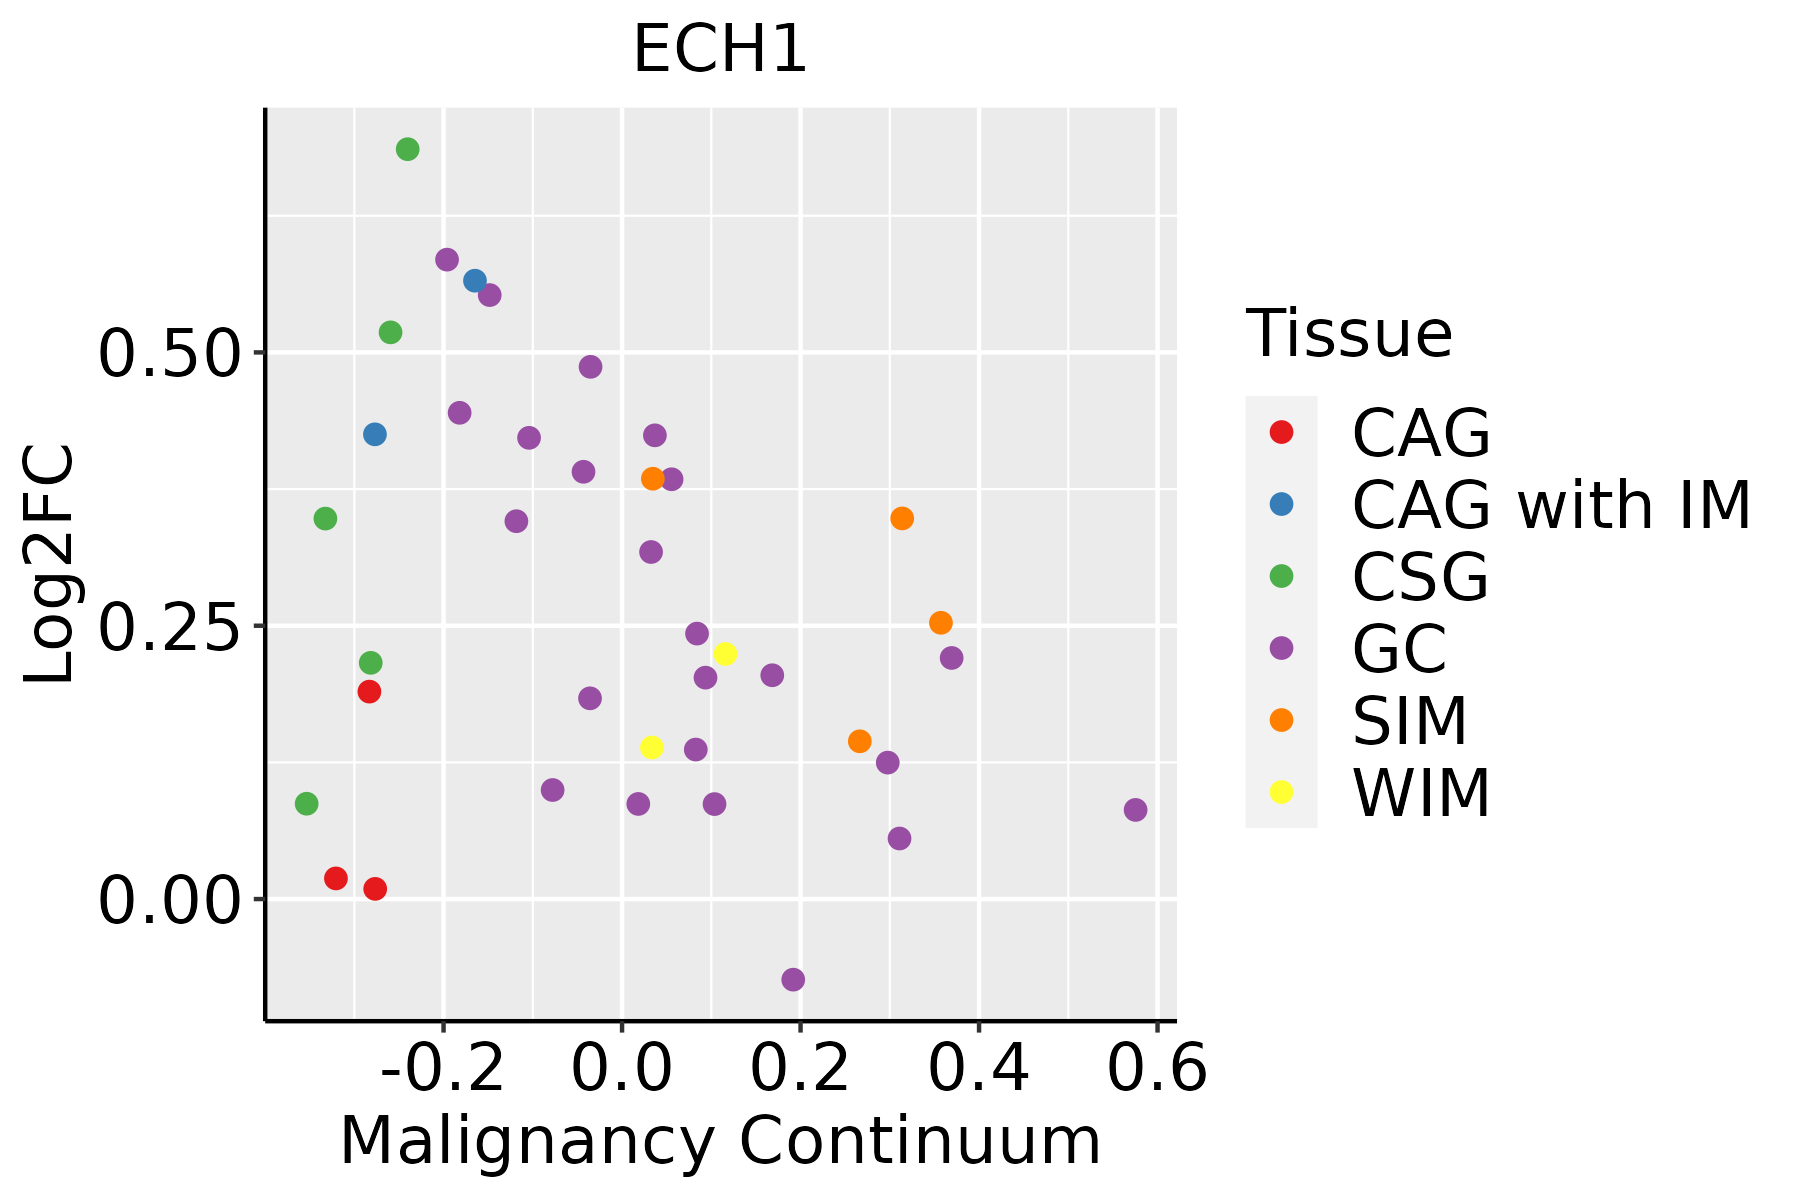 | CAG: Chronic atrophic gastritis |
| CAG with IM: Chronic atrophic gastritis with intestinal metaplasia | ||
| CSG: Chronic superficial gastritis | ||
| GC: Gastric cancer | ||
| SIM: Severe intestinal metaplasia | ||
| WIM: Wild intestinal metaplasia | ||
| Liver | 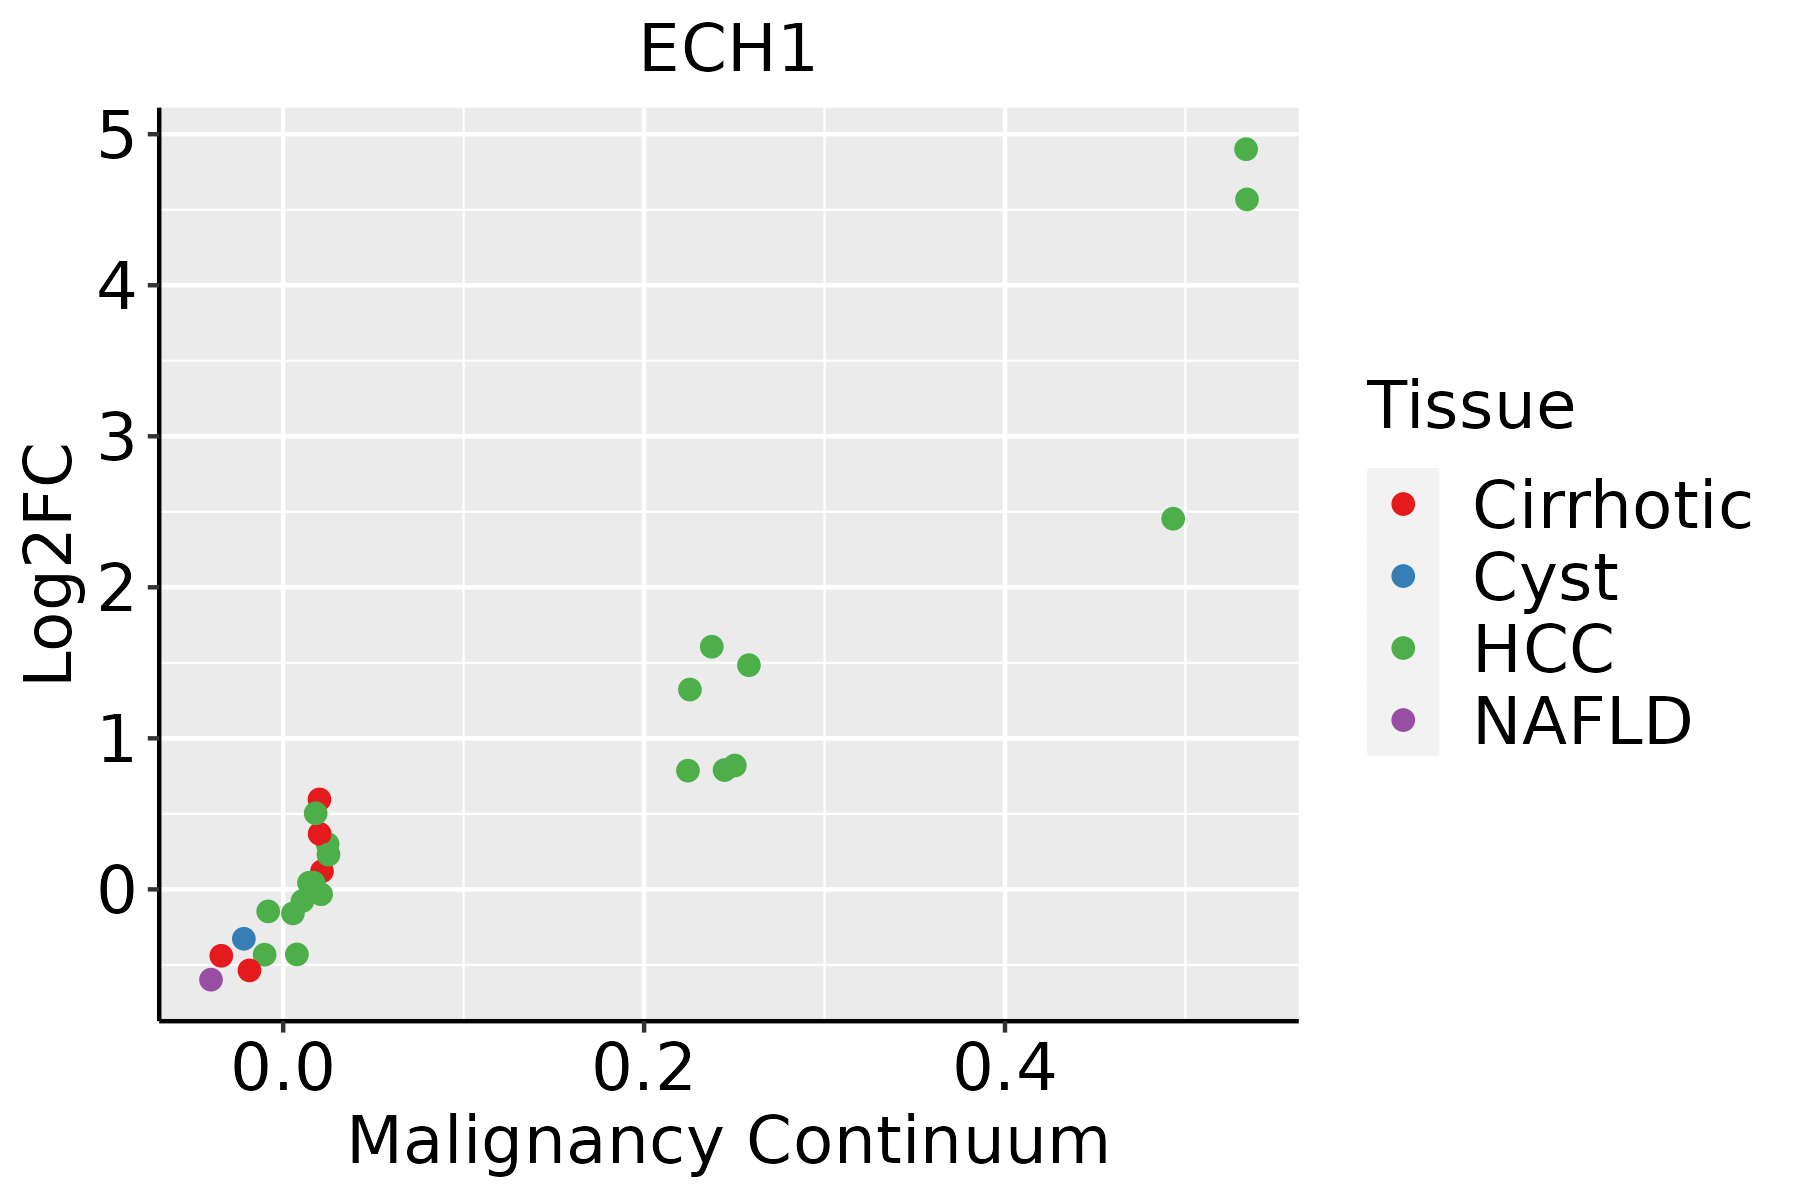 | HCC: Hepatocellular carcinoma |
| NAFLD: Non-alcoholic fatty liver disease | ||
| Oral Cavity | 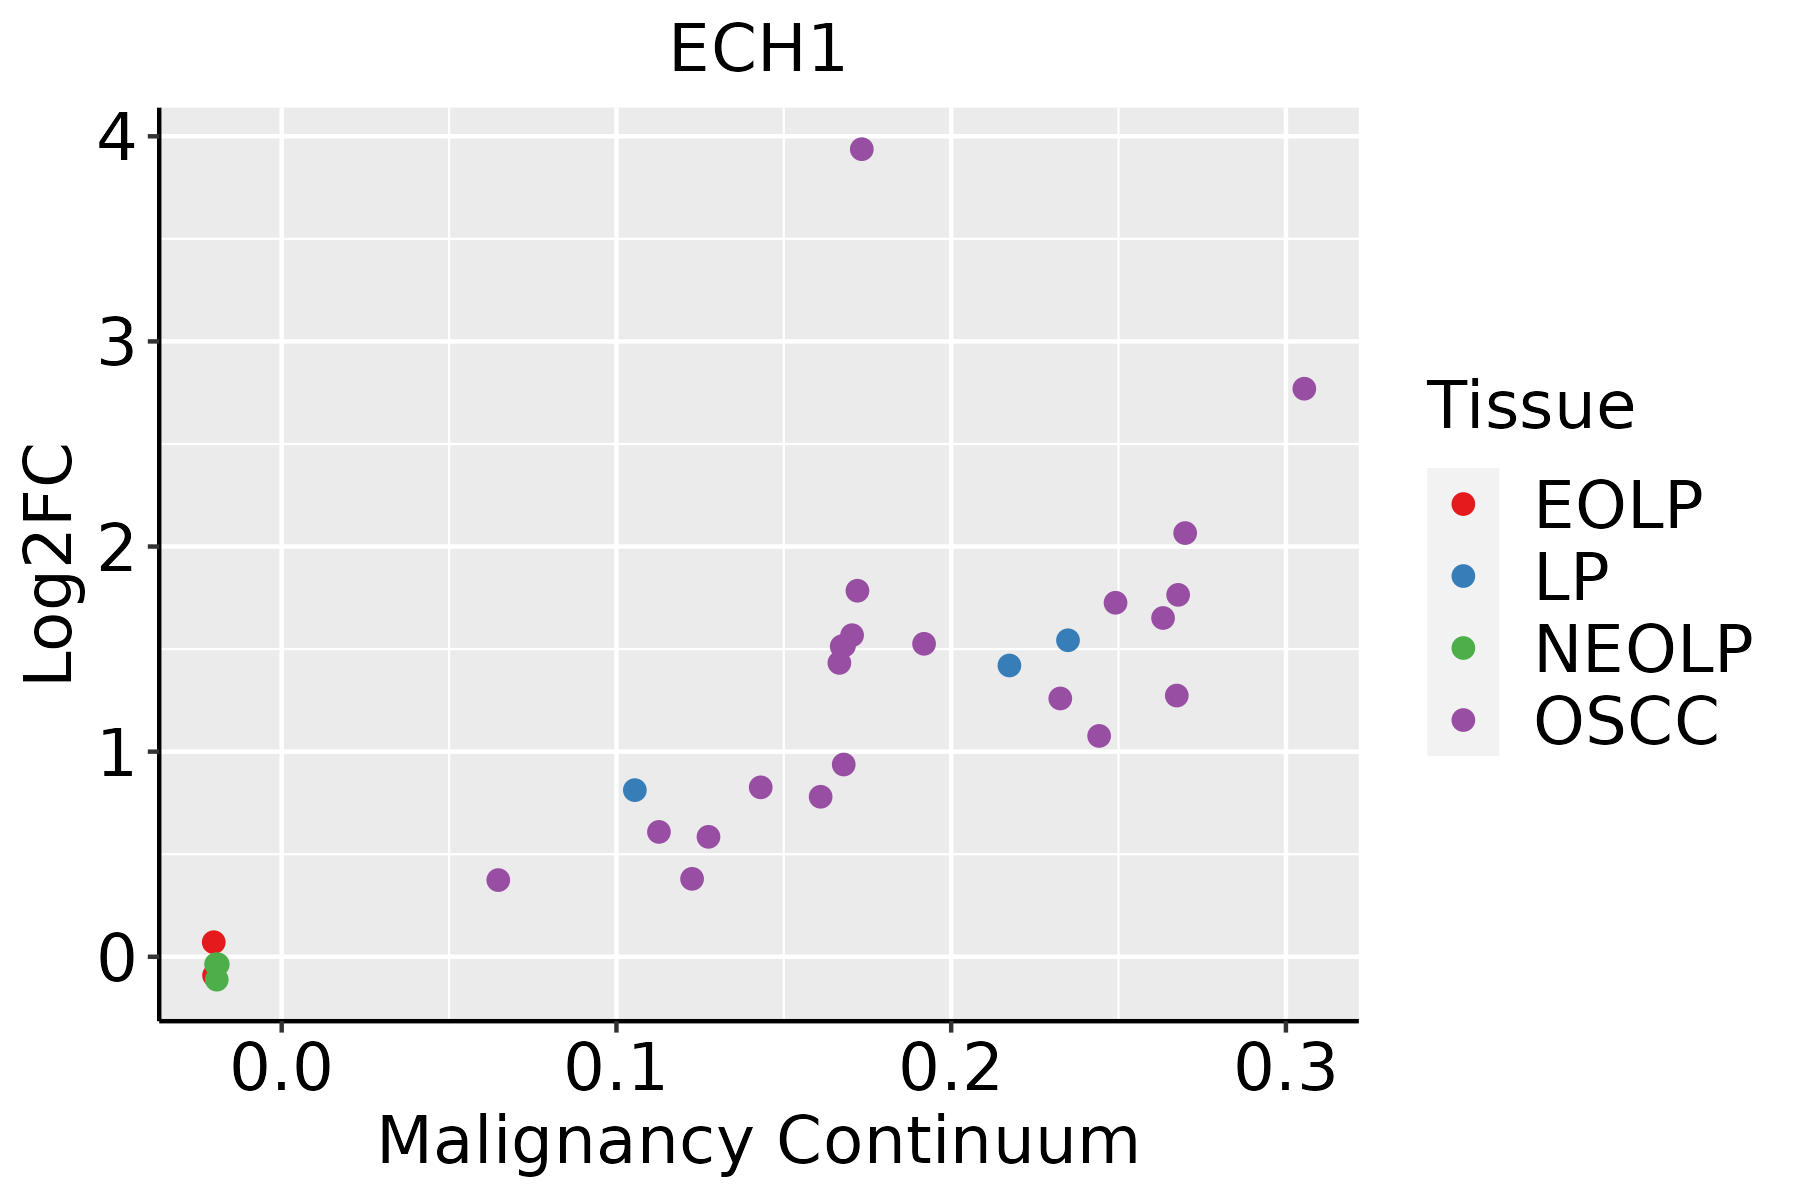 | EOLP: Erosive Oral lichen planus |
| LP: leukoplakia | ||
| NEOLP: Non-erosive oral lichen planus | ||
| OSCC: Oral squamous cell carcinoma | ||
| Skin | 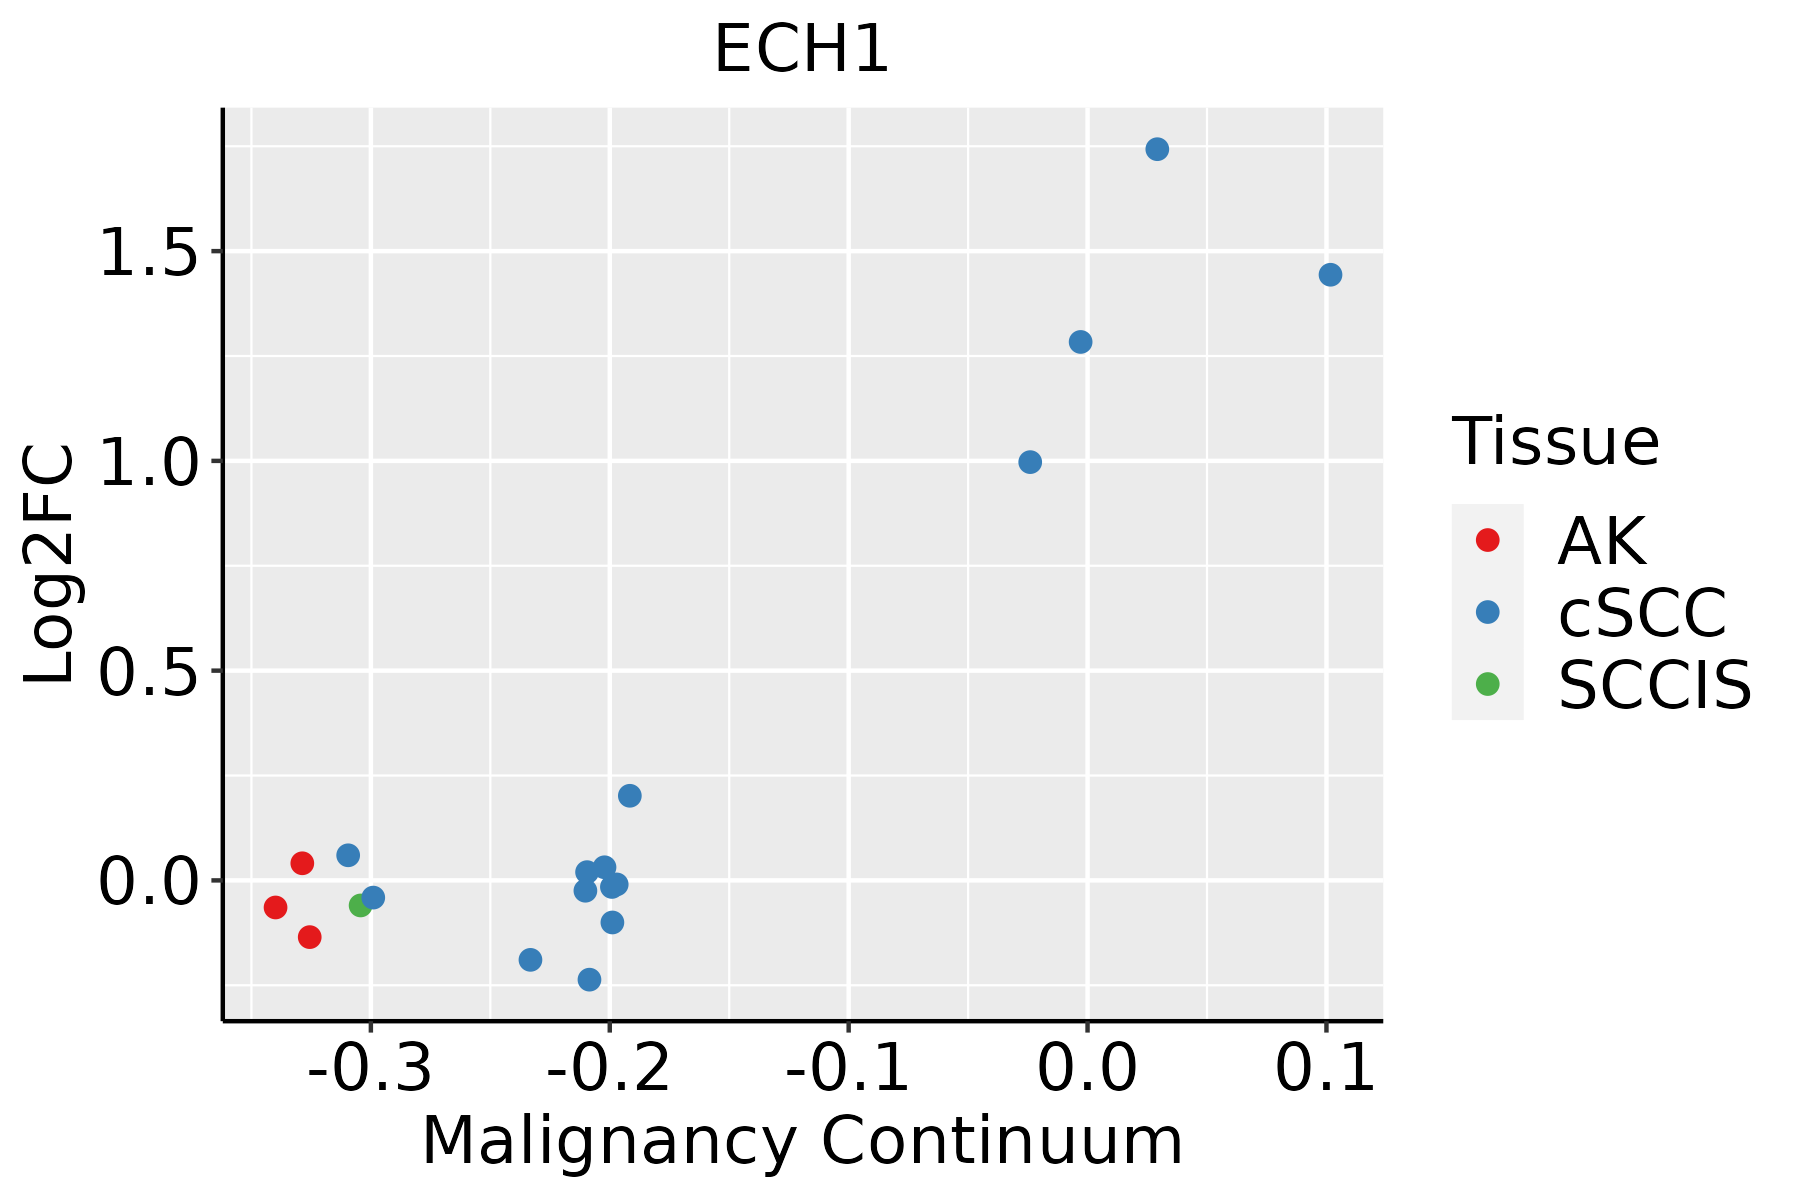 | AK: Actinic keratosis |
| cSCC: Cutaneous squamous cell carcinoma | ||
| SCCIS:squamous cell carcinoma in situ | ||
| Thyroid | 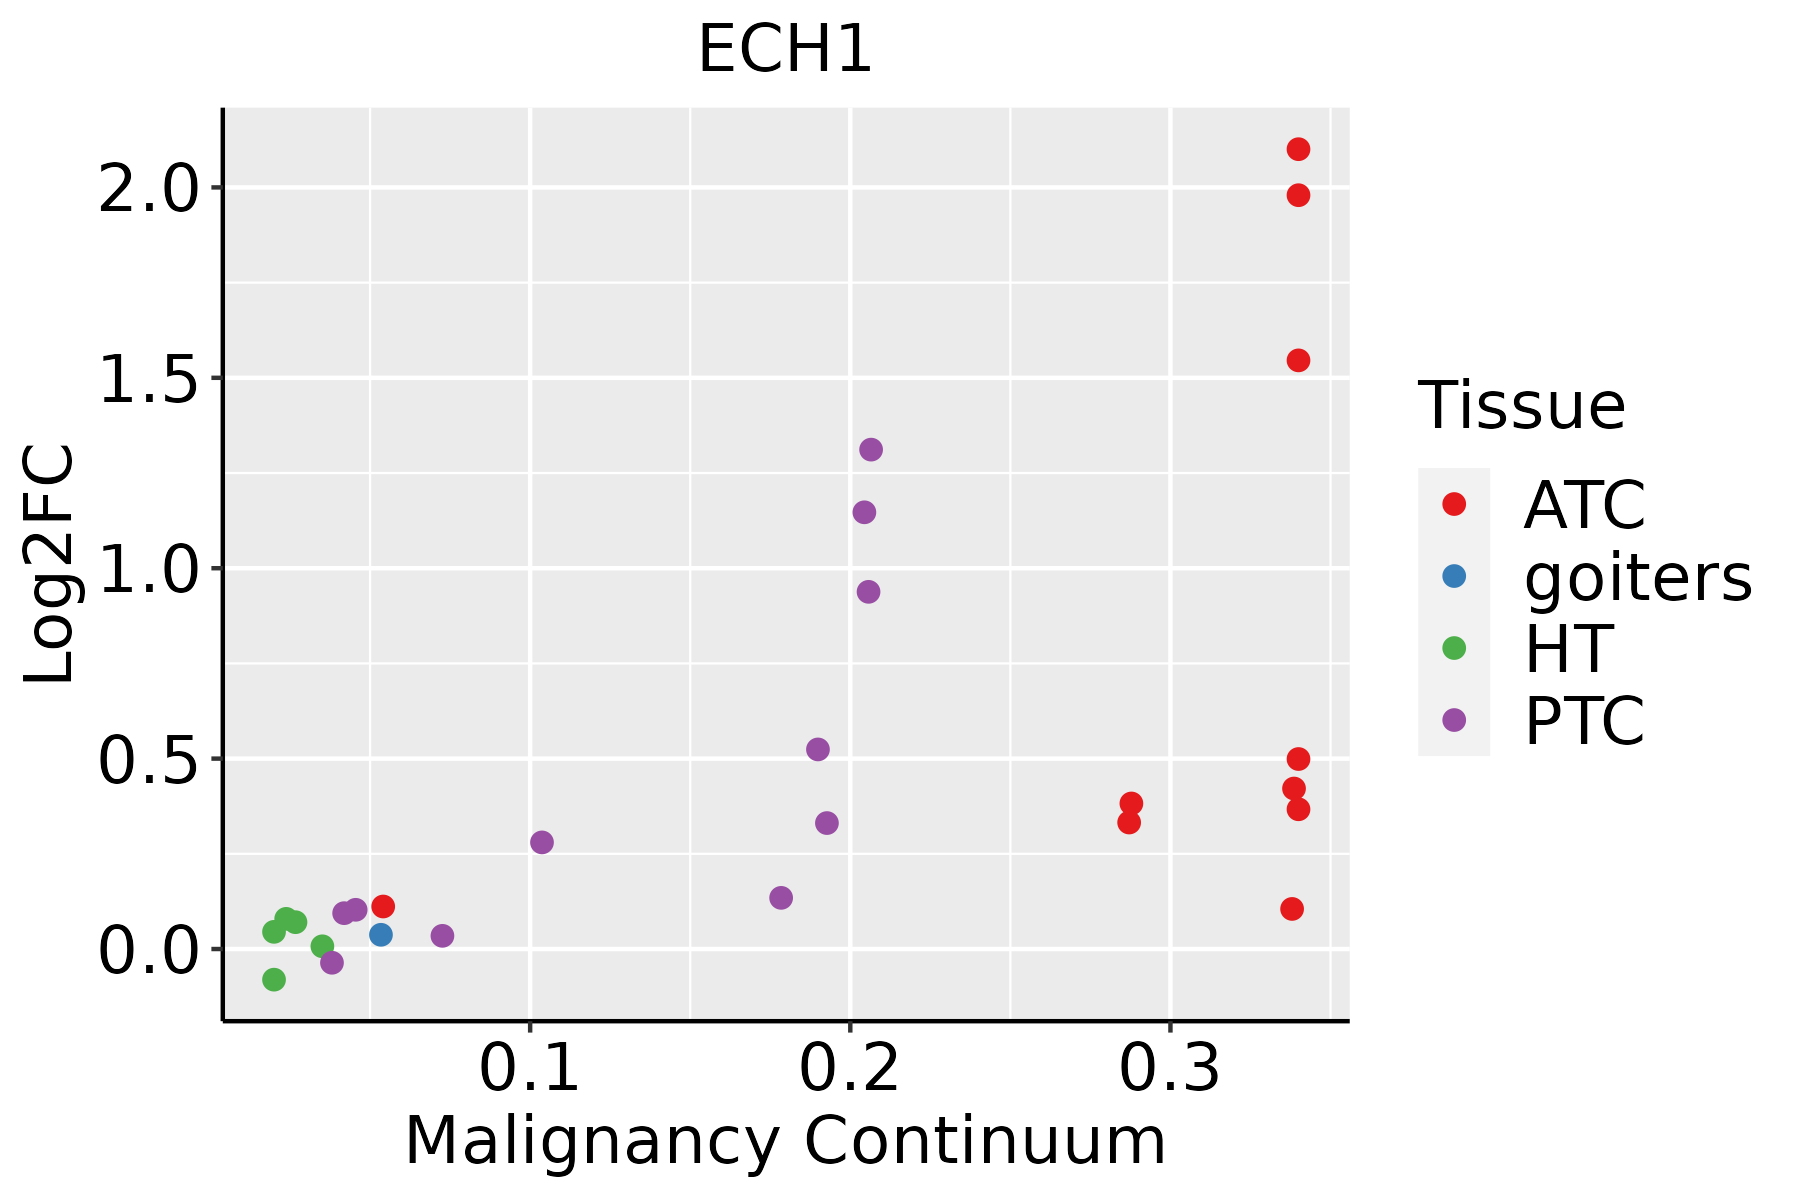 | ATC: Anaplastic thyroid cancer |
| HT: Hashimoto's thyroiditis | ||
| PTC: Papillary thyroid cancer |
| ∗log2FC in expression of this searched gene in stem-like cells from each diseased tissue sample relative to stem-like cells in normal samples in each tissue plotted against the malignancy continuum. Samples are colored based on if they are from different disease stage. |
Top |
Malignant transformation related pathway analysis |
| Find out the enriched GO biological processes and KEGG pathways involved in transition from healthy to precancer to cancer |
| Tissue | Disease Stage | Enriched GO biological Processes |
| Colorectum | AD |  |
| Colorectum | SER |  |
| Colorectum | MSS |  |
| Colorectum | MSI-H |  |
| Colorectum | FAP |  |
| ∗Top 15 enriched GO BP terms are showed in the bar plot of each disease state in each tissue. Each row represents a significant GO biological process which is colored according to the -log10(p.adjust). |
| Page: 1 2 3 4 5 6 7 8 9 |
| GO ID | Tissue | Disease Stage | Description | Gene Ratio | Bg Ratio | pvalue | p.adjust | Count |
| GO:00302586 | Esophagus | ESCC | lipid modification | 116/8552 | 212/18723 | 4.90e-03 | 1.89e-02 | 116 |
| GO:00160427 | Esophagus | ESCC | lipid catabolic process | 168/8552 | 320/18723 | 7.97e-03 | 2.84e-02 | 168 |
| GO:000663112 | Liver | Cirrhotic | fatty acid metabolic process | 165/4634 | 390/18723 | 1.29e-14 | 1.26e-12 | 165 |
| GO:004428211 | Liver | Cirrhotic | small molecule catabolic process | 151/4634 | 376/18723 | 2.20e-11 | 1.34e-09 | 151 |
| GO:001605411 | Liver | Cirrhotic | organic acid catabolic process | 104/4634 | 240/18723 | 1.91e-10 | 9.53e-09 | 104 |
| GO:004639511 | Liver | Cirrhotic | carboxylic acid catabolic process | 102/4634 | 236/18723 | 3.41e-10 | 1.63e-08 | 102 |
| GO:001939512 | Liver | Cirrhotic | fatty acid oxidation | 53/4634 | 103/18723 | 4.73e-09 | 1.88e-07 | 53 |
| GO:003444011 | Liver | Cirrhotic | lipid oxidation | 53/4634 | 108/18723 | 3.85e-08 | 1.27e-06 | 53 |
| GO:007232911 | Liver | Cirrhotic | monocarboxylic acid catabolic process | 56/4634 | 122/18723 | 2.87e-07 | 7.01e-06 | 56 |
| GO:000906211 | Liver | Cirrhotic | fatty acid catabolic process | 48/4634 | 100/18723 | 3.87e-07 | 9.13e-06 | 48 |
| GO:000663512 | Liver | Cirrhotic | fatty acid beta-oxidation | 38/4634 | 74/18723 | 7.41e-07 | 1.57e-05 | 38 |
| GO:004424212 | Liver | Cirrhotic | cellular lipid catabolic process | 82/4634 | 214/18723 | 6.91e-06 | 1.08e-04 | 82 |
| GO:001604212 | Liver | Cirrhotic | lipid catabolic process | 112/4634 | 320/18723 | 2.31e-05 | 3.03e-04 | 112 |
| GO:003025811 | Liver | Cirrhotic | lipid modification | 75/4634 | 212/18723 | 3.33e-04 | 2.87e-03 | 75 |
| GO:000663122 | Liver | HCC | fatty acid metabolic process | 238/7958 | 390/18723 | 8.24e-14 | 4.84e-12 | 238 |
| GO:004428221 | Liver | HCC | small molecule catabolic process | 225/7958 | 376/18723 | 6.50e-12 | 2.80e-10 | 225 |
| GO:001605421 | Liver | HCC | organic acid catabolic process | 152/7958 | 240/18723 | 5.11e-11 | 1.92e-09 | 152 |
| GO:00463952 | Liver | HCC | carboxylic acid catabolic process | 149/7958 | 236/18723 | 1.11e-10 | 3.87e-09 | 149 |
| GO:004424222 | Liver | HCC | cellular lipid catabolic process | 134/7958 | 214/18723 | 2.07e-09 | 5.79e-08 | 134 |
| GO:001939522 | Liver | HCC | fatty acid oxidation | 72/7958 | 103/18723 | 1.63e-08 | 3.92e-07 | 72 |
| Page: 1 2 3 4 5 |
| Pathway ID | Tissue | Disease Stage | Description | Gene Ratio | Bg Ratio | pvalue | p.adjust | qvalue | Count |
| hsa041467 | Esophagus | ESCC | Peroxisome | 55/4205 | 82/8465 | 1.04e-03 | 3.27e-03 | 1.68e-03 | 55 |
| hsa0414612 | Esophagus | ESCC | Peroxisome | 55/4205 | 82/8465 | 1.04e-03 | 3.27e-03 | 1.68e-03 | 55 |
| hsa041462 | Liver | Cirrhotic | Peroxisome | 36/2530 | 82/8465 | 4.79e-03 | 1.74e-02 | 1.07e-02 | 36 |
| hsa041463 | Liver | Cirrhotic | Peroxisome | 36/2530 | 82/8465 | 4.79e-03 | 1.74e-02 | 1.07e-02 | 36 |
| hsa041464 | Liver | HCC | Peroxisome | 58/4020 | 82/8465 | 1.57e-05 | 1.05e-04 | 5.85e-05 | 58 |
| hsa041465 | Liver | HCC | Peroxisome | 58/4020 | 82/8465 | 1.57e-05 | 1.05e-04 | 5.85e-05 | 58 |
| hsa041466 | Oral cavity | OSCC | Peroxisome | 47/3704 | 82/8465 | 9.01e-03 | 2.01e-02 | 1.03e-02 | 47 |
| hsa0414611 | Oral cavity | OSCC | Peroxisome | 47/3704 | 82/8465 | 9.01e-03 | 2.01e-02 | 1.03e-02 | 47 |
| hsa0414621 | Oral cavity | LP | Peroxisome | 33/2418 | 82/8465 | 1.48e-02 | 4.69e-02 | 3.03e-02 | 33 |
| hsa0414631 | Oral cavity | LP | Peroxisome | 33/2418 | 82/8465 | 1.48e-02 | 4.69e-02 | 3.03e-02 | 33 |
| Page: 1 |
Top |
Cell-cell communication analysis |
| Identification of potential cell-cell interactions between two cell types and their ligand-receptor pairs for different disease states |
| Ligand | Receptor | LRpair | Pathway | Tissue | Disease Stage |
| Page: 1 |
Top |
Single-cell gene regulatory network inference analysis |
| Find out the significant the regulons (TFs) and the target genes of each regulon across cell types for different disease states |
| TF | Cell Type | Tissue | Disease Stage | Target Gene | RSS | Regulon Activity |
| ∗The dot plots of a searched regulon are shown for all cell subpopulations in each disease state of each tissue based on the regulon specific score inferred using pySCENIC and by calculating the average expression. |
| Page: 1 |
Top |
Somatic mutation of malignant transformation related genes |
| Annotation of somatic variants for genes involved in malignant transformation |
| Hugo Symbol | Variant Class | Variant Classification | dbSNP RS | HGVSc | HGVSp | HGVSp Short | SWISSPROT | BIOTYPE | SIFT | PolyPhen | Tumor Sample Barcode | Tissue | Histology | Sex | Age | Stage | Therapy Types | Drugs | Outcome |
| ECH1 | SNV | Missense_Mutation | novel | c.608C>A | p.Ala203Asp | p.A203D | Q13011 | protein_coding | deleterious(0) | probably_damaging(0.927) | TCGA-A7-A3IZ-01 | Breast | breast invasive carcinoma | Female | <65 | I/II | Chemotherapy | cytoxan | SD |
| ECH1 | SNV | Missense_Mutation | rs377757809 | c.693N>C | p.Lys231Asn | p.K231N | Q13011 | protein_coding | tolerated(0.18) | benign(0.397) | TCGA-D8-A4Z1-01 | Breast | breast invasive carcinoma | Female | >=65 | I/II | Hormone Therapy | tamoxiphen | SD |
| ECH1 | insertion | Frame_Shift_Ins | novel | c.123_124insTCTG | p.Ala42SerfsTer9 | p.A42Sfs*9 | Q13011 | protein_coding | TCGA-D8-A27N-01 | Breast | breast invasive carcinoma | Female | <65 | III/IV | Chemotherapy | taxol+adriamycin+cyclophosphamide+herceptin | SD | ||
| ECH1 | SNV | Missense_Mutation | novel | c.848N>A | p.Arg283His | p.R283H | Q13011 | protein_coding | deleterious(0) | probably_damaging(0.997) | TCGA-2W-A8YY-01 | Cervix | cervical & endocervical cancer | Female | <65 | I/II | Chemotherapy | cisplatin | CR |
| ECH1 | SNV | Missense_Mutation | c.657N>T | p.Gln219His | p.Q219H | Q13011 | protein_coding | tolerated(0.18) | benign(0.005) | TCGA-AA-3715-01 | Colorectum | colon adenocarcinoma | Male | >=65 | I/II | Unknown | Unknown | PD | |
| ECH1 | SNV | Missense_Mutation | rs746522011 | c.770C>T | p.Ala257Val | p.A257V | Q13011 | protein_coding | tolerated(0.15) | probably_damaging(0.991) | TCGA-AD-6895-01 | Colorectum | colon adenocarcinoma | Male | >=65 | III/IV | Unknown | Unknown | SD |
| ECH1 | SNV | Missense_Mutation | c.685N>A | p.Ala229Thr | p.A229T | Q13011 | protein_coding | deleterious(0.01) | probably_damaging(0.934) | TCGA-DM-A1HB-01 | Colorectum | colon adenocarcinoma | Male | >=65 | III/IV | Unknown | Unknown | SD | |
| ECH1 | SNV | Missense_Mutation | novel | c.927G>T | p.Lys309Asn | p.K309N | Q13011 | protein_coding | tolerated(0.2) | probably_damaging(0.988) | TCGA-A5-A0G2-01 | Endometrium | uterine corpus endometrioid carcinoma | Female | <65 | III/IV | Unknown | Unknown | SD |
| ECH1 | SNV | Missense_Mutation | rs143488307 | c.632G>A | p.Arg211His | p.R211H | Q13011 | protein_coding | deleterious(0) | probably_damaging(0.996) | TCGA-A5-A0G2-01 | Endometrium | uterine corpus endometrioid carcinoma | Female | <65 | III/IV | Unknown | Unknown | SD |
| ECH1 | SNV | Missense_Mutation | rs753440498 | c.427C>T | p.Arg143Cys | p.R143C | Q13011 | protein_coding | deleterious(0.02) | probably_damaging(0.979) | TCGA-A5-A0G2-01 | Endometrium | uterine corpus endometrioid carcinoma | Female | <65 | III/IV | Unknown | Unknown | SD |
| Page: 1 2 3 |
Top |
Related drugs of malignant transformation related genes |
| Identification of chemicals and drugs interact with genes involved in malignant transfromation |
| (DGIdb 4.0) |
| Entrez ID | Symbol | Category | Interaction Types | Drug Claim Name | Drug Name | PMIDs |
| Page: 1 |

Copyright 2023-Present -The University of Texas Health Science Center at Houston |