
|
|||||
|
 | |
| |
| |
| |
| |
| |
|
Gene: DVL3 |
Gene summary for DVL3 |
| Gene information | Species | Human | Gene symbol | DVL3 | Gene ID | 1857 |
| Gene name | dishevelled segment polarity protein 3 | |
| Gene Alias | DRS3 | |
| Cytomap | 3q27.1 | |
| Gene Type | protein-coding | GO ID | GO:0000165 | UniProtAcc | Q92997 |
Top |
Malignant transformation analysis |
| Identification of the aberrant gene expression in precancerous and cancerous lesions by comparing the gene expression of stem-like cells in diseased tissues with normal stem cells |
| Entrez ID | Symbol | Replicates | Species | Organ | Tissue | Adj P-value | Log2FC | Malignancy |
| 1857 | DVL3 | LZE2T | Human | Esophagus | ESCC | 4.74e-05 | 7.95e-01 | 0.082 |
| 1857 | DVL3 | LZE4T | Human | Esophagus | ESCC | 2.06e-12 | 2.01e-01 | 0.0811 |
| 1857 | DVL3 | LZE7T | Human | Esophagus | ESCC | 5.04e-08 | 3.94e-01 | 0.0667 |
| 1857 | DVL3 | LZE8T | Human | Esophagus | ESCC | 2.05e-02 | 9.19e-02 | 0.067 |
| 1857 | DVL3 | LZE20T | Human | Esophagus | ESCC | 2.81e-03 | 1.32e-01 | 0.0662 |
| 1857 | DVL3 | LZE24T | Human | Esophagus | ESCC | 1.29e-09 | 3.70e-01 | 0.0596 |
| 1857 | DVL3 | LZE21T | Human | Esophagus | ESCC | 4.07e-06 | 4.50e-01 | 0.0655 |
| 1857 | DVL3 | P1T-E | Human | Esophagus | ESCC | 4.75e-11 | 7.41e-01 | 0.0875 |
| 1857 | DVL3 | P2T-E | Human | Esophagus | ESCC | 7.14e-36 | 6.37e-01 | 0.1177 |
| 1857 | DVL3 | P4T-E | Human | Esophagus | ESCC | 2.97e-20 | 5.07e-01 | 0.1323 |
| 1857 | DVL3 | P5T-E | Human | Esophagus | ESCC | 1.31e-17 | 1.76e-01 | 0.1327 |
| 1857 | DVL3 | P8T-E | Human | Esophagus | ESCC | 1.53e-21 | 4.69e-01 | 0.0889 |
| 1857 | DVL3 | P9T-E | Human | Esophagus | ESCC | 8.77e-16 | 4.34e-01 | 0.1131 |
| 1857 | DVL3 | P10T-E | Human | Esophagus | ESCC | 2.08e-22 | 4.53e-01 | 0.116 |
| 1857 | DVL3 | P11T-E | Human | Esophagus | ESCC | 1.53e-13 | 4.64e-01 | 0.1426 |
| 1857 | DVL3 | P12T-E | Human | Esophagus | ESCC | 8.11e-18 | 2.34e-01 | 0.1122 |
| 1857 | DVL3 | P15T-E | Human | Esophagus | ESCC | 2.64e-19 | 4.90e-01 | 0.1149 |
| 1857 | DVL3 | P16T-E | Human | Esophagus | ESCC | 1.45e-16 | 2.93e-01 | 0.1153 |
| 1857 | DVL3 | P17T-E | Human | Esophagus | ESCC | 2.60e-06 | 1.25e-01 | 0.1278 |
| 1857 | DVL3 | P20T-E | Human | Esophagus | ESCC | 2.35e-09 | 2.27e-01 | 0.1124 |
| Page: 1 2 3 4 5 6 |
| Tissue | Expression Dynamics | Abbreviation |
| Esophagus |  | ESCC: Esophageal squamous cell carcinoma |
| HGIN: High-grade intraepithelial neoplasias | ||
| LGIN: Low-grade intraepithelial neoplasias | ||
| Liver | 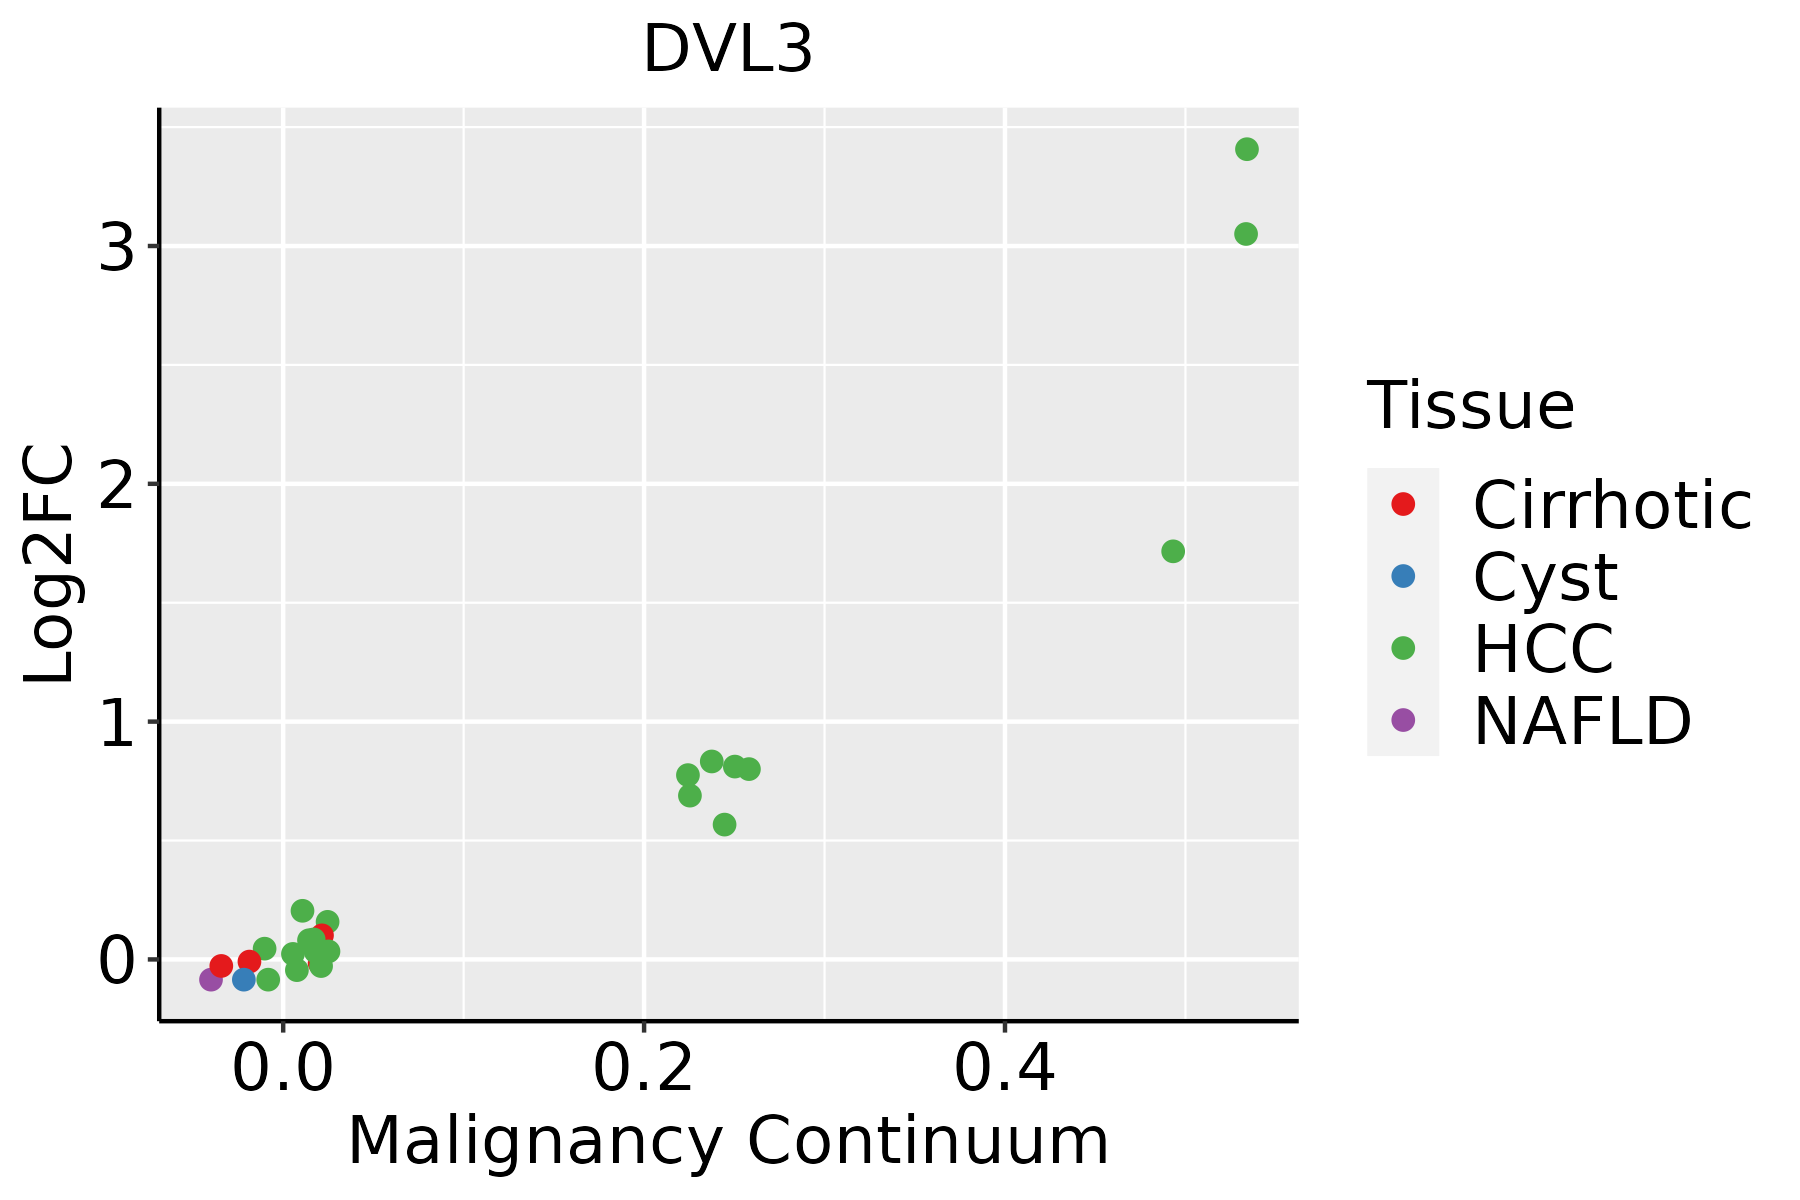 | HCC: Hepatocellular carcinoma |
| NAFLD: Non-alcoholic fatty liver disease | ||
| Oral Cavity | 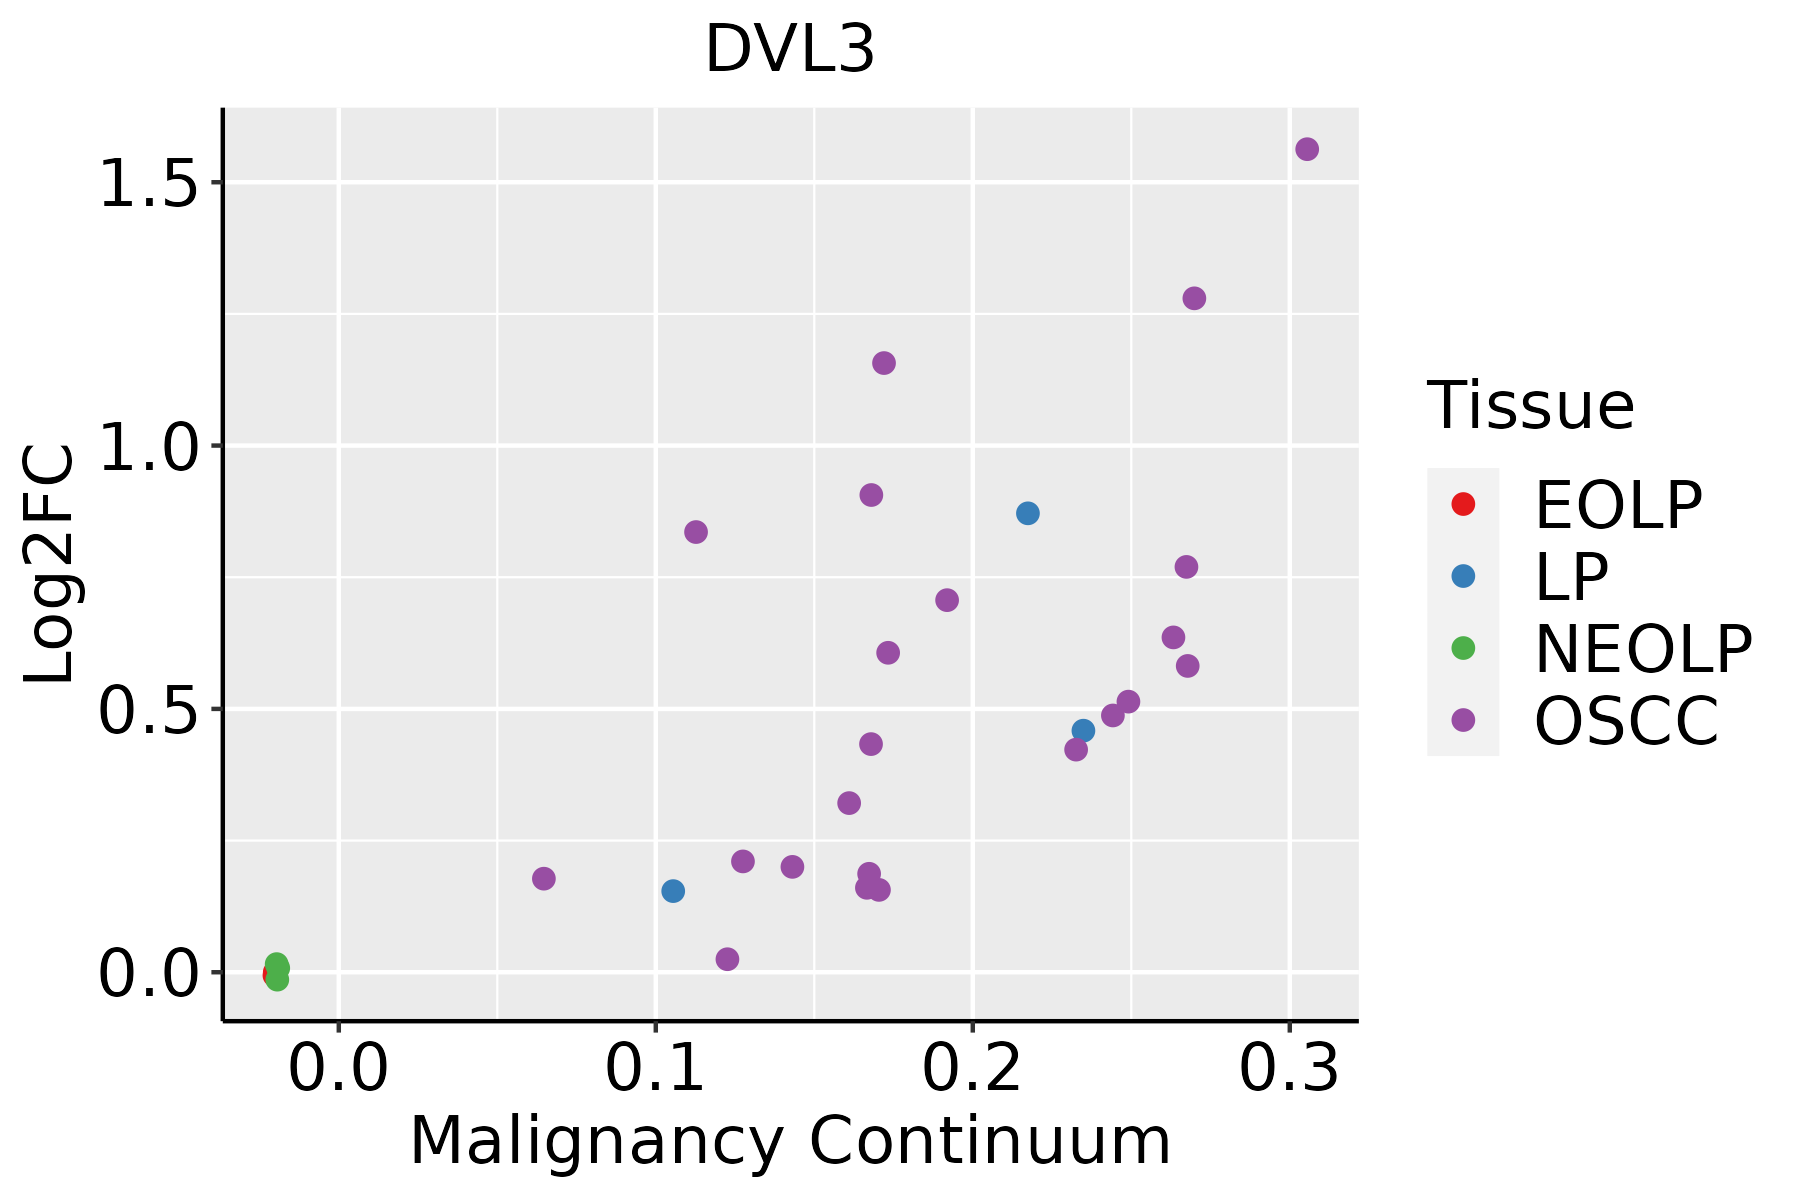 | EOLP: Erosive Oral lichen planus |
| LP: leukoplakia | ||
| NEOLP: Non-erosive oral lichen planus | ||
| OSCC: Oral squamous cell carcinoma | ||
| Skin | 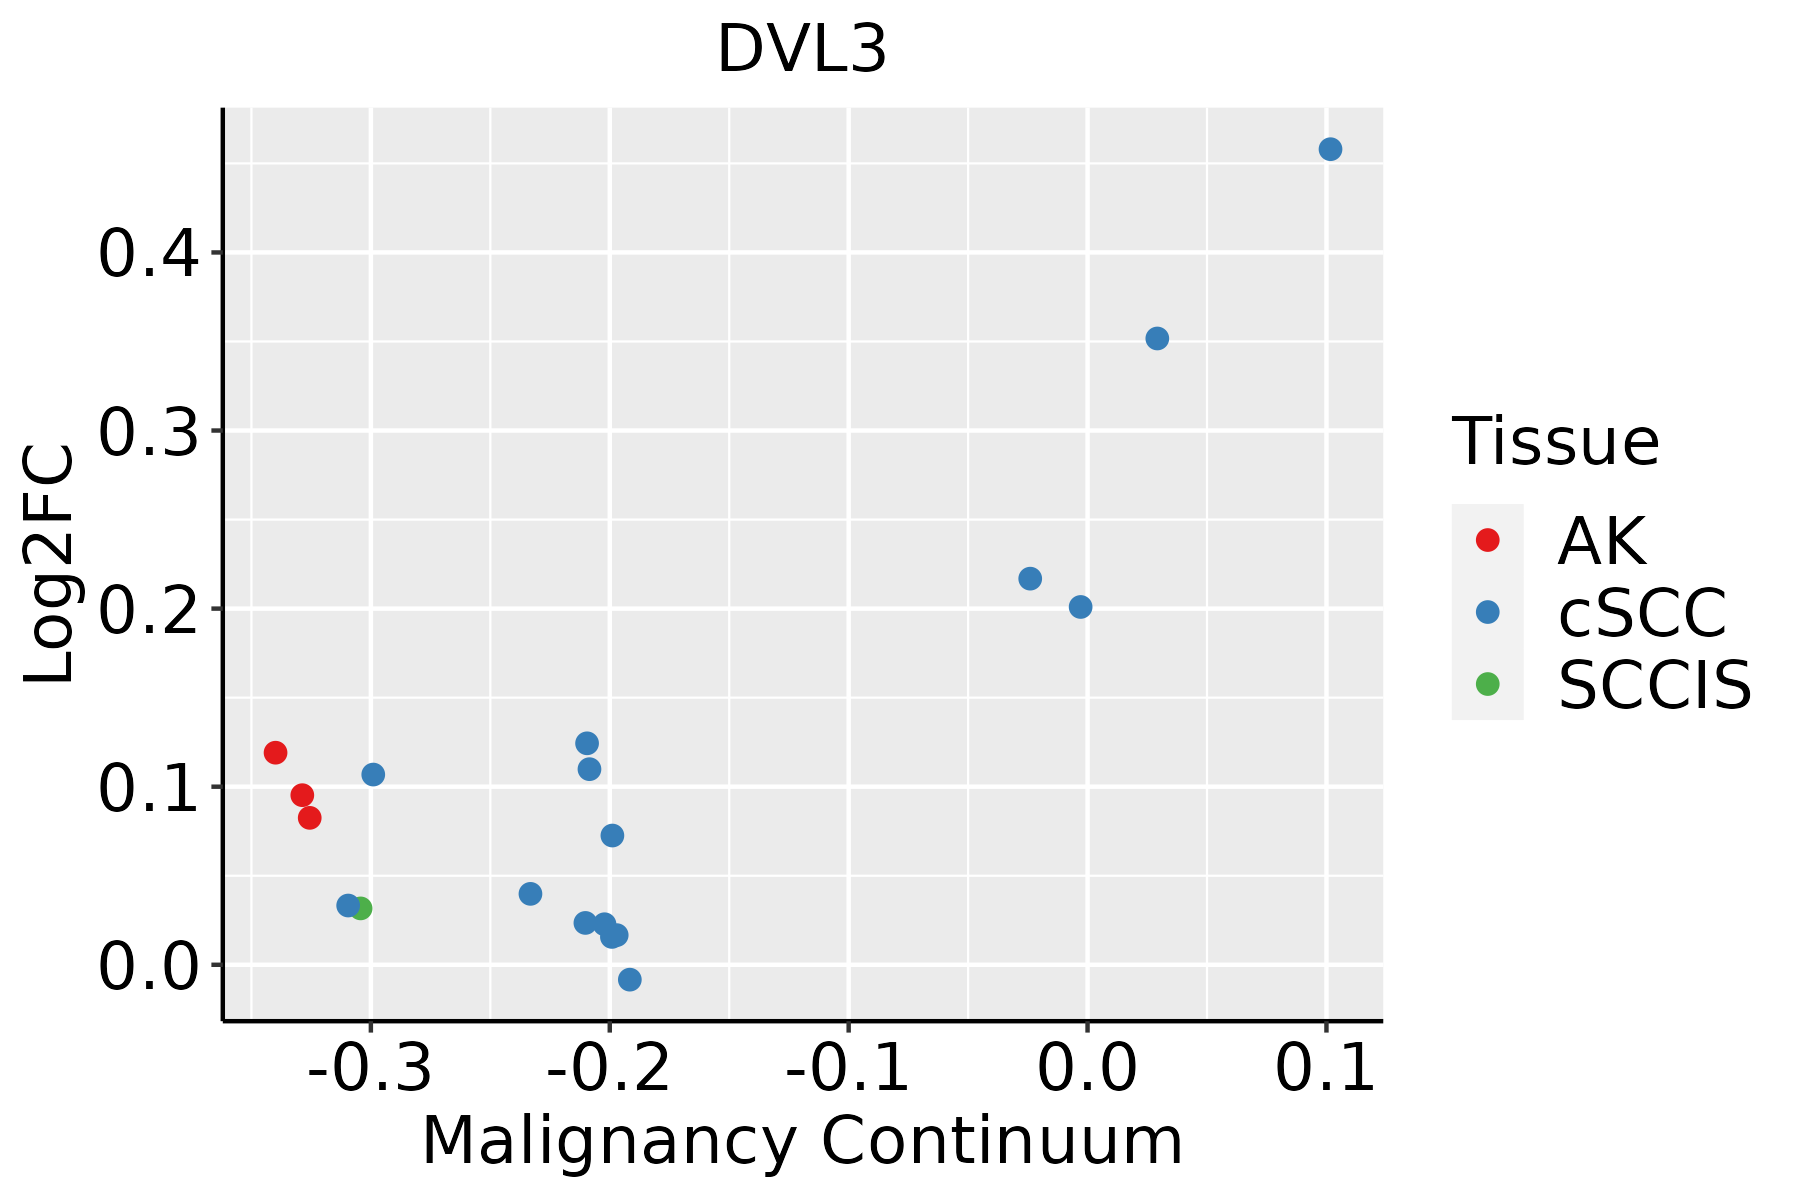 | AK: Actinic keratosis |
| cSCC: Cutaneous squamous cell carcinoma | ||
| SCCIS:squamous cell carcinoma in situ | ||
| Thyroid | 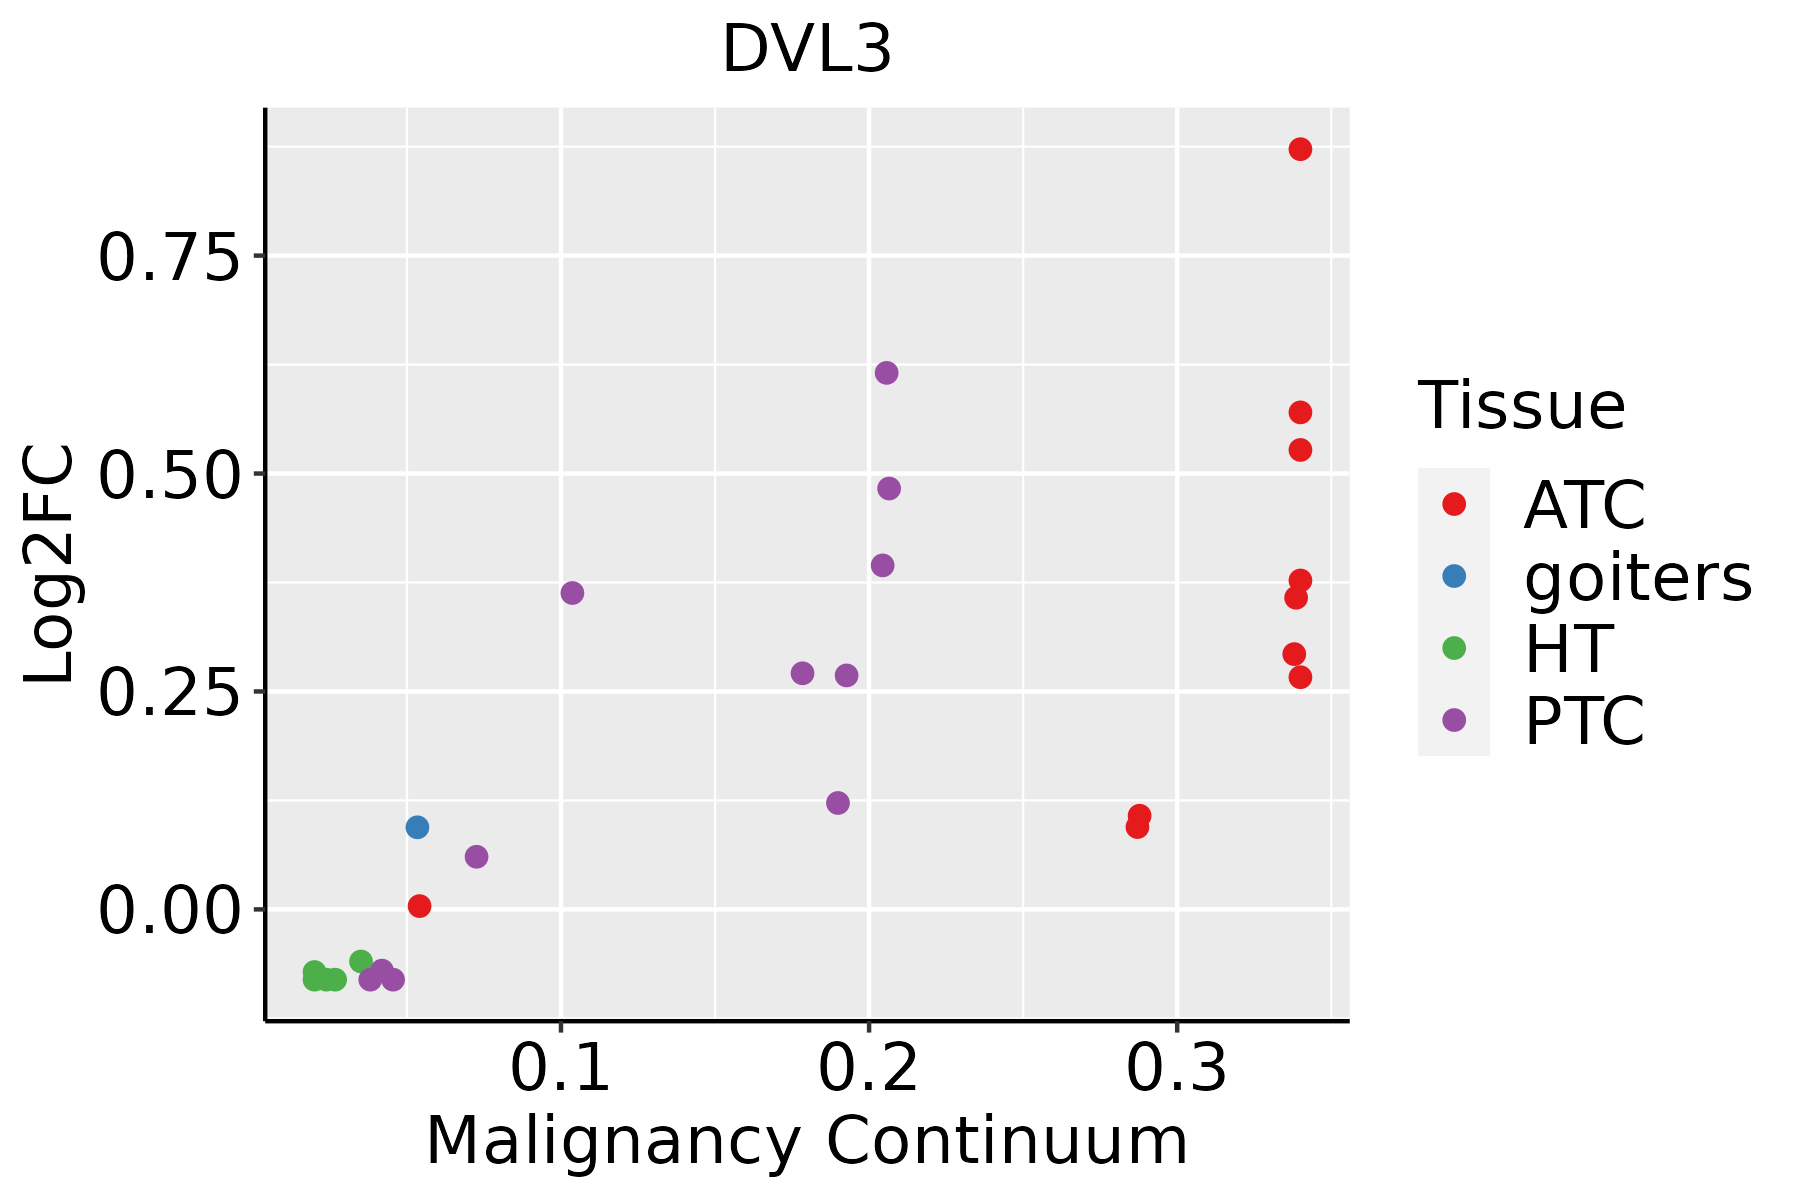 | ATC: Anaplastic thyroid cancer |
| HT: Hashimoto's thyroiditis | ||
| PTC: Papillary thyroid cancer |
| ∗log2FC in expression of this searched gene in stem-like cells from each diseased tissue sample relative to stem-like cells in normal samples in each tissue plotted against the malignancy continuum. Samples are colored based on if they are from different disease stage. |
Top |
Malignant transformation related pathway analysis |
| Find out the enriched GO biological processes and KEGG pathways involved in transition from healthy to precancer to cancer |
| Tissue | Disease Stage | Enriched GO biological Processes |
| Colorectum | AD |  |
| Colorectum | SER |  |
| Colorectum | MSS |  |
| Colorectum | MSI-H |  |
| Colorectum | FAP |  |
| ∗Top 15 enriched GO BP terms are showed in the bar plot of each disease state in each tissue. Each row represents a significant GO biological process which is colored according to the -log10(p.adjust). |
| Page: 1 2 3 4 5 6 7 8 9 |
| GO ID | Tissue | Disease Stage | Description | Gene Ratio | Bg Ratio | pvalue | p.adjust | Count |
| GO:007190011 | Liver | Cirrhotic | regulation of protein serine/threonine kinase activity | 110/4634 | 359/18723 | 6.19e-03 | 3.08e-02 | 110 |
| GO:004586011 | Liver | Cirrhotic | positive regulation of protein kinase activity | 117/4634 | 386/18723 | 7.07e-03 | 3.41e-02 | 117 |
| GO:003164722 | Liver | HCC | regulation of protein stability | 211/7958 | 298/18723 | 2.29e-23 | 5.01e-21 | 211 |
| GO:005082122 | Liver | HCC | protein stabilization | 139/7958 | 191/18723 | 1.61e-17 | 1.71e-15 | 139 |
| GO:002260422 | Liver | HCC | regulation of cell morphogenesis | 188/7958 | 309/18723 | 4.84e-11 | 1.82e-09 | 188 |
| GO:019873821 | Liver | HCC | cell-cell signaling by wnt | 247/7958 | 446/18723 | 2.11e-08 | 4.96e-07 | 247 |
| GO:001605521 | Liver | HCC | Wnt signaling pathway | 245/7958 | 444/18723 | 3.68e-08 | 8.09e-07 | 245 |
| GO:000941022 | Liver | HCC | response to xenobiotic stimulus | 248/7958 | 462/18723 | 6.47e-07 | 1.02e-05 | 248 |
| GO:003134611 | Liver | HCC | positive regulation of cell projection organization | 193/7958 | 353/18723 | 2.28e-06 | 3.08e-05 | 193 |
| GO:007190021 | Liver | HCC | regulation of protein serine/threonine kinase activity | 189/7958 | 359/18723 | 5.97e-05 | 5.47e-04 | 189 |
| GO:006007021 | Liver | HCC | canonical Wnt signaling pathway | 162/7958 | 303/18723 | 7.00e-05 | 6.32e-04 | 162 |
| GO:00018415 | Liver | HCC | neural tube formation | 62/7958 | 102/18723 | 1.47e-04 | 1.18e-03 | 62 |
| GO:00018433 | Liver | HCC | neural tube closure | 53/7958 | 88/18723 | 5.95e-04 | 3.75e-03 | 53 |
| GO:00140204 | Liver | HCC | primary neural tube formation | 56/7958 | 94/18723 | 6.19e-04 | 3.86e-03 | 56 |
| GO:00606063 | Liver | HCC | tube closure | 53/7958 | 89/18723 | 8.67e-04 | 5.14e-03 | 53 |
| GO:004586021 | Liver | HCC | positive regulation of protein kinase activity | 194/7958 | 386/18723 | 1.16e-03 | 6.54e-03 | 194 |
| GO:003367411 | Liver | HCC | positive regulation of kinase activity | 230/7958 | 467/18723 | 1.72e-03 | 8.95e-03 | 230 |
| GO:00219154 | Liver | HCC | neural tube development | 82/7958 | 152/18723 | 2.83e-03 | 1.33e-02 | 82 |
| GO:00018384 | Liver | HCC | embryonic epithelial tube formation | 66/7958 | 121/18723 | 4.94e-03 | 2.07e-02 | 66 |
| GO:00721754 | Liver | HCC | epithelial tube formation | 70/7958 | 132/18723 | 9.29e-03 | 3.57e-02 | 70 |
| Page: 1 2 3 4 5 6 7 8 9 |
| Pathway ID | Tissue | Disease Stage | Description | Gene Ratio | Bg Ratio | pvalue | p.adjust | qvalue | Count |
| hsa05022210 | Esophagus | ESCC | Pathways of neurodegeneration - multiple diseases | 318/4205 | 476/8465 | 6.10e-15 | 2.04e-13 | 1.05e-13 | 318 |
| hsa05010210 | Esophagus | ESCC | Alzheimer disease | 263/4205 | 384/8465 | 1.80e-14 | 5.47e-13 | 2.80e-13 | 263 |
| hsa0516510 | Esophagus | ESCC | Human papillomavirus infection | 215/4205 | 331/8465 | 7.86e-09 | 7.12e-08 | 3.65e-08 | 215 |
| hsa0522518 | Esophagus | ESCC | Hepatocellular carcinoma | 109/4205 | 168/8465 | 4.27e-05 | 1.88e-04 | 9.64e-05 | 109 |
| hsa041505 | Esophagus | ESCC | mTOR signaling pathway | 98/4205 | 156/8465 | 5.81e-04 | 1.95e-03 | 9.97e-04 | 98 |
| hsa043306 | Esophagus | ESCC | Notch signaling pathway | 42/4205 | 62/8465 | 2.97e-03 | 7.97e-03 | 4.08e-03 | 42 |
| hsa0439018 | Esophagus | ESCC | Hippo signaling pathway | 92/4205 | 157/8465 | 1.46e-02 | 3.31e-02 | 1.69e-02 | 92 |
| hsa0502238 | Esophagus | ESCC | Pathways of neurodegeneration - multiple diseases | 318/4205 | 476/8465 | 6.10e-15 | 2.04e-13 | 1.05e-13 | 318 |
| hsa0501038 | Esophagus | ESCC | Alzheimer disease | 263/4205 | 384/8465 | 1.80e-14 | 5.47e-13 | 2.80e-13 | 263 |
| hsa0516515 | Esophagus | ESCC | Human papillomavirus infection | 215/4205 | 331/8465 | 7.86e-09 | 7.12e-08 | 3.65e-08 | 215 |
| hsa0522519 | Esophagus | ESCC | Hepatocellular carcinoma | 109/4205 | 168/8465 | 4.27e-05 | 1.88e-04 | 9.64e-05 | 109 |
| hsa0415013 | Esophagus | ESCC | mTOR signaling pathway | 98/4205 | 156/8465 | 5.81e-04 | 1.95e-03 | 9.97e-04 | 98 |
| hsa0433013 | Esophagus | ESCC | Notch signaling pathway | 42/4205 | 62/8465 | 2.97e-03 | 7.97e-03 | 4.08e-03 | 42 |
| hsa0439019 | Esophagus | ESCC | Hippo signaling pathway | 92/4205 | 157/8465 | 1.46e-02 | 3.31e-02 | 1.69e-02 | 92 |
| hsa0502214 | Liver | Cirrhotic | Pathways of neurodegeneration - multiple diseases | 217/2530 | 476/8465 | 7.30e-14 | 2.03e-12 | 1.25e-12 | 217 |
| hsa0501014 | Liver | Cirrhotic | Alzheimer disease | 180/2530 | 384/8465 | 5.52e-13 | 1.36e-11 | 8.36e-12 | 180 |
| hsa05165 | Liver | Cirrhotic | Human papillomavirus infection | 124/2530 | 331/8465 | 1.55e-03 | 7.83e-03 | 4.83e-03 | 124 |
| hsa0502215 | Liver | Cirrhotic | Pathways of neurodegeneration - multiple diseases | 217/2530 | 476/8465 | 7.30e-14 | 2.03e-12 | 1.25e-12 | 217 |
| hsa0501015 | Liver | Cirrhotic | Alzheimer disease | 180/2530 | 384/8465 | 5.52e-13 | 1.36e-11 | 8.36e-12 | 180 |
| hsa051651 | Liver | Cirrhotic | Human papillomavirus infection | 124/2530 | 331/8465 | 1.55e-03 | 7.83e-03 | 4.83e-03 | 124 |
| Page: 1 2 3 |
Top |
Cell-cell communication analysis |
| Identification of potential cell-cell interactions between two cell types and their ligand-receptor pairs for different disease states |
| Ligand | Receptor | LRpair | Pathway | Tissue | Disease Stage |
| Page: 1 |
Top |
Single-cell gene regulatory network inference analysis |
| Find out the significant the regulons (TFs) and the target genes of each regulon across cell types for different disease states |
| TF | Cell Type | Tissue | Disease Stage | Target Gene | RSS | Regulon Activity |
| ∗The dot plots of a searched regulon are shown for all cell subpopulations in each disease state of each tissue based on the regulon specific score inferred using pySCENIC and by calculating the average expression. |
| Page: 1 |
Top |
Somatic mutation of malignant transformation related genes |
| Annotation of somatic variants for genes involved in malignant transformation |
| Hugo Symbol | Variant Class | Variant Classification | dbSNP RS | HGVSc | HGVSp | HGVSp Short | SWISSPROT | BIOTYPE | SIFT | PolyPhen | Tumor Sample Barcode | Tissue | Histology | Sex | Age | Stage | Therapy Types | Drugs | Outcome |
| DVL3 | SNV | Missense_Mutation | c.722N>T | p.Ser241Phe | p.S241F | Q92997 | protein_coding | deleterious(0) | benign(0.373) | TCGA-A8-A0A7-01 | Breast | breast invasive carcinoma | Female | <65 | I/II | Unknown | Unknown | SD | |
| DVL3 | SNV | Missense_Mutation | novel | c.703N>A | p.Phe235Ile | p.F235I | Q92997 | protein_coding | deleterious(0.02) | probably_damaging(0.966) | TCGA-B6-A0RI-01 | Breast | breast invasive carcinoma | Female | <65 | III/IV | Unknown | Unknown | PD |
| DVL3 | SNV | Missense_Mutation | c.570N>A | p.Phe190Leu | p.F190L | Q92997 | protein_coding | tolerated(0.76) | benign(0.038) | TCGA-D8-A1XT-01 | Breast | breast invasive carcinoma | Female | <65 | I/II | Chemotherapy | adriamycin+cyclophosphamide | SD | |
| DVL3 | SNV | Missense_Mutation | novel | c.172N>A | p.Glu58Lys | p.E58K | Q92997 | protein_coding | deleterious(0) | probably_damaging(0.995) | TCGA-GM-A2DO-01 | Breast | breast invasive carcinoma | Female | <65 | I/II | Hormone Therapy | tamoxiphen | CR |
| DVL3 | SNV | Missense_Mutation | c.596N>A | p.Ser199Asn | p.S199N | Q92997 | protein_coding | deleterious(0.01) | probably_damaging(0.966) | TCGA-AA-3710-01 | Colorectum | colon adenocarcinoma | Female | >=65 | I/II | Unknown | Unknown | SD | |
| DVL3 | SNV | Missense_Mutation | novel | c.1933N>T | p.Arg645Cys | p.R645C | Q92997 | protein_coding | tolerated(0.07) | benign(0.001) | TCGA-AA-3984-01 | Colorectum | colon adenocarcinoma | Female | <65 | I/II | Unknown | Unknown | SD |
| DVL3 | SNV | Missense_Mutation | c.1580N>T | p.Pro527Leu | p.P527L | Q92997 | protein_coding | deleterious(0) | probably_damaging(0.992) | TCGA-D5-6535-01 | Colorectum | colon adenocarcinoma | Female | >=65 | III/IV | Unknown | Unknown | SD | |
| DVL3 | SNV | Missense_Mutation | c.920N>C | p.Phe307Ser | p.F307S | Q92997 | protein_coding | deleterious(0) | probably_damaging(0.998) | TCGA-D5-6537-01 | Colorectum | colon adenocarcinoma | Male | <65 | III/IV | Unknown | Unknown | PD | |
| DVL3 | SNV | Missense_Mutation | c.1761N>T | p.Lys587Asn | p.K587N | Q92997 | protein_coding | tolerated(0.27) | benign(0.255) | TCGA-WS-AB45-01 | Colorectum | colon adenocarcinoma | Female | <65 | I/II | Unknown | Unknown | SD | |
| DVL3 | SNV | Missense_Mutation | novel | c.703N>A | p.Phe235Ile | p.F235I | Q92997 | protein_coding | deleterious(0.02) | probably_damaging(0.966) | TCGA-AG-4008-01 | Colorectum | rectum adenocarcinoma | Male | <65 | I/II | Chemotherapy | 5-fluorouracil | CR |
| Page: 1 2 3 4 5 6 7 8 9 |
Top |
Related drugs of malignant transformation related genes |
| Identification of chemicals and drugs interact with genes involved in malignant transfromation |
| (DGIdb 4.0) |
| Entrez ID | Symbol | Category | Interaction Types | Drug Claim Name | Drug Name | PMIDs |
| Page: 1 |

Copyright 2023-Present -The University of Texas Health Science Center at Houston |