
|
|||||
|
 | |
| |
| |
| |
| |
| |
|
Gene: DHRS4 |
Gene summary for DHRS4 |
| Gene information | Species | Human | Gene symbol | DHRS4 | Gene ID | 10901 |
| Gene name | dehydrogenase/reductase 4 | |
| Gene Alias | CR | |
| Cytomap | 14q11.2 | |
| Gene Type | protein-coding | GO ID | GO:0001523 | UniProtAcc | Q9BTZ2 |
Top |
Malignant transformation analysis |
| Identification of the aberrant gene expression in precancerous and cancerous lesions by comparing the gene expression of stem-like cells in diseased tissues with normal stem cells |
| Entrez ID | Symbol | Replicates | Species | Organ | Tissue | Adj P-value | Log2FC | Malignancy |
| 10901 | DHRS4 | HTA11_1938_2000001011 | Human | Colorectum | AD | 4.00e-05 | 3.62e-01 | -0.0811 |
| 10901 | DHRS4 | HTA11_78_2000001011 | Human | Colorectum | AD | 7.91e-07 | 2.61e-01 | -0.1088 |
| 10901 | DHRS4 | HTA11_347_2000001011 | Human | Colorectum | AD | 5.26e-24 | 5.76e-01 | -0.1954 |
| 10901 | DHRS4 | HTA11_3361_2000001011 | Human | Colorectum | AD | 8.23e-04 | 3.39e-01 | -0.1207 |
| 10901 | DHRS4 | HTA11_83_2000001011 | Human | Colorectum | SER | 2.09e-07 | 4.55e-01 | -0.1526 |
| 10901 | DHRS4 | HTA11_696_2000001011 | Human | Colorectum | AD | 7.10e-10 | 4.47e-01 | -0.1464 |
| 10901 | DHRS4 | HTA11_1391_2000001011 | Human | Colorectum | AD | 6.24e-17 | 5.50e-01 | -0.059 |
| 10901 | DHRS4 | HTA11_2992_2000001011 | Human | Colorectum | SER | 4.51e-07 | 5.62e-01 | -0.1706 |
| 10901 | DHRS4 | HTA11_9341_2000001011 | Human | Colorectum | SER | 2.63e-02 | 3.74e-01 | -0.00410000000000005 |
| 10901 | DHRS4 | HTA11_866_3004761011 | Human | Colorectum | AD | 9.82e-16 | 4.29e-01 | 0.096 |
| 10901 | DHRS4 | HTA11_4255_2000001011 | Human | Colorectum | SER | 3.71e-03 | 3.92e-01 | 0.0446 |
| 10901 | DHRS4 | HTA11_8622_2000001021 | Human | Colorectum | SER | 1.09e-04 | 3.77e-01 | 0.0528 |
| 10901 | DHRS4 | HTA11_10623_2000001011 | Human | Colorectum | AD | 1.82e-05 | 3.39e-01 | -0.0177 |
| 10901 | DHRS4 | HTA11_10711_2000001011 | Human | Colorectum | AD | 4.07e-04 | 2.56e-01 | 0.0338 |
| 10901 | DHRS4 | HTA11_7696_3000711011 | Human | Colorectum | AD | 7.73e-08 | 3.85e-01 | 0.0674 |
| 10901 | DHRS4 | HTA11_6818_2000001011 | Human | Colorectum | AD | 1.72e-02 | 3.28e-01 | 0.0112 |
| 10901 | DHRS4 | HTA11_99999970781_79442 | Human | Colorectum | MSS | 6.63e-17 | 6.10e-01 | 0.294 |
| 10901 | DHRS4 | HTA11_99999974143_84620 | Human | Colorectum | MSS | 1.98e-06 | 3.18e-01 | 0.3005 |
| 10901 | DHRS4 | LZE2T | Human | Esophagus | ESCC | 5.40e-05 | 5.72e-01 | 0.082 |
| 10901 | DHRS4 | LZE4T | Human | Esophagus | ESCC | 3.95e-33 | 9.06e-01 | 0.0811 |
| Page: 1 2 3 4 5 6 7 |
| Tissue | Expression Dynamics | Abbreviation |
| Colorectum (GSE201348) |  | FAP: Familial adenomatous polyposis |
| CRC: Colorectal cancer | ||
| Colorectum (HTA11) |  | AD: Adenomas |
| SER: Sessile serrated lesions | ||
| MSI-H: Microsatellite-high colorectal cancer | ||
| MSS: Microsatellite stable colorectal cancer | ||
| Esophagus | 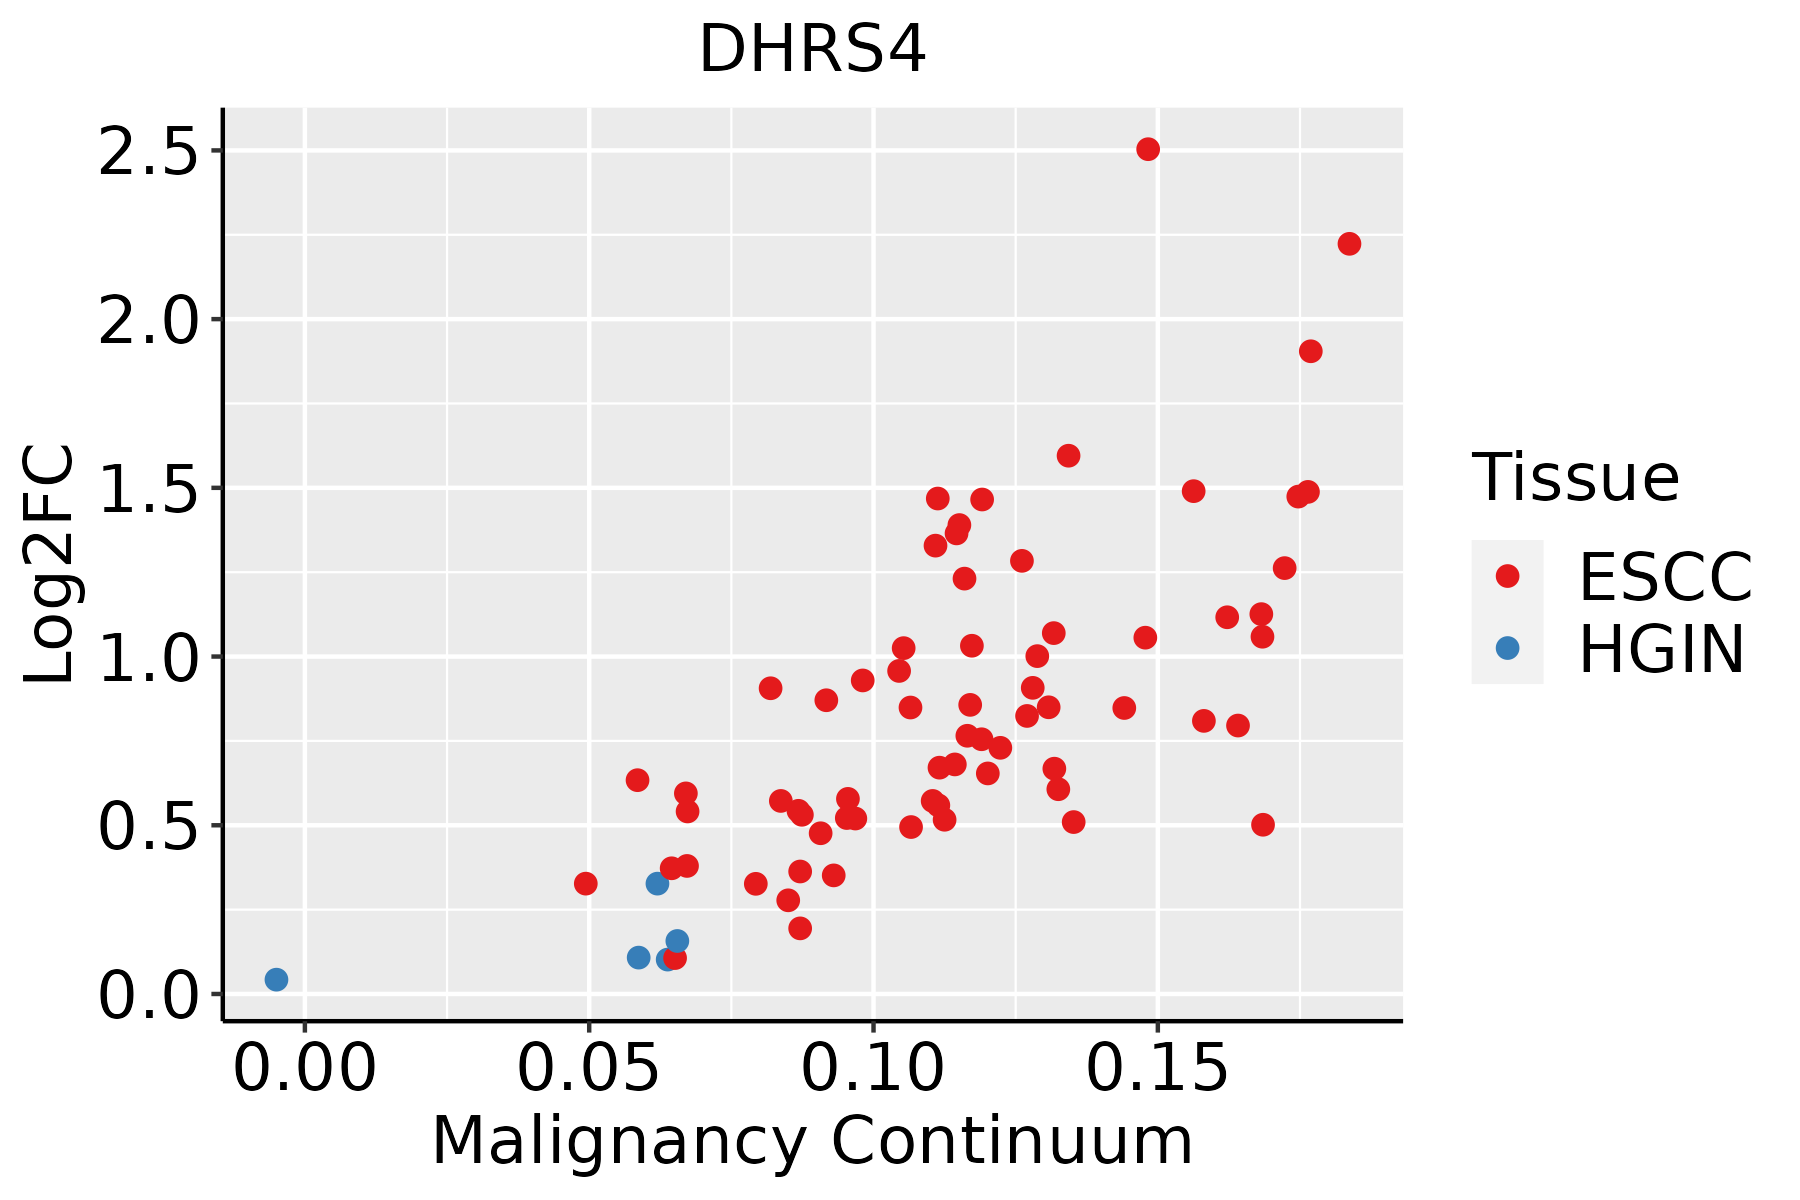 | ESCC: Esophageal squamous cell carcinoma |
| HGIN: High-grade intraepithelial neoplasias | ||
| LGIN: Low-grade intraepithelial neoplasias | ||
| Liver | 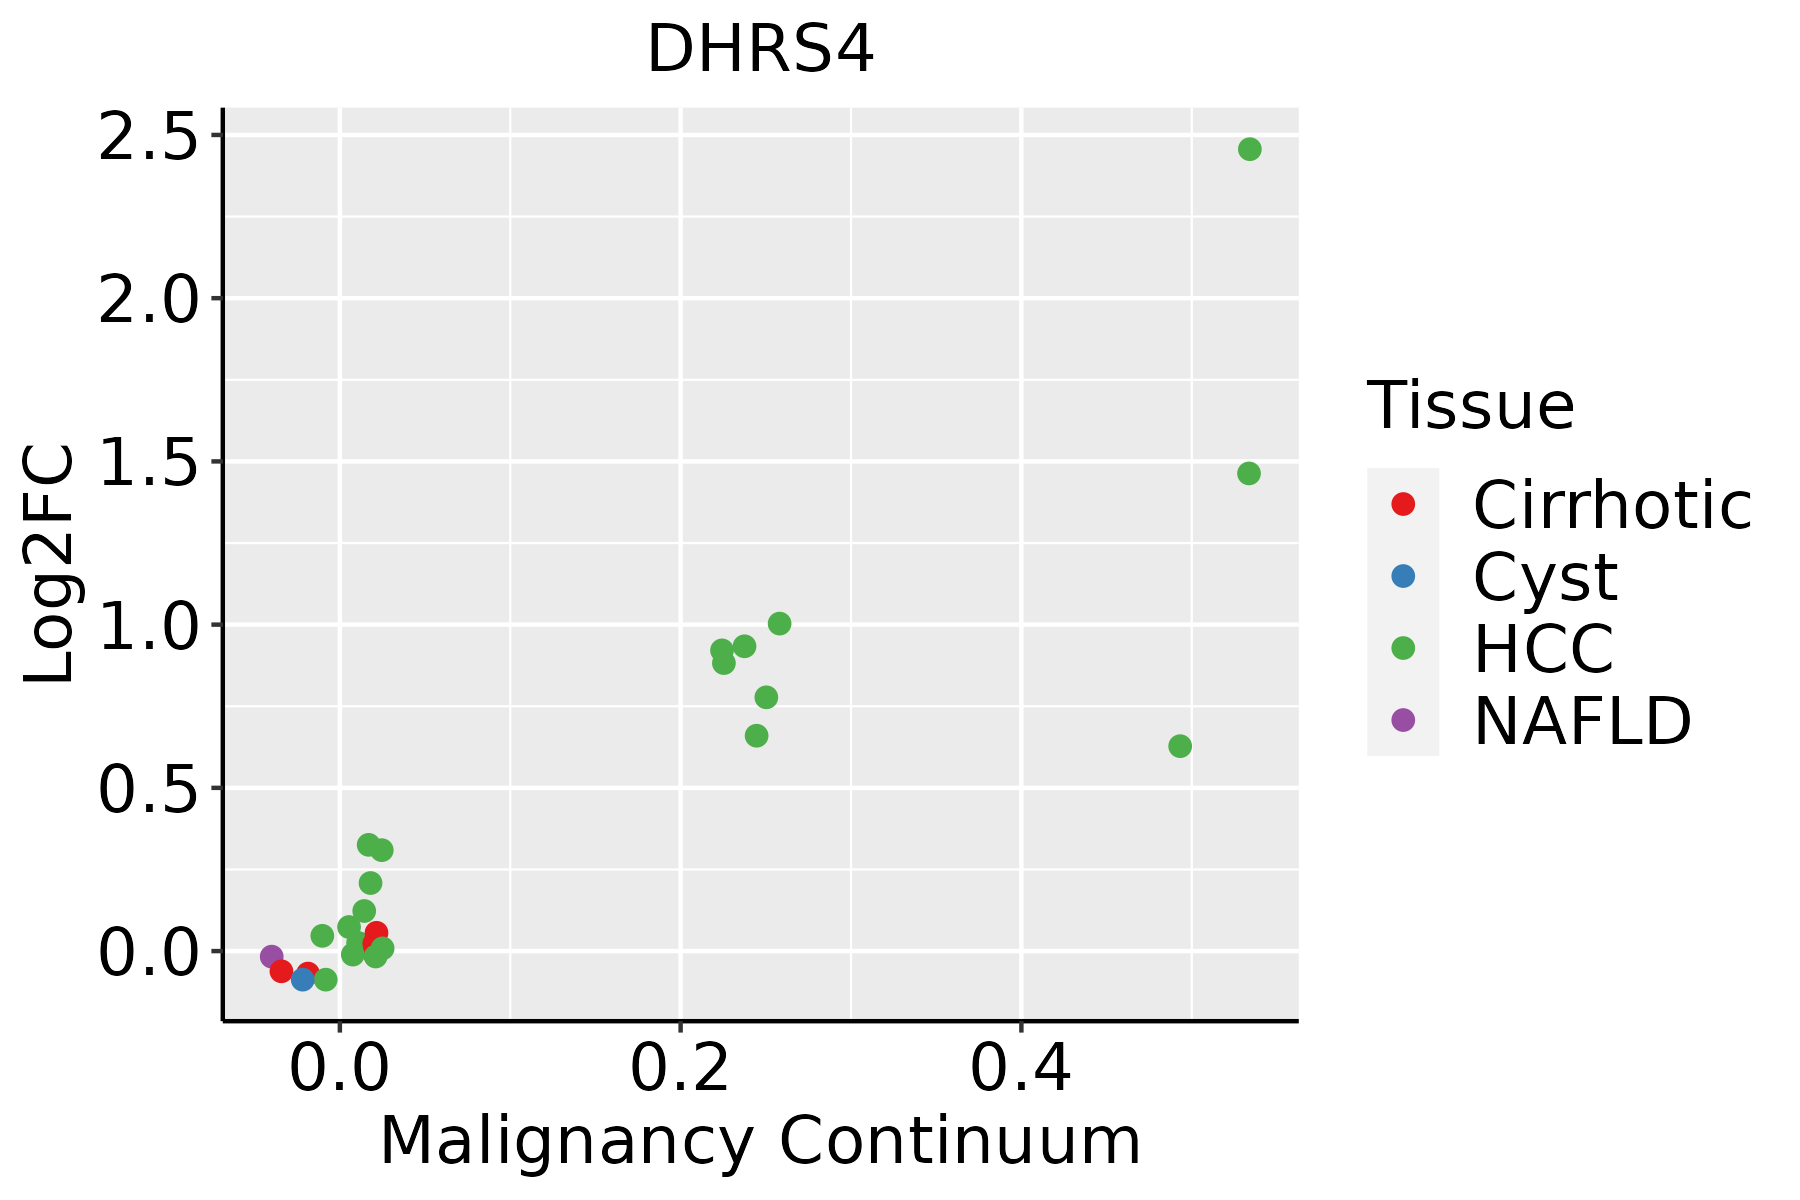 | HCC: Hepatocellular carcinoma |
| NAFLD: Non-alcoholic fatty liver disease | ||
| Oral Cavity |  | EOLP: Erosive Oral lichen planus |
| LP: leukoplakia | ||
| NEOLP: Non-erosive oral lichen planus | ||
| OSCC: Oral squamous cell carcinoma | ||
| Skin |  | AK: Actinic keratosis |
| cSCC: Cutaneous squamous cell carcinoma | ||
| SCCIS:squamous cell carcinoma in situ |
| ∗log2FC in expression of this searched gene in stem-like cells from each diseased tissue sample relative to stem-like cells in normal samples in each tissue plotted against the malignancy continuum. Samples are colored based on if they are from different disease stage. |
Top |
Malignant transformation related pathway analysis |
| Find out the enriched GO biological processes and KEGG pathways involved in transition from healthy to precancer to cancer |
| Tissue | Disease Stage | Enriched GO biological Processes |
| Colorectum | AD |  |
| Colorectum | SER |  |
| Colorectum | MSS |  |
| Colorectum | MSI-H |  |
| Colorectum | FAP |  |
| ∗Top 15 enriched GO BP terms are showed in the bar plot of each disease state in each tissue. Each row represents a significant GO biological process which is colored according to the -log10(p.adjust). |
| Page: 1 2 3 4 5 6 7 8 9 |
| GO ID | Tissue | Disease Stage | Description | Gene Ratio | Bg Ratio | pvalue | p.adjust | Count |
| GO:00060667 | Oral cavity | OSCC | alcohol metabolic process | 179/7305 | 353/18723 | 4.54e-06 | 5.21e-05 | 179 |
| GO:00421804 | Oral cavity | OSCC | cellular ketone metabolic process | 111/7305 | 211/18723 | 3.94e-05 | 3.45e-04 | 111 |
| GO:007259316 | Oral cavity | OSCC | reactive oxygen species metabolic process | 122/7305 | 239/18723 | 9.73e-05 | 7.34e-04 | 122 |
| GO:200037916 | Oral cavity | OSCC | positive regulation of reactive oxygen species metabolic process | 43/7305 | 76/18723 | 1.41e-03 | 6.84e-03 | 43 |
| GO:00067203 | Oral cavity | OSCC | isoprenoid metabolic process | 59/7305 | 116/18723 | 6.18e-03 | 2.33e-02 | 59 |
| GO:00082024 | Oral cavity | OSCC | steroid metabolic process | 146/7305 | 319/18723 | 7.78e-03 | 2.85e-02 | 146 |
| GO:200037717 | Oral cavity | LP | regulation of reactive oxygen species metabolic process | 67/4623 | 157/18723 | 5.54e-07 | 1.51e-05 | 67 |
| GO:200037917 | Oral cavity | LP | positive regulation of reactive oxygen species metabolic process | 35/4623 | 76/18723 | 4.04e-05 | 5.90e-04 | 35 |
| GO:007259317 | Oral cavity | LP | reactive oxygen species metabolic process | 85/4623 | 239/18723 | 1.04e-04 | 1.26e-03 | 85 |
| GO:000606613 | Oral cavity | LP | alcohol metabolic process | 111/4623 | 353/18723 | 2.24e-03 | 1.62e-02 | 111 |
| GO:004218012 | Oral cavity | LP | cellular ketone metabolic process | 70/4623 | 211/18723 | 3.29e-03 | 2.21e-02 | 70 |
| GO:200037719 | Skin | cSCC | regulation of reactive oxygen species metabolic process | 58/4864 | 157/18723 | 1.55e-03 | 9.60e-03 | 58 |
| GO:007259319 | Skin | cSCC | reactive oxygen species metabolic process | 81/4864 | 239/18723 | 3.80e-03 | 2.03e-02 | 81 |
| Page: 1 2 3 |
| Pathway ID | Tissue | Disease Stage | Description | Gene Ratio | Bg Ratio | pvalue | p.adjust | qvalue | Count |
| hsa041467 | Esophagus | ESCC | Peroxisome | 55/4205 | 82/8465 | 1.04e-03 | 3.27e-03 | 1.68e-03 | 55 |
| hsa0414612 | Esophagus | ESCC | Peroxisome | 55/4205 | 82/8465 | 1.04e-03 | 3.27e-03 | 1.68e-03 | 55 |
| hsa041462 | Liver | Cirrhotic | Peroxisome | 36/2530 | 82/8465 | 4.79e-03 | 1.74e-02 | 1.07e-02 | 36 |
| hsa041463 | Liver | Cirrhotic | Peroxisome | 36/2530 | 82/8465 | 4.79e-03 | 1.74e-02 | 1.07e-02 | 36 |
| hsa041464 | Liver | HCC | Peroxisome | 58/4020 | 82/8465 | 1.57e-05 | 1.05e-04 | 5.85e-05 | 58 |
| hsa041465 | Liver | HCC | Peroxisome | 58/4020 | 82/8465 | 1.57e-05 | 1.05e-04 | 5.85e-05 | 58 |
| hsa041466 | Oral cavity | OSCC | Peroxisome | 47/3704 | 82/8465 | 9.01e-03 | 2.01e-02 | 1.03e-02 | 47 |
| hsa0414611 | Oral cavity | OSCC | Peroxisome | 47/3704 | 82/8465 | 9.01e-03 | 2.01e-02 | 1.03e-02 | 47 |
| hsa0414621 | Oral cavity | LP | Peroxisome | 33/2418 | 82/8465 | 1.48e-02 | 4.69e-02 | 3.03e-02 | 33 |
| hsa0414631 | Oral cavity | LP | Peroxisome | 33/2418 | 82/8465 | 1.48e-02 | 4.69e-02 | 3.03e-02 | 33 |
| Page: 1 |
Top |
Cell-cell communication analysis |
| Identification of potential cell-cell interactions between two cell types and their ligand-receptor pairs for different disease states |
| Ligand | Receptor | LRpair | Pathway | Tissue | Disease Stage |
| Page: 1 |
Top |
Single-cell gene regulatory network inference analysis |
| Find out the significant the regulons (TFs) and the target genes of each regulon across cell types for different disease states |
| TF | Cell Type | Tissue | Disease Stage | Target Gene | RSS | Regulon Activity |
| ∗The dot plots of a searched regulon are shown for all cell subpopulations in each disease state of each tissue based on the regulon specific score inferred using pySCENIC and by calculating the average expression. |
| Page: 1 |
Top |
Somatic mutation of malignant transformation related genes |
| Annotation of somatic variants for genes involved in malignant transformation |
| Hugo Symbol | Variant Class | Variant Classification | dbSNP RS | HGVSc | HGVSp | HGVSp Short | SWISSPROT | BIOTYPE | SIFT | PolyPhen | Tumor Sample Barcode | Tissue | Histology | Sex | Age | Stage | Therapy Types | Drugs | Outcome |
| DHRS4 | SNV | Missense_Mutation | c.289N>A | p.Glu97Lys | p.E97K | Q9BTZ2 | protein_coding | tolerated(0.55) | benign(0.006) | TCGA-C8-A12Z-01 | Breast | breast invasive carcinoma | Female | <65 | I/II | Chemotherapy | 5-fluorouracil | CR | |
| DHRS4 | insertion | Nonsense_Mutation | novel | c.211_212insGTCCTCCCTTTTATCCATCCACCCATCCATTCATTTGCT | p.Gln71delinsArgProProPheTyrProSerThrHisProPheIleCysTer | p.Q71delinsRPPFYPSTHPFIC* | Q9BTZ2 | protein_coding | TCGA-B6-A0I8-01 | Breast | breast invasive carcinoma | Female | <65 | I/II | Unknown | Unknown | PD | ||
| DHRS4 | SNV | Missense_Mutation | rs200717541 | c.344N>G | p.Ser115Cys | p.S115C | Q9BTZ2 | protein_coding | tolerated(0.43) | benign(0.063) | TCGA-IR-A3LL-01 | Cervix | cervical & endocervical cancer | Female | <65 | I/II | Chemotherapy | cisplatin | CR |
| DHRS4 | SNV | Missense_Mutation | novel | c.829N>T | p.Arg277Cys | p.R277C | Q9BTZ2 | protein_coding | deleterious(0) | probably_damaging(0.998) | TCGA-A5-A2K3-01 | Endometrium | uterine corpus endometrioid carcinoma | Female | >=65 | I/II | Chemotherapy | carboplatin | SD |
| DHRS4 | SNV | Missense_Mutation | novel | c.203N>T | p.Asn68Ile | p.N68I | Q9BTZ2 | protein_coding | deleterious(0) | probably_damaging(0.999) | TCGA-AJ-A3EK-01 | Endometrium | uterine corpus endometrioid carcinoma | Female | <65 | I/II | Chemotherapy | carboplatin | CR |
| DHRS4 | SNV | Missense_Mutation | rs754460638 | c.746N>T | p.Ala249Val | p.A249V | Q9BTZ2 | protein_coding | deleterious(0.01) | benign(0.339) | TCGA-DI-A1BU-01 | Endometrium | uterine corpus endometrioid carcinoma | Female | <65 | I/II | Chemotherapy | paclitaxel | SD |
| DHRS4 | SNV | Missense_Mutation | novel | c.611N>G | p.Asn204Ser | p.N204S | Q9BTZ2 | protein_coding | deleterious(0.03) | benign(0.313) | TCGA-FI-A2D5-01 | Endometrium | uterine corpus endometrioid carcinoma | Female | <65 | III/IV | Chemotherapy | carboplatinum | PD |
| DHRS4 | SNV | Missense_Mutation | c.644N>G | p.Ile215Ser | p.I215S | Q9BTZ2 | protein_coding | deleterious(0) | probably_damaging(1) | TCGA-DD-A1EA-01 | Liver | liver hepatocellular carcinoma | Male | >=65 | I/II | Unknown | Unknown | PD | |
| DHRS4 | SNV | Missense_Mutation | rs761725199 | c.299N>G | p.Val100Gly | p.V100G | Q9BTZ2 | protein_coding | deleterious(0.01) | benign(0.384) | TCGA-DD-A3A7-01 | Liver | liver hepatocellular carcinoma | Male | >=65 | III/IV | Chemotherapy | unknown | PD |
| DHRS4 | SNV | Missense_Mutation | novel | c.344N>T | p.Ser115Phe | p.S115F | Q9BTZ2 | protein_coding | deleterious(0.01) | probably_damaging(0.974) | TCGA-85-A4JC-01 | Lung | lung squamous cell carcinoma | Male | >=65 | I/II | Chemotherapy | unknown | PD |
| Page: 1 2 |
Top |
Related drugs of malignant transformation related genes |
| Identification of chemicals and drugs interact with genes involved in malignant transfromation |
| (DGIdb 4.0) |
| Entrez ID | Symbol | Category | Interaction Types | Drug Claim Name | Drug Name | PMIDs |
| Page: 1 |

Copyright 2023-Present -The University of Texas Health Science Center at Houston |