
|
|||||
|
 | |
| |
| |
| |
| |
| |
|
Gene: DENR |
Gene summary for DENR |
| Gene information | Species | Human | Gene symbol | DENR | Gene ID | 8562 |
| Gene name | density regulated re-initiation and release factor | |
| Gene Alias | DRP | |
| Cytomap | 12q24.31 | |
| Gene Type | protein-coding | GO ID | GO:0001731 | UniProtAcc | A0A024RBR3 |
Top |
Malignant transformation analysis |
| Identification of the aberrant gene expression in precancerous and cancerous lesions by comparing the gene expression of stem-like cells in diseased tissues with normal stem cells |
| Entrez ID | Symbol | Replicates | Species | Organ | Tissue | Adj P-value | Log2FC | Malignancy |
| 8562 | DENR | LZE3D | Human | Esophagus | HGIN | 7.53e-06 | 3.75e-01 | 0.0668 |
| 8562 | DENR | LZE4T | Human | Esophagus | ESCC | 7.58e-19 | 4.41e-01 | 0.0811 |
| 8562 | DENR | LZE7T | Human | Esophagus | ESCC | 4.32e-07 | 7.28e-01 | 0.0667 |
| 8562 | DENR | LZE8T | Human | Esophagus | ESCC | 4.12e-08 | 2.39e-01 | 0.067 |
| 8562 | DENR | LZE20T | Human | Esophagus | ESCC | 1.98e-08 | 2.82e-01 | 0.0662 |
| 8562 | DENR | LZE22D1 | Human | Esophagus | HGIN | 1.22e-07 | -1.15e-02 | 0.0595 |
| 8562 | DENR | LZE22T | Human | Esophagus | ESCC | 2.77e-05 | 3.27e-01 | 0.068 |
| 8562 | DENR | LZE24T | Human | Esophagus | ESCC | 2.67e-13 | 5.65e-01 | 0.0596 |
| 8562 | DENR | P1T-E | Human | Esophagus | ESCC | 1.29e-14 | 1.01e+00 | 0.0875 |
| 8562 | DENR | P2T-E | Human | Esophagus | ESCC | 2.02e-63 | 1.29e+00 | 0.1177 |
| 8562 | DENR | P4T-E | Human | Esophagus | ESCC | 1.49e-34 | 1.13e+00 | 0.1323 |
| 8562 | DENR | P5T-E | Human | Esophagus | ESCC | 2.44e-37 | 9.81e-01 | 0.1327 |
| 8562 | DENR | P8T-E | Human | Esophagus | ESCC | 4.40e-42 | 9.31e-01 | 0.0889 |
| 8562 | DENR | P9T-E | Human | Esophagus | ESCC | 1.17e-10 | 3.43e-01 | 0.1131 |
| 8562 | DENR | P10T-E | Human | Esophagus | ESCC | 8.27e-55 | 8.84e-01 | 0.116 |
| 8562 | DENR | P11T-E | Human | Esophagus | ESCC | 2.56e-15 | 9.05e-01 | 0.1426 |
| 8562 | DENR | P12T-E | Human | Esophagus | ESCC | 2.72e-32 | 5.10e-01 | 0.1122 |
| 8562 | DENR | P15T-E | Human | Esophagus | ESCC | 9.05e-23 | 5.70e-01 | 0.1149 |
| 8562 | DENR | P16T-E | Human | Esophagus | ESCC | 2.13e-43 | 8.65e-01 | 0.1153 |
| 8562 | DENR | P17T-E | Human | Esophagus | ESCC | 9.00e-19 | 7.60e-01 | 0.1278 |
| Page: 1 2 3 4 5 6 7 |
| Tissue | Expression Dynamics | Abbreviation |
| Esophagus | 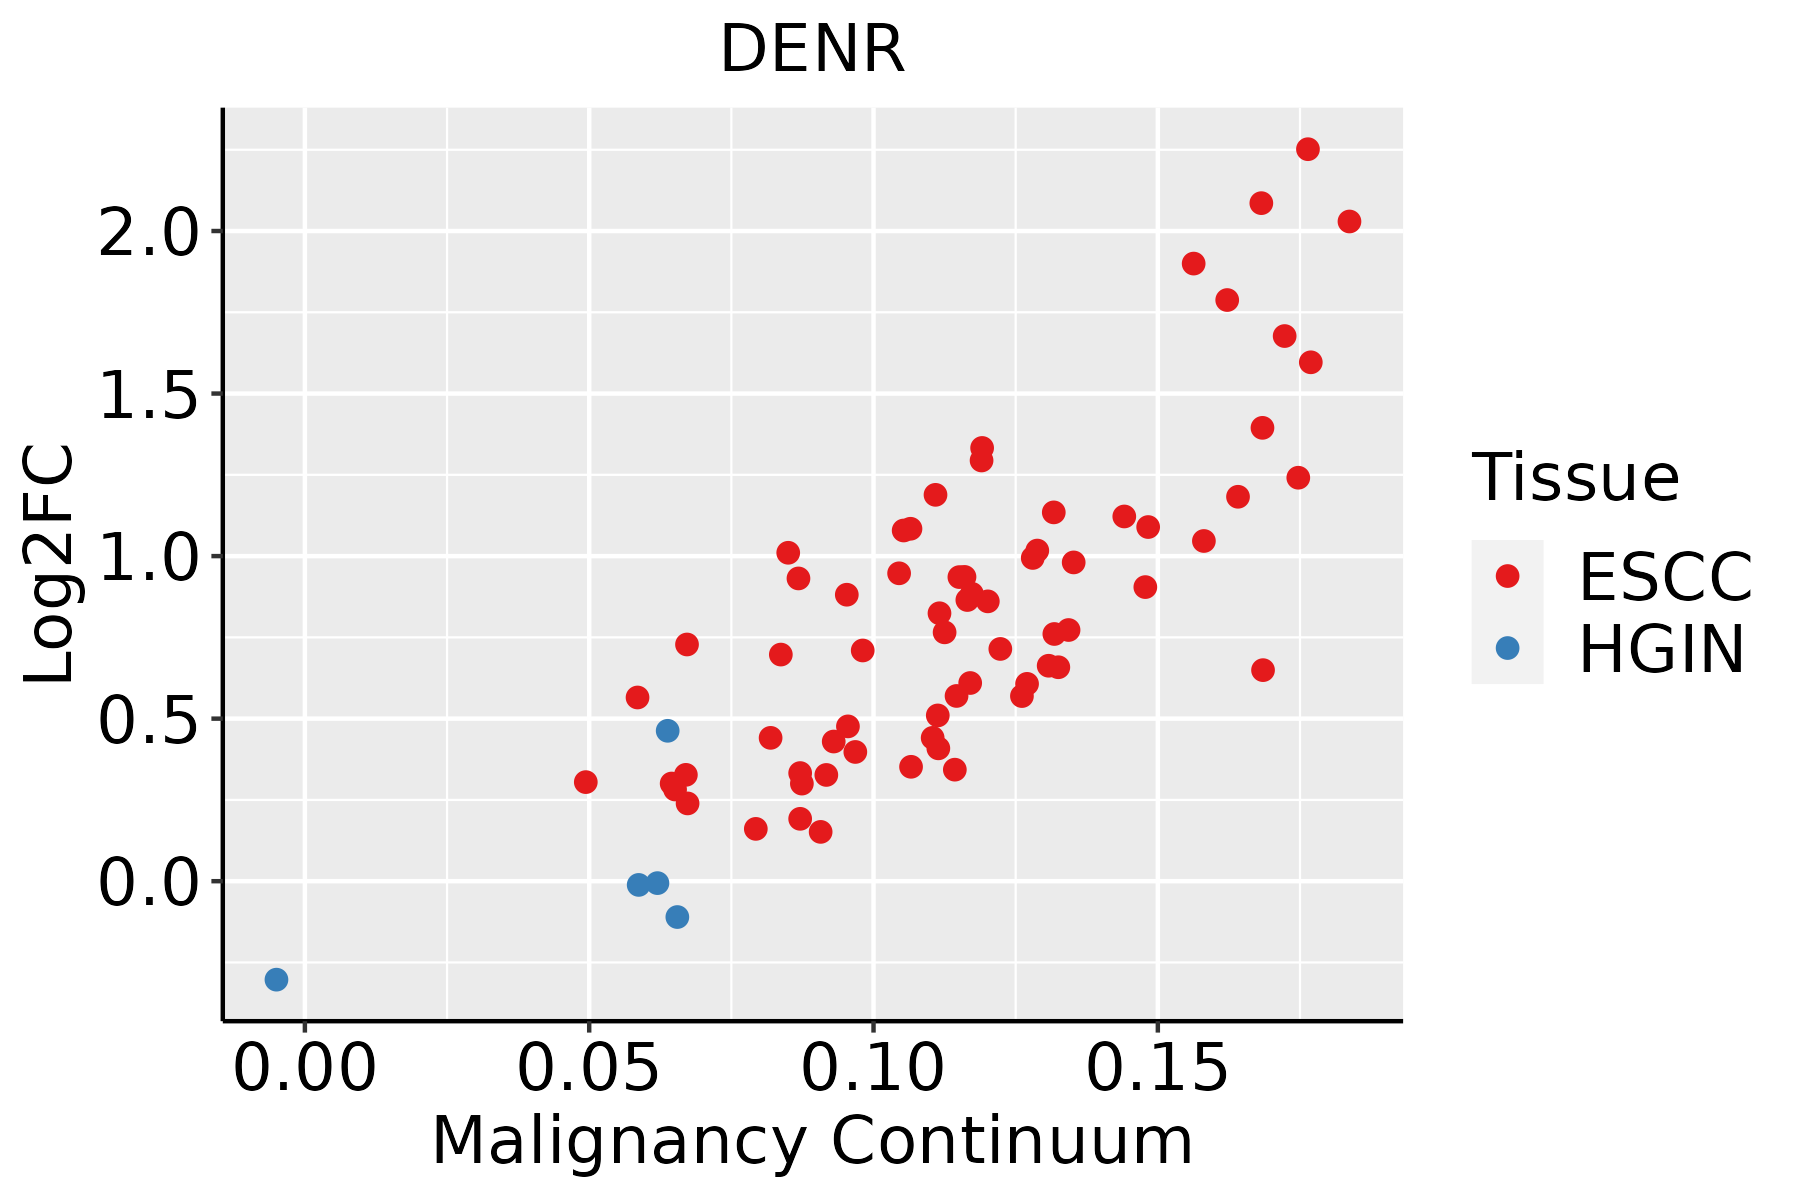 | ESCC: Esophageal squamous cell carcinoma |
| HGIN: High-grade intraepithelial neoplasias | ||
| LGIN: Low-grade intraepithelial neoplasias | ||
| Liver | 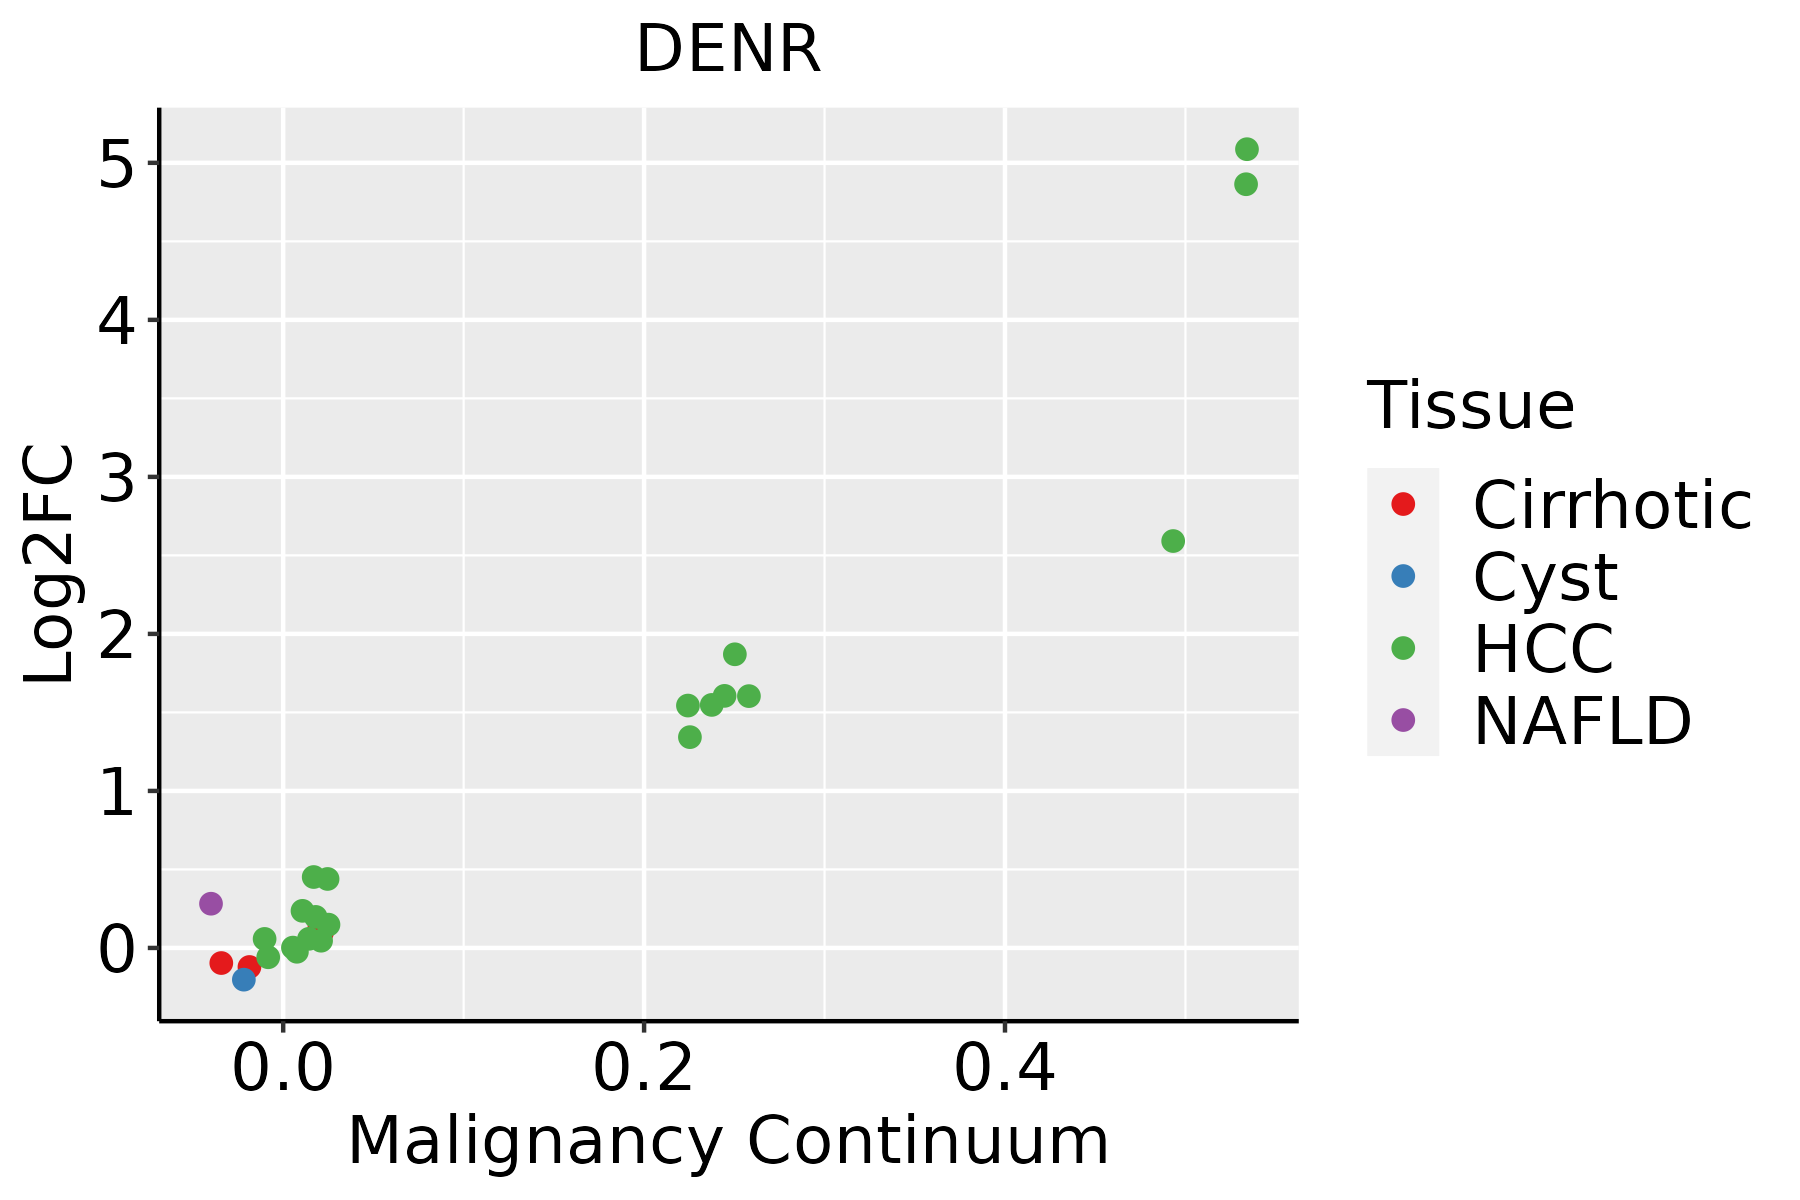 | HCC: Hepatocellular carcinoma |
| NAFLD: Non-alcoholic fatty liver disease | ||
| Oral Cavity | 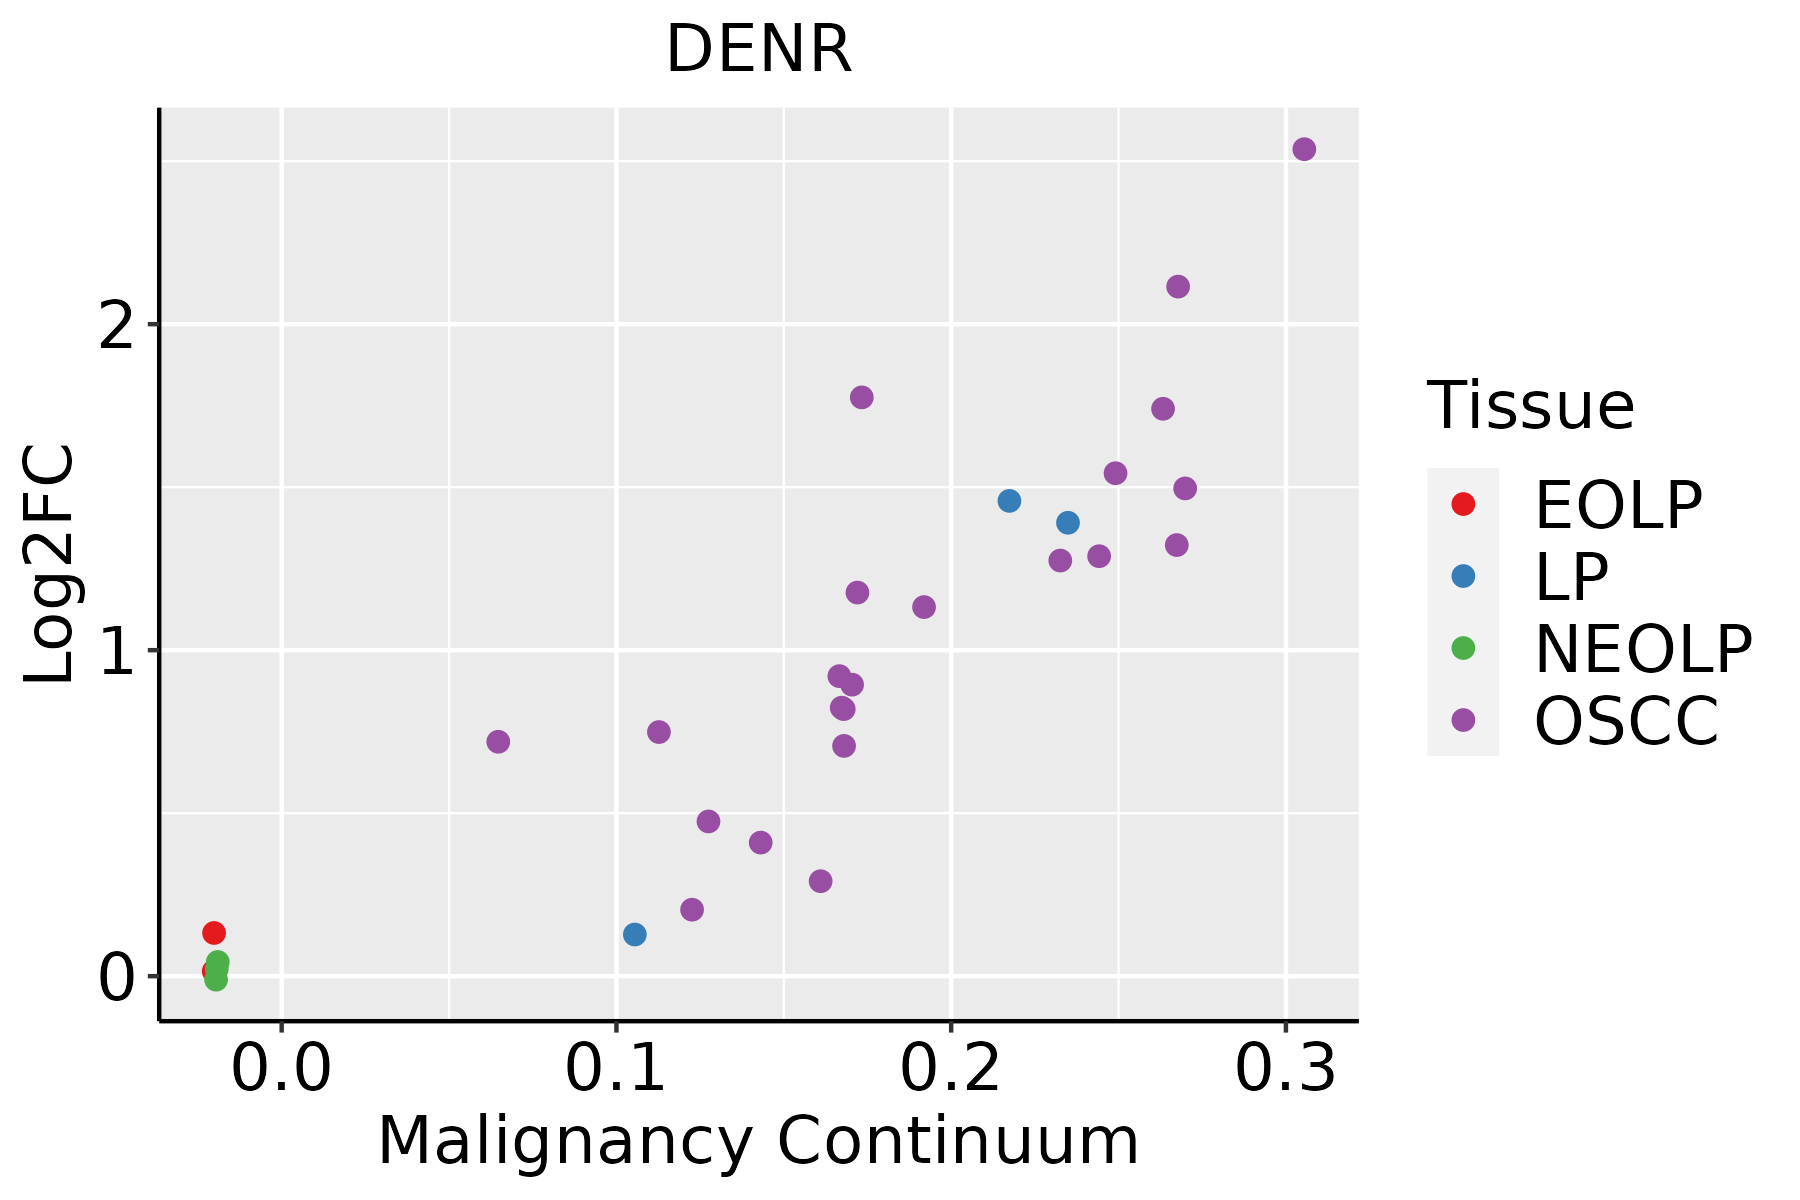 | EOLP: Erosive Oral lichen planus |
| LP: leukoplakia | ||
| NEOLP: Non-erosive oral lichen planus | ||
| OSCC: Oral squamous cell carcinoma | ||
| Prostate | 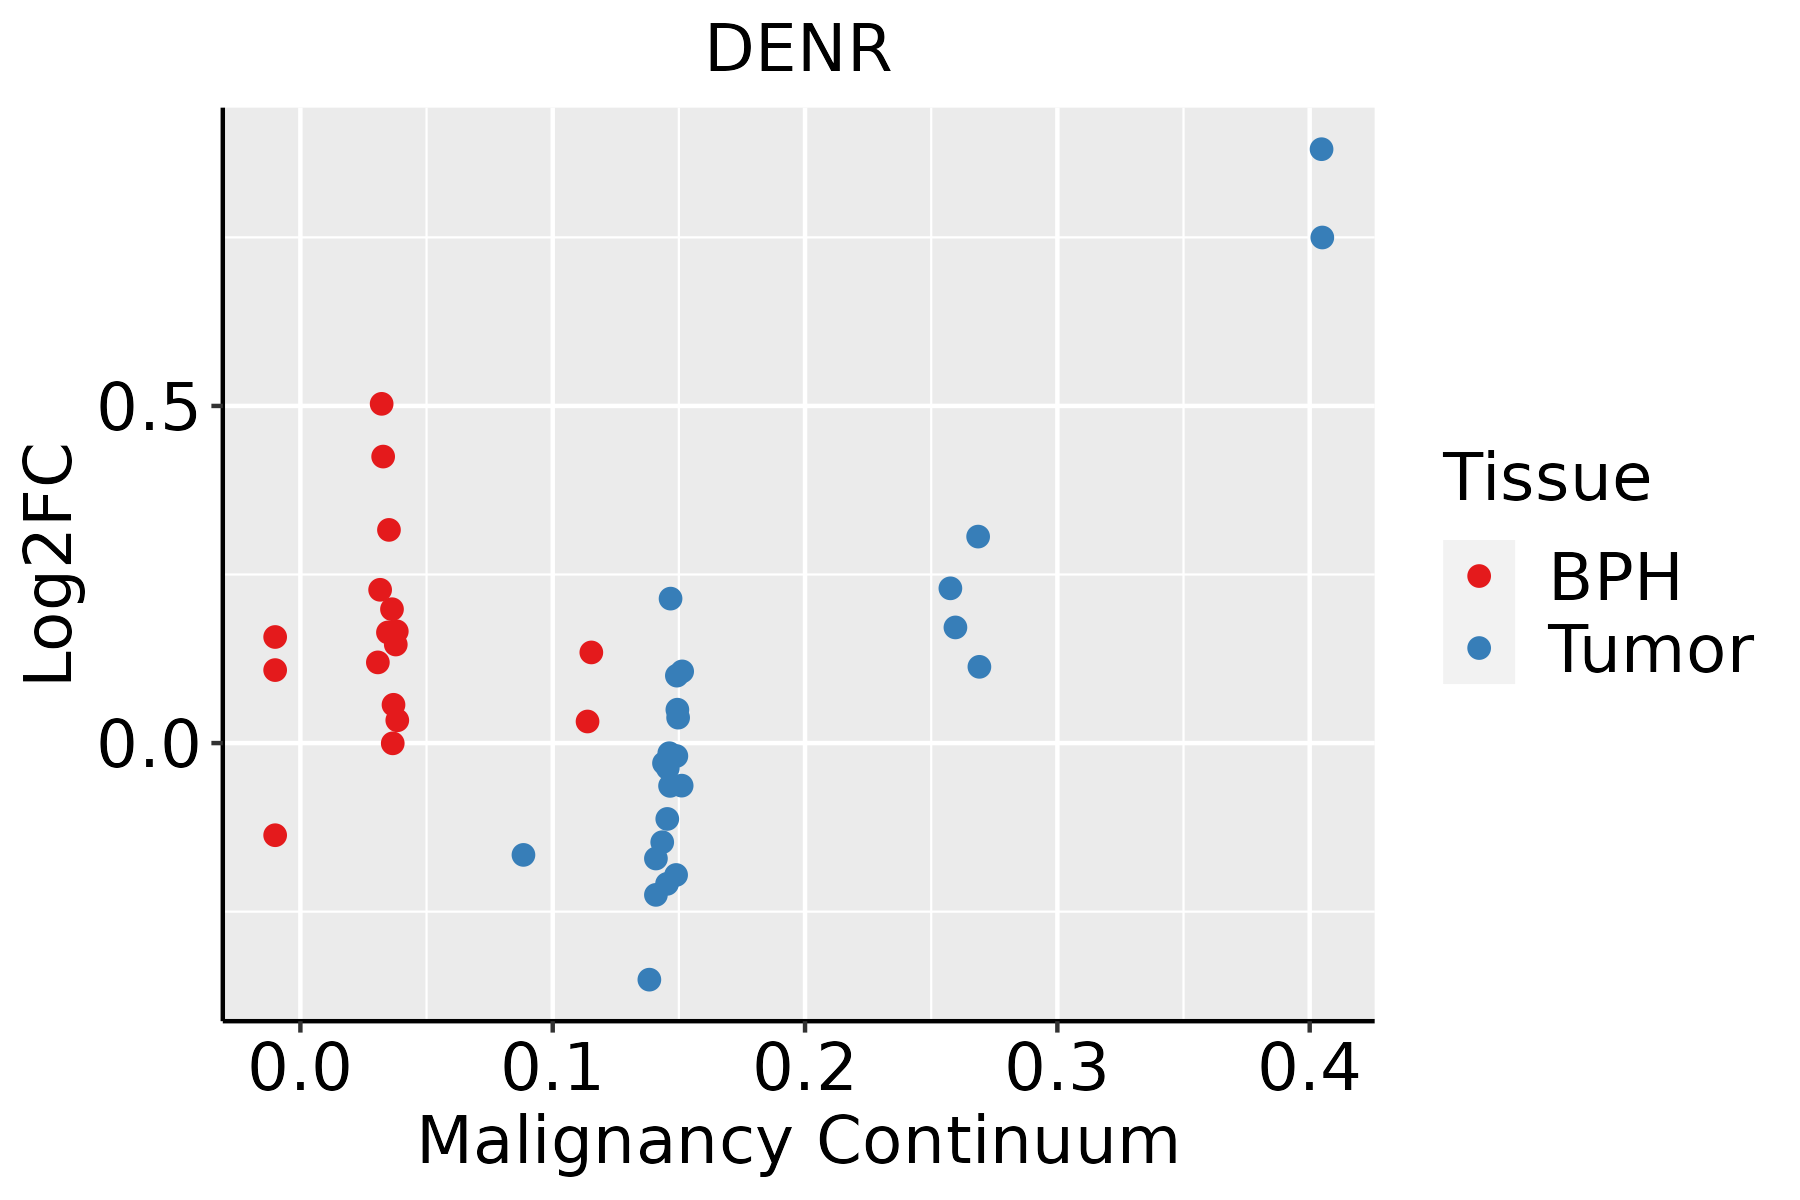 | BPH: Benign Prostatic Hyperplasia |
| Skin | 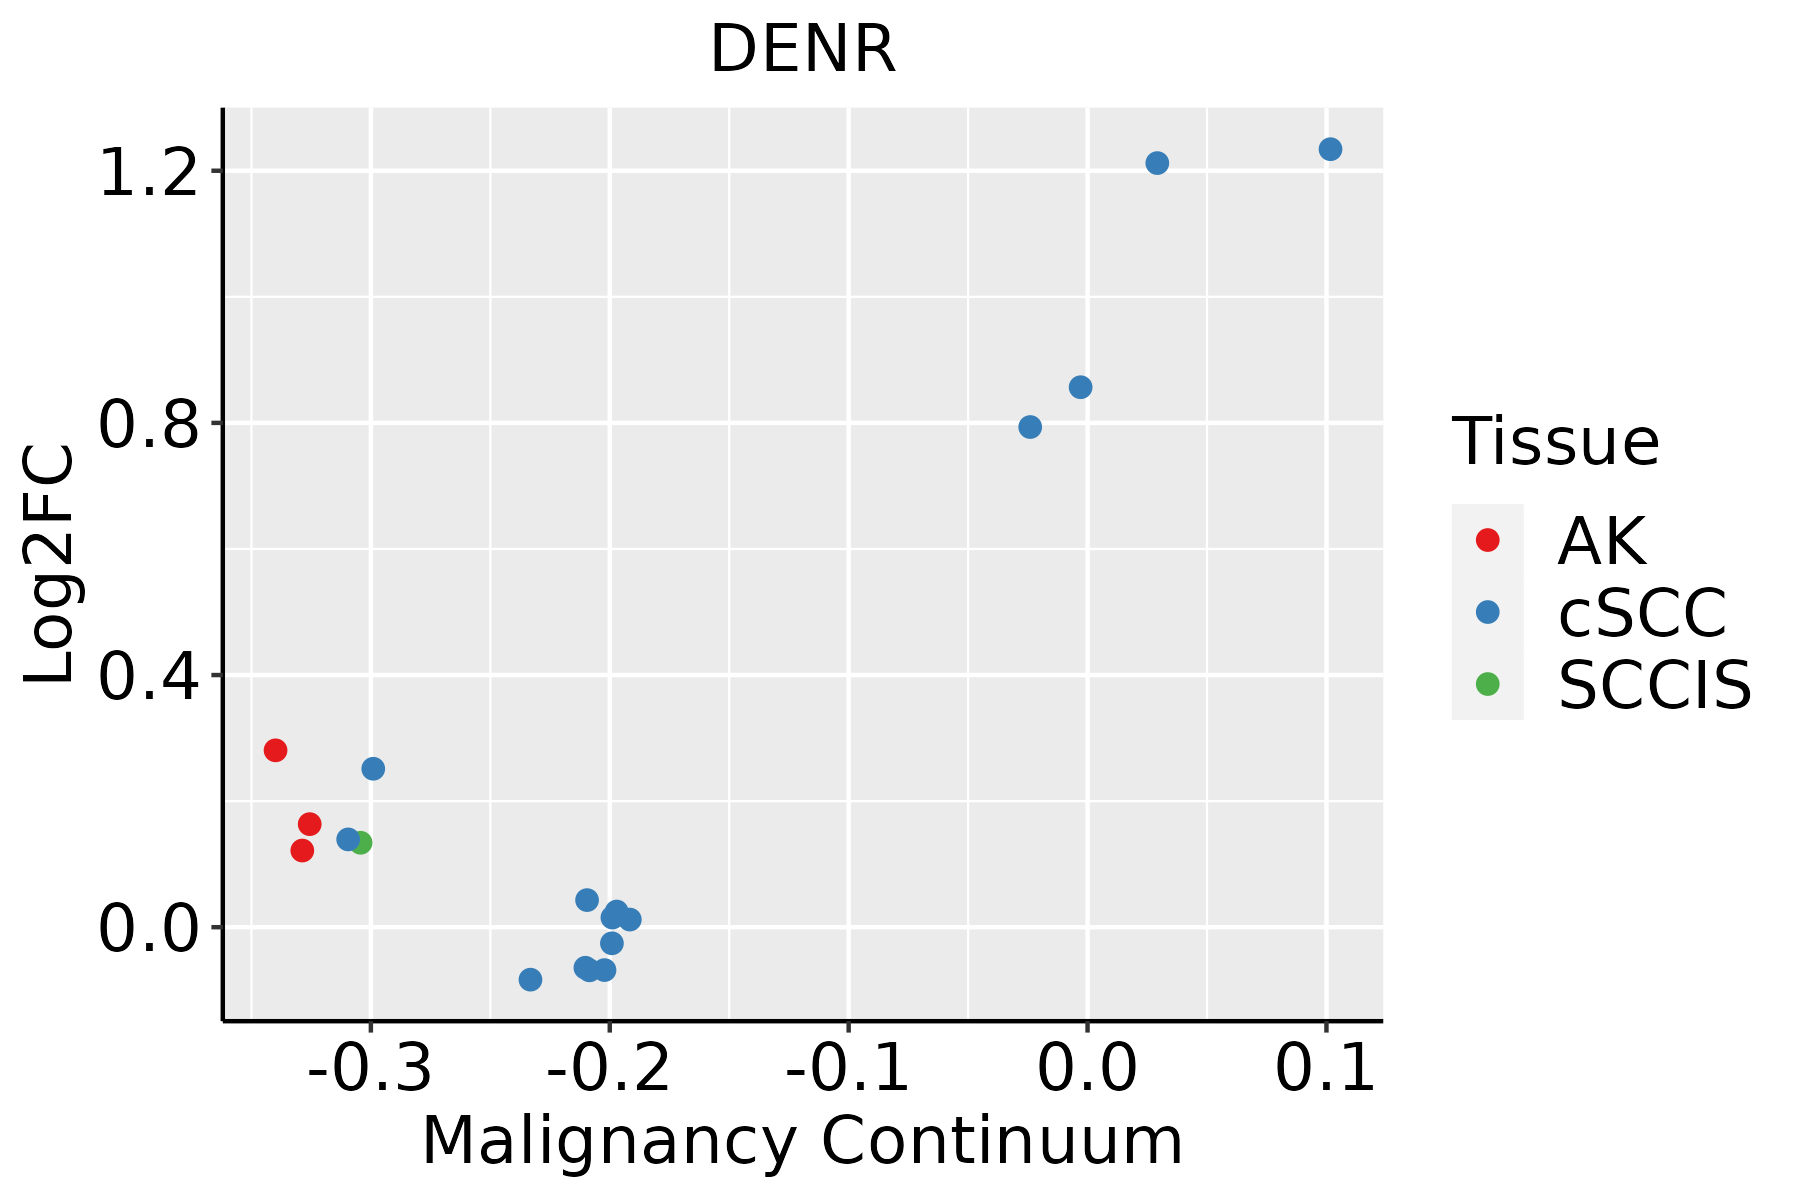 | AK: Actinic keratosis |
| cSCC: Cutaneous squamous cell carcinoma | ||
| SCCIS:squamous cell carcinoma in situ | ||
| Thyroid | 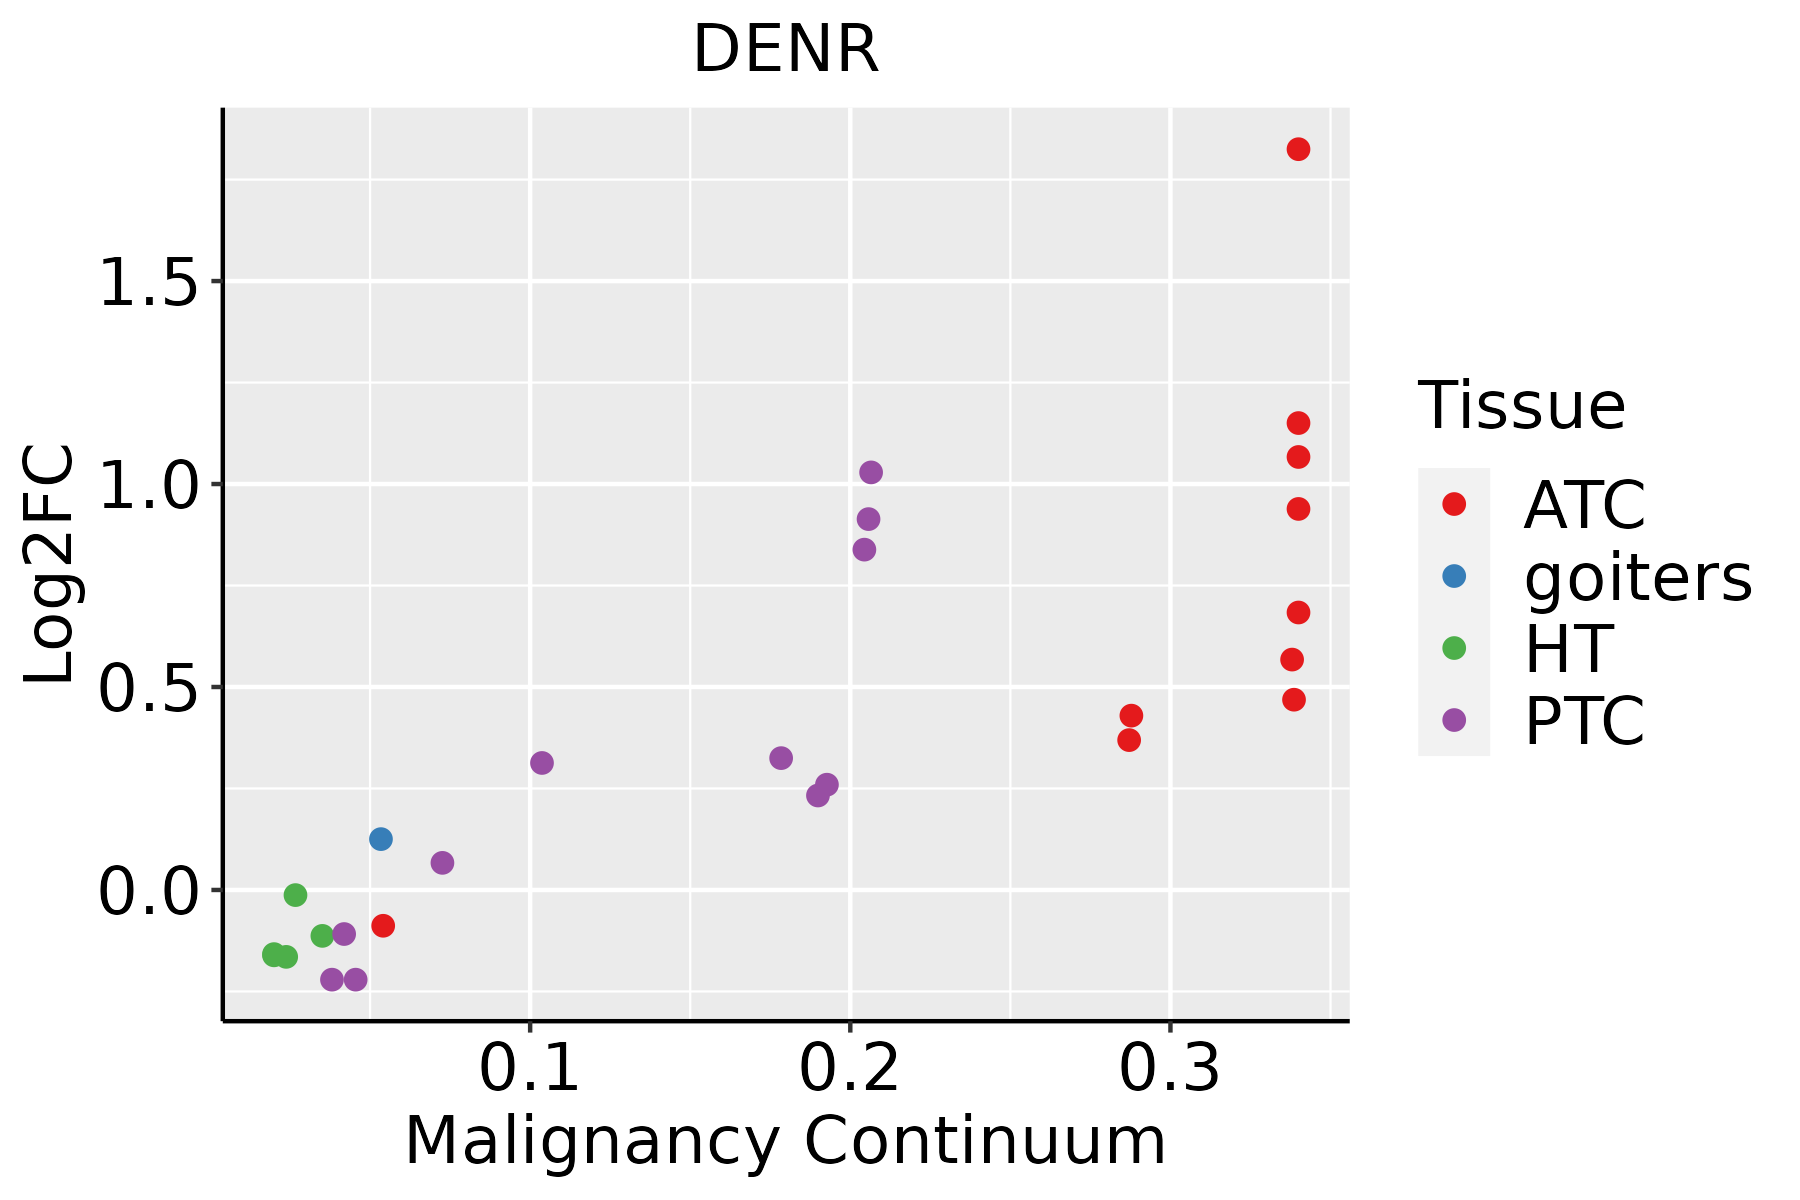 | ATC: Anaplastic thyroid cancer |
| HT: Hashimoto's thyroiditis | ||
| PTC: Papillary thyroid cancer |
| ∗log2FC in expression of this searched gene in stem-like cells from each diseased tissue sample relative to stem-like cells in normal samples in each tissue plotted against the malignancy continuum. Samples are colored based on if they are from different disease stage. |
Top |
Malignant transformation related pathway analysis |
| Find out the enriched GO biological processes and KEGG pathways involved in transition from healthy to precancer to cancer |
| Tissue | Disease Stage | Enriched GO biological Processes |
| Colorectum | AD |  |
| Colorectum | SER |  |
| Colorectum | MSS |  |
| Colorectum | MSI-H |  |
| Colorectum | FAP |  |
| ∗Top 15 enriched GO BP terms are showed in the bar plot of each disease state in each tissue. Each row represents a significant GO biological process which is colored according to the -log10(p.adjust). |
| Page: 1 2 3 4 5 6 7 8 9 |
| GO ID | Tissue | Disease Stage | Description | Gene Ratio | Bg Ratio | pvalue | p.adjust | Count |
| GO:000218312 | Liver | Cirrhotic | cytoplasmic translational initiation | 26/4634 | 34/18723 | 3.38e-10 | 1.63e-08 | 26 |
| GO:19030084 | Liver | Cirrhotic | organelle disassembly | 59/4634 | 114/18723 | 4.82e-10 | 2.27e-08 | 59 |
| GO:00190816 | Liver | Cirrhotic | viral translation | 13/4634 | 16/18723 | 3.31e-06 | 5.74e-05 | 13 |
| GO:00017315 | Liver | Cirrhotic | formation of translation preinitiation complex | 10/4634 | 11/18723 | 7.30e-06 | 1.13e-04 | 10 |
| GO:00755226 | Liver | Cirrhotic | IRES-dependent viral translational initiation | 10/4634 | 11/18723 | 7.30e-06 | 1.13e-04 | 10 |
| GO:002261322 | Liver | HCC | ribonucleoprotein complex biogenesis | 355/7958 | 463/18723 | 7.76e-52 | 4.92e-48 | 355 |
| GO:000218122 | Liver | HCC | cytoplasmic translation | 132/7958 | 148/18723 | 9.09e-33 | 5.76e-30 | 132 |
| GO:001603222 | Liver | HCC | viral process | 286/7958 | 415/18723 | 4.41e-28 | 1.86e-25 | 286 |
| GO:002241112 | Liver | HCC | cellular component disassembly | 282/7958 | 443/18723 | 1.02e-19 | 1.38e-17 | 282 |
| GO:007182622 | Liver | HCC | ribonucleoprotein complex subunit organization | 159/7958 | 227/18723 | 3.14e-17 | 3.06e-15 | 159 |
| GO:000641322 | Liver | HCC | translational initiation | 94/7958 | 118/18723 | 1.39e-16 | 1.24e-14 | 94 |
| GO:002261822 | Liver | HCC | ribonucleoprotein complex assembly | 153/7958 | 220/18723 | 3.44e-16 | 2.91e-14 | 153 |
| GO:001908021 | Liver | HCC | viral gene expression | 77/7958 | 94/18723 | 4.33e-15 | 3.12e-13 | 77 |
| GO:190300811 | Liver | HCC | organelle disassembly | 89/7958 | 114/18723 | 8.68e-15 | 5.73e-13 | 89 |
| GO:000218322 | Liver | HCC | cytoplasmic translational initiation | 29/7958 | 34/18723 | 3.26e-07 | 5.62e-06 | 29 |
| GO:001908111 | Liver | HCC | viral translation | 15/7958 | 16/18723 | 2.55e-05 | 2.66e-04 | 15 |
| GO:007552211 | Liver | HCC | IRES-dependent viral translational initiation | 11/7958 | 11/18723 | 8.15e-05 | 7.19e-04 | 11 |
| GO:000173111 | Liver | HCC | formation of translation preinitiation complex | 10/7958 | 11/18723 | 1.30e-03 | 7.01e-03 | 10 |
| GO:002261320 | Oral cavity | OSCC | ribonucleoprotein complex biogenesis | 333/7305 | 463/18723 | 8.28e-48 | 5.24e-44 | 333 |
| GO:000218120 | Oral cavity | OSCC | cytoplasmic translation | 133/7305 | 148/18723 | 1.94e-38 | 2.46e-35 | 133 |
| Page: 1 2 3 4 5 6 7 8 9 |
| Pathway ID | Tissue | Disease Stage | Description | Gene Ratio | Bg Ratio | pvalue | p.adjust | qvalue | Count |
| Page: 1 |
Top |
Cell-cell communication analysis |
| Identification of potential cell-cell interactions between two cell types and their ligand-receptor pairs for different disease states |
| Ligand | Receptor | LRpair | Pathway | Tissue | Disease Stage |
| Page: 1 |
Top |
Single-cell gene regulatory network inference analysis |
| Find out the significant the regulons (TFs) and the target genes of each regulon across cell types for different disease states |
| TF | Cell Type | Tissue | Disease Stage | Target Gene | RSS | Regulon Activity |
| ∗The dot plots of a searched regulon are shown for all cell subpopulations in each disease state of each tissue based on the regulon specific score inferred using pySCENIC and by calculating the average expression. |
| Page: 1 |
Top |
Somatic mutation of malignant transformation related genes |
| Annotation of somatic variants for genes involved in malignant transformation |
| Hugo Symbol | Variant Class | Variant Classification | dbSNP RS | HGVSc | HGVSp | HGVSp Short | SWISSPROT | BIOTYPE | SIFT | PolyPhen | Tumor Sample Barcode | Tissue | Histology | Sex | Age | Stage | Therapy Types | Drugs | Outcome |
| DENR | deletion | Frame_Shift_Del | c.317delN | p.Lys108ArgfsTer10 | p.K108Rfs*10 | O43583 | protein_coding | TCGA-EI-6882-01 | Colorectum | rectum adenocarcinoma | Male | <65 | I/II | Unknown | Unknown | SD | |||
| DENR | SNV | Missense_Mutation | novel | c.375N>T | p.Lys125Asn | p.K125N | O43583 | protein_coding | tolerated(0.19) | possibly_damaging(0.874) | TCGA-A5-A0G1-01 | Endometrium | uterine corpus endometrioid carcinoma | Female | >=65 | I/II | Unknown | Unknown | SD |
| DENR | SNV | Missense_Mutation | novel | c.174G>T | p.Glu58Asp | p.E58D | O43583 | protein_coding | deleterious(0.01) | possibly_damaging(0.493) | TCGA-AP-A1DV-01 | Endometrium | uterine corpus endometrioid carcinoma | Female | <65 | I/II | Unknown | Unknown | SD |
| DENR | SNV | Missense_Mutation | c.401N>C | p.Leu134Pro | p.L134P | O43583 | protein_coding | deleterious(0.02) | probably_damaging(0.999) | TCGA-AX-A0J1-01 | Endometrium | uterine corpus endometrioid carcinoma | Female | >=65 | I/II | Unknown | Unknown | SD | |
| DENR | SNV | Missense_Mutation | novel | c.152C>G | p.Ala51Gly | p.A51G | O43583 | protein_coding | tolerated(0.37) | benign(0.001) | TCGA-AX-A3G7-01 | Endometrium | uterine corpus endometrioid carcinoma | Female | >=65 | III/IV | Unknown | Unknown | SD |
| DENR | SNV | Missense_Mutation | novel | c.456N>A | p.Phe152Leu | p.F152L | O43583 | protein_coding | deleterious(0) | probably_damaging(0.934) | TCGA-EO-A22X-01 | Endometrium | uterine corpus endometrioid carcinoma | Female | <65 | III/IV | Unspecific | Carboplatin | Complete Response |
| DENR | SNV | Missense_Mutation | novel | c.177N>T | p.Lys59Asn | p.K59N | O43583 | protein_coding | deleterious(0.04) | possibly_damaging(0.544) | TCGA-EO-A3AY-01 | Endometrium | uterine corpus endometrioid carcinoma | Female | <65 | I/II | Unknown | Unknown | PD |
| DENR | SNV | Missense_Mutation | novel | c.467C>T | p.Ala156Val | p.A156V | O43583 | protein_coding | tolerated(0.1) | benign(0.151) | TCGA-FI-A2D0-01 | Endometrium | uterine corpus endometrioid carcinoma | Female | <65 | I/II | Unknown | Unknown | SD |
| DENR | insertion | Frame_Shift_Ins | novel | c.316_317insA | p.Lys109GlufsTer30 | p.K109Efs*30 | O43583 | protein_coding | TCGA-EO-A22U-01 | Endometrium | uterine corpus endometrioid carcinoma | Female | >=65 | I/II | Unknown | Unknown | SD |
| Page: 1 |
Top |
Related drugs of malignant transformation related genes |
| Identification of chemicals and drugs interact with genes involved in malignant transfromation |
| (DGIdb 4.0) |
| Entrez ID | Symbol | Category | Interaction Types | Drug Claim Name | Drug Name | PMIDs |
| Page: 1 |

Copyright 2023-Present -The University of Texas Health Science Center at Houston |