Schematic overview of the cellular and molecular mechanisms involved in the cancer progression, including the proposed cellular and molecular mechanisms in cancer cells trajectory. AT1: alveolar type 1 cells; AT2: alveolar type 2 cells; AAH: atypical adenomatous hyperplasia; AIS: adenocarcinoma in situ; MIA: minimally invasive adenocarcinoma; IA: invasive adenocarcinoma; EMT: epithelial-mesenchymal transition

Home

Download

Statistics

Help

Contact

Center for Computational Systems Medicine
leaf

Gene summary

leaf

Malignant transformation analysis

leaf

Malignant transformation related pathway analysis

leaf

Cell-cell communication analysis

leaf

Single-cell gene regulatory network inference analysis

leaf

Somatic mutation of malignant transformation related genes

leaf

Related drugs of malignant transformation related genes

Gene: DDX21

Gene summary for DDX21

check button Gene summary.

Gene informationSpeciesHuman
Gene symbol

DDX21

Gene ID

9188

Gene nameDExD-box helicase 21
Gene AliasGUA
Cytomap10q22.1
Gene Typeprotein-coding
GO ID

GO:0001503

UniProtAcc

Q9NR30


Top

Malignant transformation analysis

check button Identification of the aberrant gene expression in precancerous and cancerous lesions by comparing the gene expression of stem-like cells in diseased tissues with normal stem cells
check button Malignant transformation involving gene list.
Entrez IDSymbolReplicatesSpeciesOrganTissueAdj P-valueLog2FCMalignancy
9188DDX21HTA11_866_2000001011HumanColorectumAD8.03e-05-2.38e-01-0.1001
9188DDX21HTA11_99999965104_69814HumanColorectumMSS2.89e-131.01e+000.281
9188DDX21HTA11_99999971662_82457HumanColorectumMSS9.39e-087.44e-010.3859
9188DDX21A002-C-010HumanColorectumFAP6.54e-04-2.31e-010.242
9188DDX21A015-C-203HumanColorectumFAP1.85e-20-4.17e-01-0.1294
9188DDX21A002-C-201HumanColorectumFAP2.06e-07-2.99e-010.0324
9188DDX21A002-C-203HumanColorectumFAP1.46e-02-2.13e-010.2786
9188DDX21A001-C-108HumanColorectumFAP2.35e-064.06e-02-0.0272
9188DDX21A002-C-205HumanColorectumFAP3.55e-10-2.59e-02-0.1236
9188DDX21A015-C-006HumanColorectumFAP7.43e-054.39e-02-0.0994
9188DDX21A015-C-106HumanColorectumFAP4.36e-058.19e-02-0.0511
9188DDX21A002-C-114HumanColorectumFAP4.44e-07-2.16e-01-0.1561
9188DDX21A015-C-104HumanColorectumFAP2.84e-15-1.80e-01-0.1899
9188DDX21A001-C-014HumanColorectumFAP1.23e-061.60e-020.0135
9188DDX21A002-C-016HumanColorectumFAP3.55e-12-1.95e-010.0521
9188DDX21A015-C-002HumanColorectumFAP3.30e-03-1.82e-01-0.0763
9188DDX21A001-C-203HumanColorectumFAP2.75e-05-3.06e-02-0.0481
9188DDX21A002-C-116HumanColorectumFAP3.99e-18-2.30e-01-0.0452
9188DDX21A014-C-008HumanColorectumFAP9.42e-066.15e-02-0.191
9188DDX21A018-E-020HumanColorectumFAP2.30e-08-3.30e-01-0.2034
Page: 1 2 3 4 5 6 7 8 9 

check button Transcriptomic changes along malignancy continuum.
TissueExpression DynamicsAbbreviation
Colorectum (GSE201348)The image shows the transcriptomic changes along malignancy continuum.log2FC in expression of this searched gene in stem-like cells from each diseased tissue sample relative to stem-like cells in normal samples in each tissue plotted against the malignancy continuum. Samples are colored based on if they are from different disease stage.FAP: Familial adenomatous polyposis
CRC: Colorectal cancer
Colorectum (HTA11)The image shows the transcriptomic changes along malignancy continuum.log2FC in expression of this searched gene in stem-like cells from each diseased tissue sample relative to stem-like cells in normal samples in each tissue plotted against the malignancy continuum. Samples are colored based on if they are from different disease stage.AD: Adenomas
SER: Sessile serrated lesions
MSI-H: Microsatellite-high colorectal cancer
MSS: Microsatellite stable colorectal cancer
EndometriumThe image shows the transcriptomic changes along malignancy continuum.log2FC in expression of this searched gene in stem-like cells from each diseased tissue sample relative to stem-like cells in normal samples in each tissue plotted against the malignancy continuum. Samples are colored based on if they are from different disease stage.
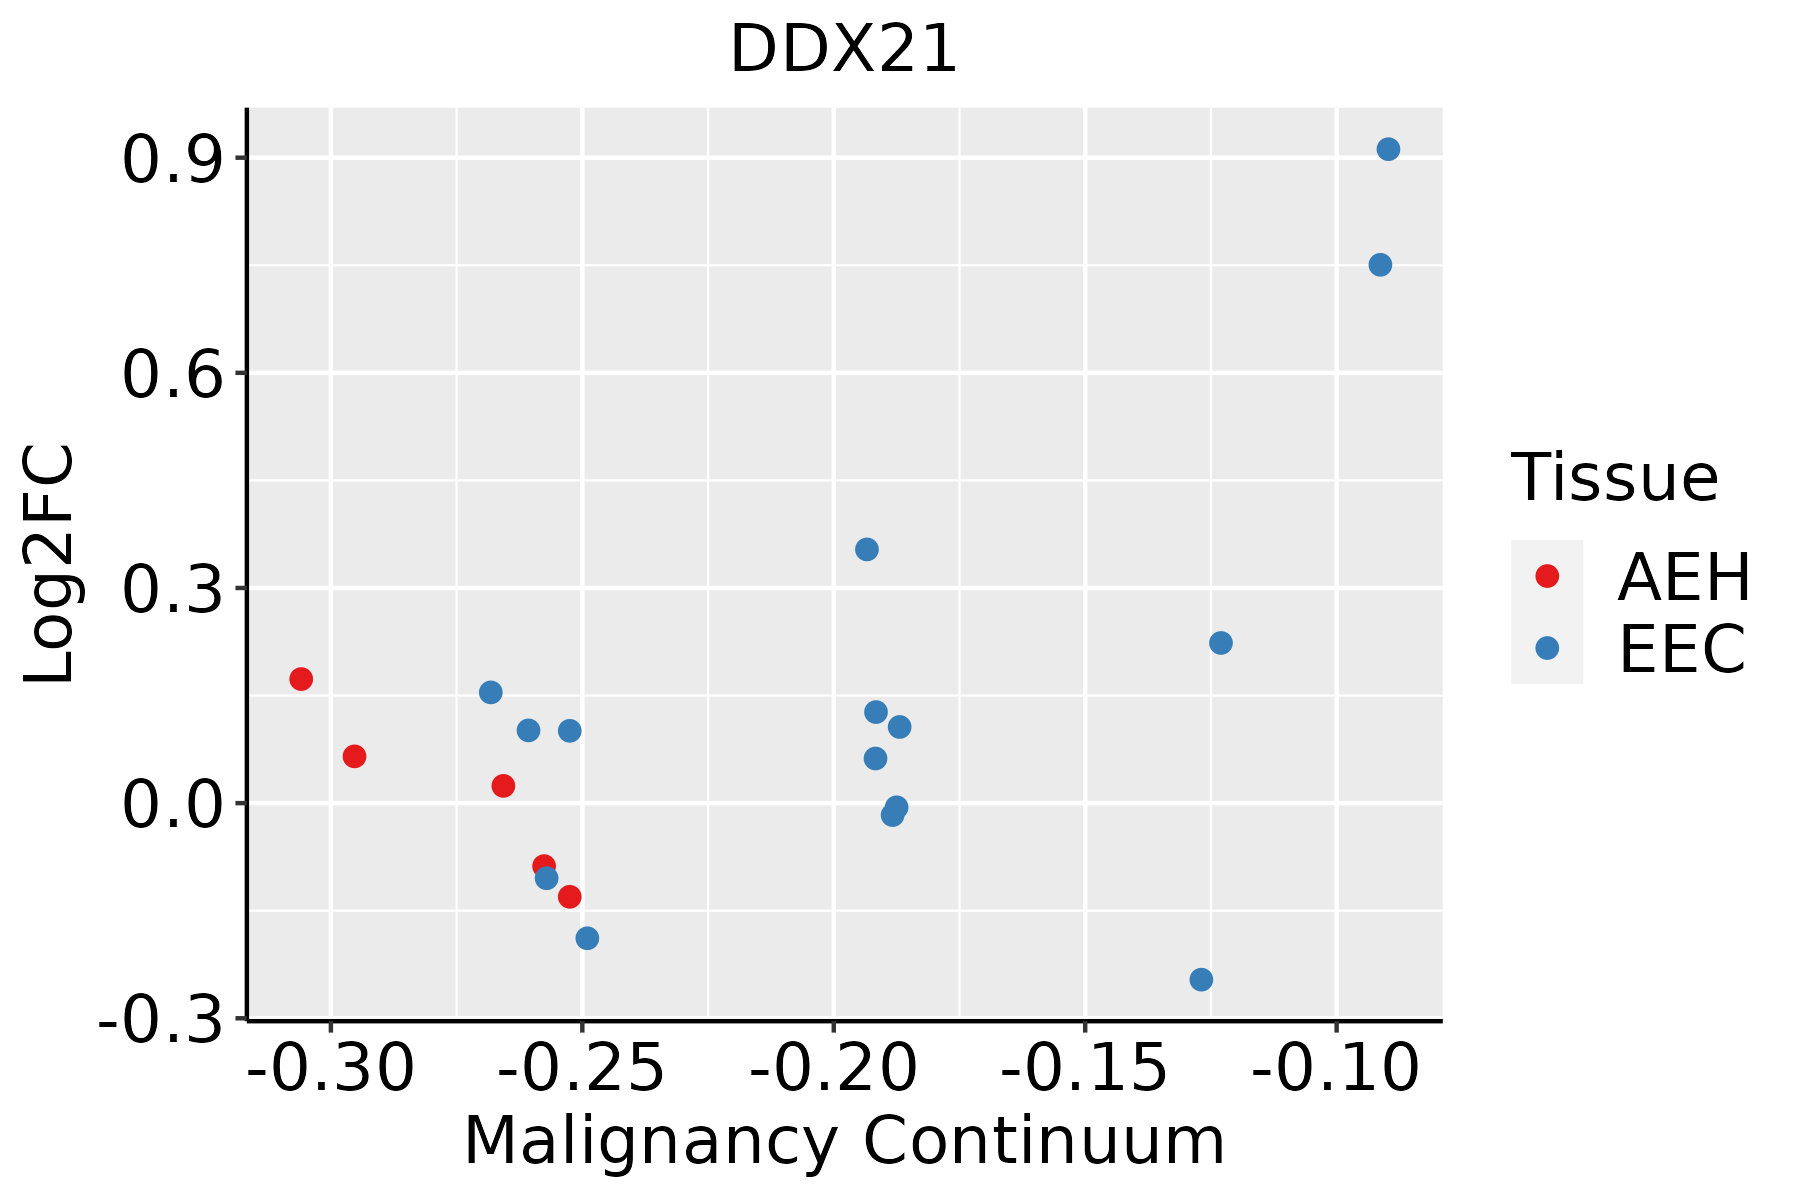
AEH: Atypical endometrial hyperplasia
EEC: Endometrioid Cancer
EsophagusThe image shows the transcriptomic changes along malignancy continuum.log2FC in expression of this searched gene in stem-like cells from each diseased tissue sample relative to stem-like cells in normal samples in each tissue plotted against the malignancy continuum. Samples are colored based on if they are from different disease stage.
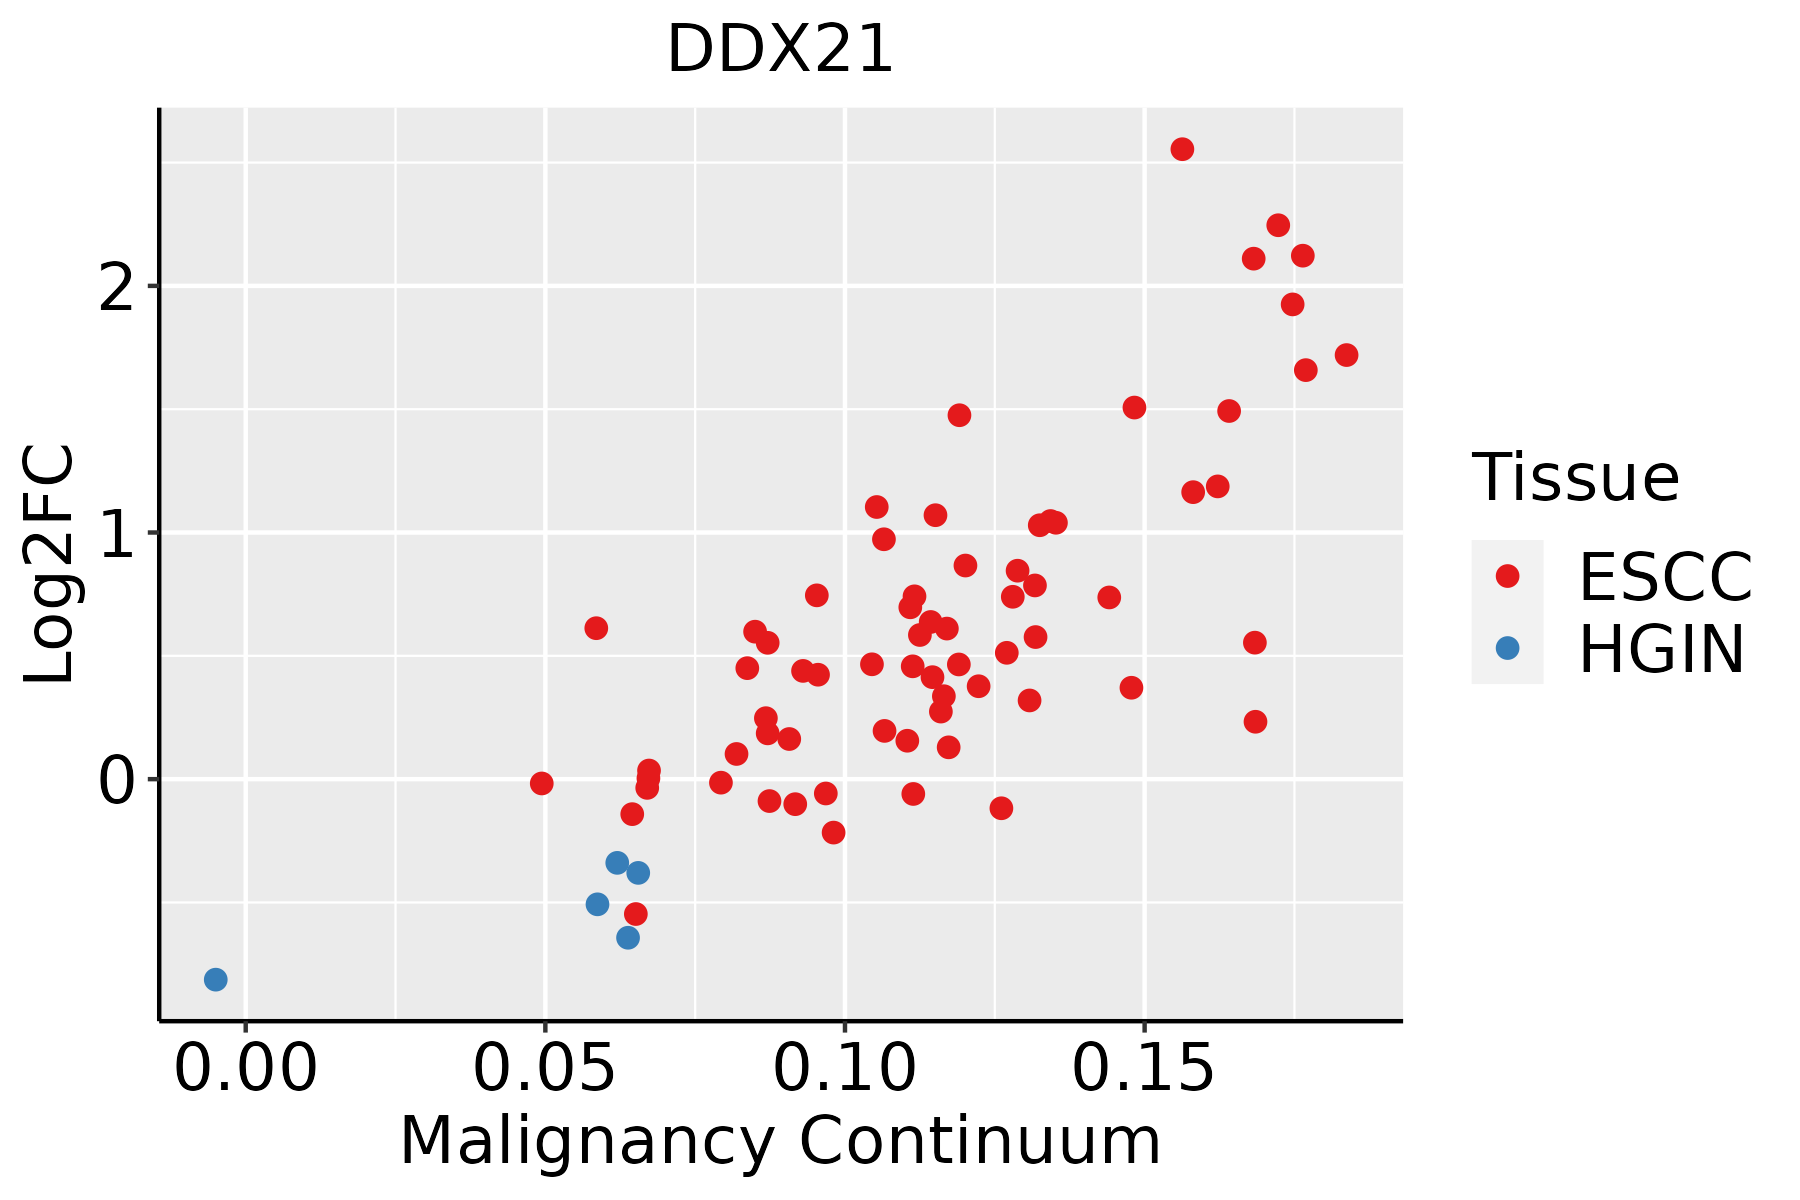
ESCC: Esophageal squamous cell carcinoma
HGIN: High-grade intraepithelial neoplasias
LGIN: Low-grade intraepithelial neoplasias
LiverThe image shows the transcriptomic changes along malignancy continuum.log2FC in expression of this searched gene in stem-like cells from each diseased tissue sample relative to stem-like cells in normal samples in each tissue plotted against the malignancy continuum. Samples are colored based on if they are from different disease stage.
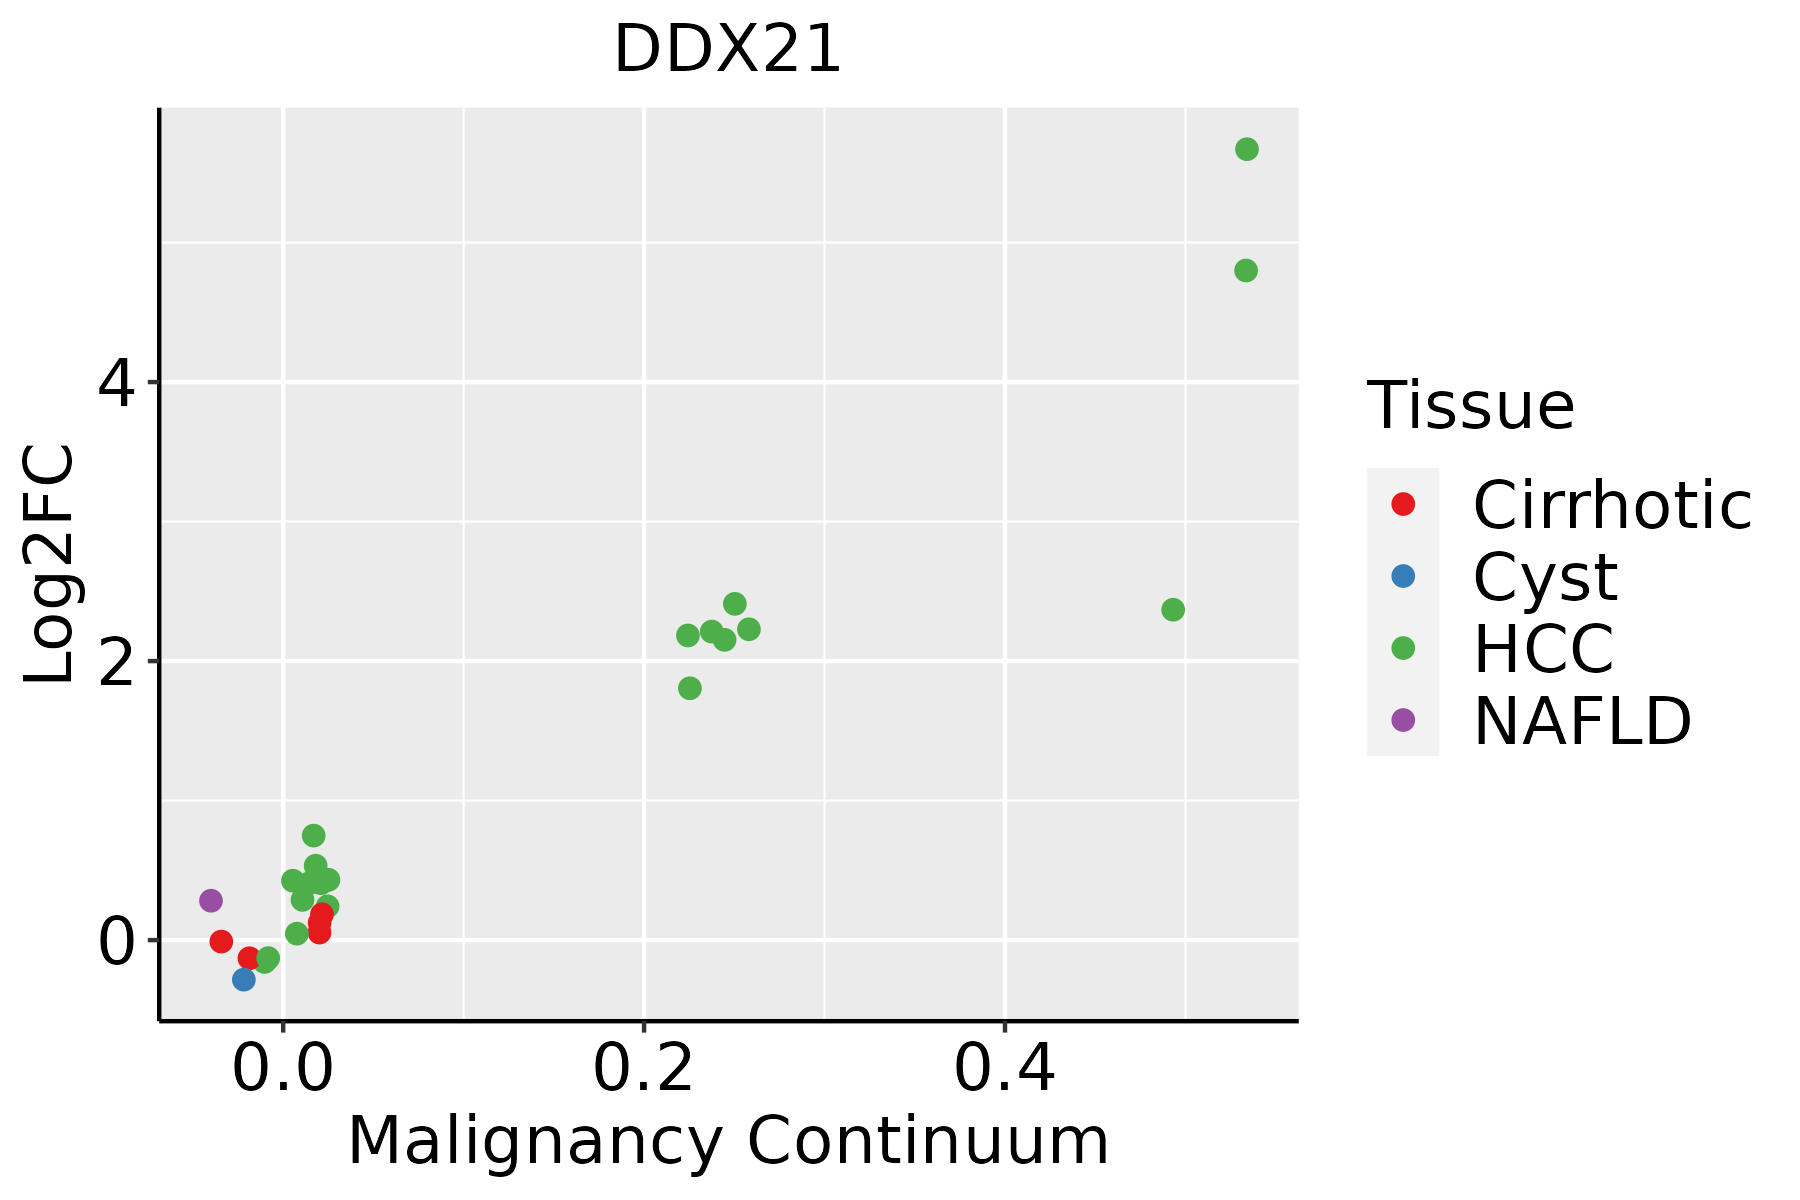
HCC: Hepatocellular carcinoma
NAFLD: Non-alcoholic fatty liver disease
Oral CavityThe image shows the transcriptomic changes along malignancy continuum.log2FC in expression of this searched gene in stem-like cells from each diseased tissue sample relative to stem-like cells in normal samples in each tissue plotted against the malignancy continuum. Samples are colored based on if they are from different disease stage.
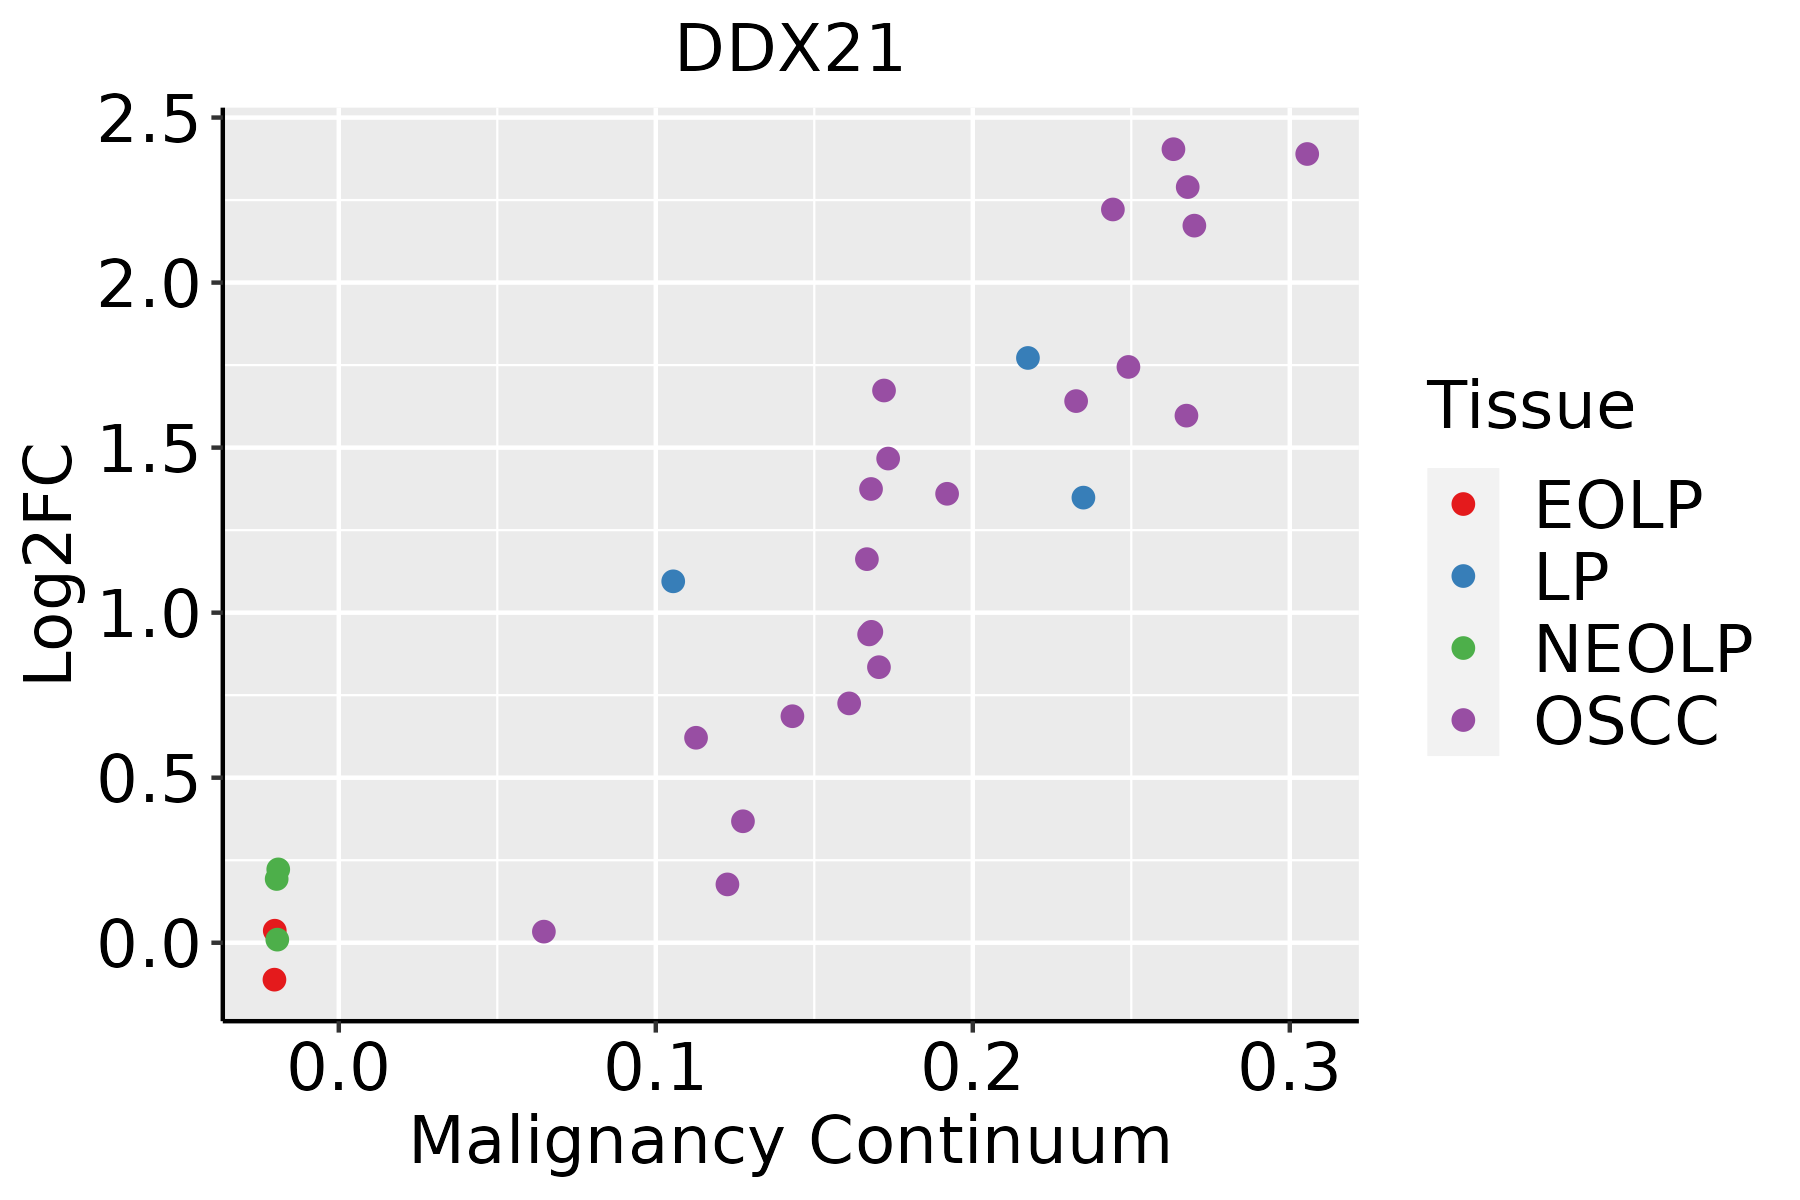
EOLP: Erosive Oral lichen planus
LP: leukoplakia
NEOLP: Non-erosive oral lichen planus
OSCC: Oral squamous cell carcinoma
ProstateThe image shows the transcriptomic changes along malignancy continuum.log2FC in expression of this searched gene in stem-like cells from each diseased tissue sample relative to stem-like cells in normal samples in each tissue plotted against the malignancy continuum. Samples are colored based on if they are from different disease stage.BPH: Benign Prostatic Hyperplasia
SkinThe image shows the transcriptomic changes along malignancy continuum.log2FC in expression of this searched gene in stem-like cells from each diseased tissue sample relative to stem-like cells in normal samples in each tissue plotted against the malignancy continuum. Samples are colored based on if they are from different disease stage.AK: Actinic keratosis
cSCC: Cutaneous squamous cell carcinoma
SCCIS:squamous cell carcinoma in situ
ThyroidThe image shows the transcriptomic changes along malignancy continuum.log2FC in expression of this searched gene in stem-like cells from each diseased tissue sample relative to stem-like cells in normal samples in each tissue plotted against the malignancy continuum. Samples are colored based on if they are from different disease stage.
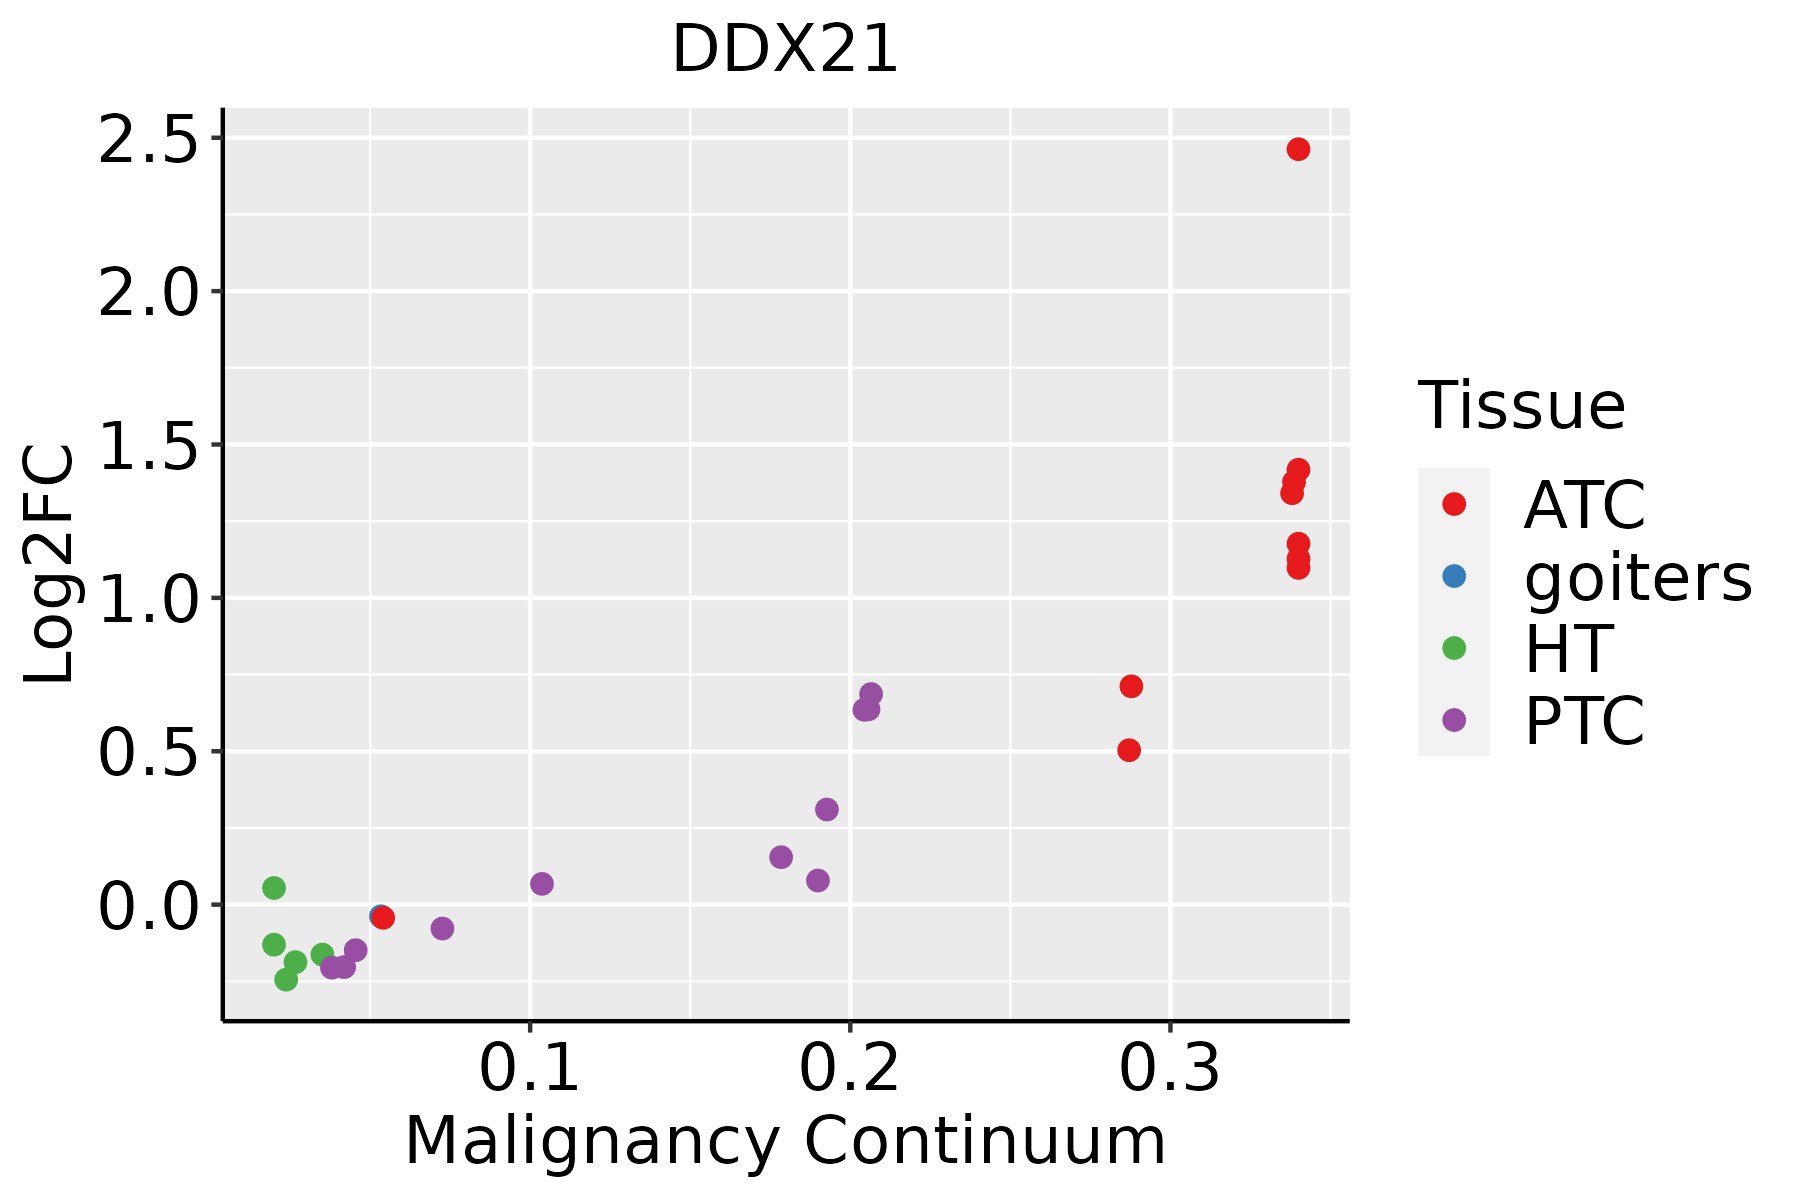
ATC: Anaplastic thyroid cancer
HT: Hashimoto's thyroiditis
PTC: Papillary thyroid cancer
∗log2FC in expression of this searched gene in stem-like cells from each diseased tissue sample relative to stem-like cells in normal samples in each tissue plotted against the malignancy continuum. Samples are colored based on if they are from different disease stage.

Top

Malignant transformation related pathway analysis

check buttonFind out the enriched GO biological processes and KEGG pathways involved in transition from healthy to precancer to cancer
check button Figure of enriched GO biological processes.
TissueDisease StageEnriched GO biological Processes
ColorectumADGO analysis - Figure of enriched GO biological processes: Top 15 enriched GO BP terms are showed in the bar plot of each disease state in each tissue. Each row represents a significant GO biological process which is colored according to the -log10(p.adjust).
ColorectumSERGO analysis - Figure of enriched GO biological processes: Top 15 enriched GO BP terms are showed in the bar plot of each disease state in each tissue. Each row represents a significant GO biological process which is colored according to the -log10(p.adjust).
ColorectumMSSGO analysis - Figure of enriched GO biological processes: Top 15 enriched GO BP terms are showed in the bar plot of each disease state in each tissue. Each row represents a significant GO biological process which is colored according to the -log10(p.adjust).
ColorectumMSI-HGO analysis - Figure of enriched GO biological processes: Top 15 enriched GO BP terms are showed in the bar plot of each disease state in each tissue. Each row represents a significant GO biological process which is colored according to the -log10(p.adjust).
ColorectumFAPGO analysis - Figure of enriched GO biological processes: Top 15 enriched GO BP terms are showed in the bar plot of each disease state in each tissue. Each row represents a significant GO biological process which is colored according to the -log10(p.adjust).
∗Top 15 enriched GO BP terms are showed in the bar plot of each disease state in each tissue. Each row represents a significant GO biological process which is colored according to the -log10(p.adjust).
Page: 1 2 3 4 5 6 7 8 9 

check button Enriched GO biological processes.
GO IDTissueDisease StageDescriptionGene RatioBg Ratiopvaluep.adjustCount
GO:000164914EndometriumEECosteoblast differentiation53/2168229/187235.32e-072.02e-0553
GO:000150313EndometriumEECossification79/2168408/187232.72e-067.67e-0579
GO:004312216EndometriumEECregulation of I-kappaB kinase/NF-kappaB signaling53/2168249/187237.59e-061.73e-0453
GO:004312314EndometriumEECpositive regulation of I-kappaB kinase/NF-kappaB signaling42/2168186/187231.47e-052.87e-0442
GO:000724915EndometriumEECI-kappaB kinase/NF-kappaB signaling57/2168281/187231.60e-053.12e-0457
GO:000636416EndometriumEECrRNA processing48/2168225/187231.88e-053.50e-0448
GO:001607216EndometriumEECrRNA metabolic process49/2168236/187233.27e-055.62e-0449
GO:000961513EndometriumEECresponse to virus66/2168367/187231.78e-042.20e-0366
GO:000181913EndometriumEECpositive regulation of cytokine production73/2168467/187234.64e-032.97e-0273
GO:003447012EndometriumEECncRNA processing63/2168395/187235.20e-033.26e-0263
GO:002261327EsophagusHGINribonucleoprotein complex biogenesis158/2587463/187232.61e-295.23e-26158
GO:004225426EsophagusHGINribosome biogenesis101/2587299/187238.74e-194.03e-16101
GO:001607219EsophagusHGINrRNA metabolic process72/2587236/187232.26e-112.56e-0972
GO:000636419EsophagusHGINrRNA processing69/2587225/187234.53e-115.04e-0969
GO:003447010EsophagusHGINncRNA processing97/2587395/187235.92e-093.90e-0797
GO:004312220EsophagusHGINregulation of I-kappaB kinase/NF-kappaB signaling63/2587249/187238.91e-073.61e-0563
GO:00346606EsophagusHGINncRNA metabolic process104/2587485/187232.26e-068.23e-05104
GO:000724918EsophagusHGINI-kappaB kinase/NF-kappaB signaling67/2587281/187233.84e-061.29e-0467
GO:004312317EsophagusHGINpositive regulation of I-kappaB kinase/NF-kappaB signaling49/2587186/187234.22e-061.40e-0449
GO:000164917EsophagusHGINosteoblast differentiation50/2587229/187235.88e-048.30e-0350
Page: 1 2 3 4 5 6 7 8 9 10 11 12 13 

check button Enriched KEGG pathways.
Pathway IDTissueDisease StageDescriptionGene RatioBg Ratiopvaluep.adjustqvalueCount
Page: 1 

Top

Cell-cell communication analysis

check buttonIdentification of potential cell-cell interactions between two cell types and their ligand-receptor pairs for different disease states
LigandReceptorLRpairPathwayTissueDisease Stage
Page: 1 

Top

Single-cell gene regulatory network inference analysis

check buttonFind out the significant the regulons (TFs) and the target genes of each regulon across cell types for different disease states
TFCell TypeTissueDisease StageTarget GeneRSSRegulon Activity
∗The dot plots of a searched regulon are shown for all cell subpopulations in each disease state of each tissue based on the regulon specific score inferred using pySCENIC and by calculating the average expression.
Page: 1 

Top

Somatic mutation of malignant transformation related genes

check buttonAnnotation of somatic variants for genes involved in malignant transformation
Hugo SymbolVariant ClassVariant ClassificationdbSNP RSHGVScHGVSpHGVSp ShortSWISSPROTBIOTYPESIFTPolyPhenTumor Sample BarcodeTissueHistologySexAgeStageTherapy TypesDrugsOutcome
DDX21SNVMissense_Mutationc.1756N>Ap.Val586Metp.V586MQ9NR30protein_codingdeleterious(0.01)possibly_damaging(0.646)TCGA-AO-A03P-01Breastbreast invasive carcinomaFemale<65I/IIHormone TherapyletrozolePD
DDX21SNVMissense_Mutationrs780033357c.2113N>Gp.Leu705Valp.L705VQ9NR30protein_codingdeleterious(0.04)probably_damaging(0.955)TCGA-BH-A0HO-01Breastbreast invasive carcinomaFemale<65I/IIChemotherapycyclophosphamideSD
DDX21SNVMissense_Mutationc.526N>Cp.Glu176Glnp.E176QQ9NR30protein_codingdeleterious(0.02)benign(0.005)TCGA-BH-A0HP-01Breastbreast invasive carcinomaFemale>=65III/IVChemotherapydoxorubicinSD
DDX21SNVMissense_Mutationrs868785299c.1784A>Gp.Lys595Argp.K595RQ9NR30protein_codingtolerated(0.73)benign(0.009)TCGA-BH-A201-01Breastbreast invasive carcinomaFemale<65I/IIUnknownUnknownSD
DDX21SNVMissense_Mutationrs766890848c.1873N>Ap.Asp625Asnp.D625NQ9NR30protein_codingdeleterious(0.02)possibly_damaging(0.484)TCGA-C8-A12K-01Breastbreast invasive carcinomaFemale>=65I/IIUnknownUnknownSD
DDX21SNVMissense_Mutationc.1161G>Cp.Lys387Asnp.K387NQ9NR30protein_codingdeleterious(0.04)benign(0.248)TCGA-D8-A1J9-01Breastbreast invasive carcinomaFemale<65I/IIUnknownUnknownSD
DDX21SNVMissense_Mutationnovelc.1209N>Cp.Lys403Asnp.K403NQ9NR30protein_codingtolerated(0.08)benign(0.003)TCGA-E2-A574-01Breastbreast invasive carcinomaFemale<65I/IIChemotherapyadriamycinSD
DDX21SNVMissense_Mutationc.692N>Ap.Arg231Glnp.R231QQ9NR30protein_codingdeleterious(0.01)possibly_damaging(0.826)TCGA-GM-A2DF-01Breastbreast invasive carcinomaFemale<65I/IIChemotherapytaxolCR
DDX21insertionFrame_Shift_Insnovelc.1897_1898insGp.Asn633ArgfsTer14p.N633Rfs*14Q9NR30protein_codingTCGA-A8-A0A4-01Breastbreast invasive carcinomaFemale>=65I/IIHormone TherapytamoxiphenCR
DDX21insertionFrame_Shift_Insnovelc.1898_1899insGACGGAGTTTCTTAAAATGATTGTGp.Asn633LysfsTer22p.N633Kfs*22Q9NR30protein_codingTCGA-A8-A0A4-01Breastbreast invasive carcinomaFemale>=65I/IIHormone TherapytamoxiphenCR
Page: 1 2 3 4 5 6 7 8 

Top

Related drugs of malignant transformation related genes

check buttonIdentification of chemicals and drugs interact with genes involved in malignant transfromation
(DGIdb 4.0)
Entrez IDSymbolCategoryInteraction TypesDrug Claim NameDrug NamePMIDs
Page: 1