
|
|||||
|
 | |
| |
| |
| |
| |
| |
|
Gene: CRP |
Gene summary for CRP |
| Gene information | Species | Human | Gene symbol | CRP | Gene ID | 1401 |
| Gene name | C-reactive protein | |
| Gene Alias | PTX1 | |
| Cytomap | 1q23.2 | |
| Gene Type | protein-coding | GO ID | GO:0001816 | UniProtAcc | P02741 |
Top |
Malignant transformation analysis |
| Identification of the aberrant gene expression in precancerous and cancerous lesions by comparing the gene expression of stem-like cells in diseased tissues with normal stem cells |
| Entrez ID | Symbol | Replicates | Species | Organ | Tissue | Adj P-value | Log2FC | Malignancy |
| 1401 | CRP | HCC1_Meng | Human | Liver | HCC | 4.34e-10 | -5.06e-01 | 0.0246 |
| 1401 | CRP | HCC2_Meng | Human | Liver | HCC | 5.98e-08 | -5.55e-01 | 0.0107 |
| 1401 | CRP | cirrhotic1 | Human | Liver | Cirrhotic | 4.17e-07 | -4.50e-01 | 0.0202 |
| 1401 | CRP | cirrhotic2 | Human | Liver | Cirrhotic | 9.65e-07 | -4.29e-01 | 0.0201 |
| 1401 | CRP | cirrhotic3 | Human | Liver | Cirrhotic | 2.46e-06 | -5.45e-01 | 0.0215 |
| 1401 | CRP | HCC5 | Human | Liver | HCC | 2.70e-05 | -5.95e-01 | 0.4932 |
| 1401 | CRP | Pt13.a | Human | Liver | HCC | 3.20e-03 | -2.57e-01 | 0.021 |
| 1401 | CRP | Pt13.b | Human | Liver | HCC | 3.32e-03 | -2.23e-01 | 0.0251 |
| 1401 | CRP | Pt14.d | Human | Liver | HCC | 3.24e-09 | -5.43e-01 | 0.0143 |
| 1401 | CRP | S014 | Human | Liver | HCC | 2.89e-08 | -5.95e-01 | 0.2254 |
| 1401 | CRP | S015 | Human | Liver | HCC | 2.38e-05 | -5.95e-01 | 0.2375 |
| 1401 | CRP | S016 | Human | Liver | HCC | 9.53e-11 | -5.95e-01 | 0.2243 |
| 1401 | CRP | S027 | Human | Liver | HCC | 9.83e-19 | 4.34e+00 | 0.2446 |
| 1401 | CRP | S028 | Human | Liver | HCC | 4.55e-05 | 2.01e+00 | 0.2503 |
| 1401 | CRP | S029 | Human | Liver | HCC | 5.51e-18 | 3.68e+00 | 0.2581 |
| Page: 1 |
| Tissue | Expression Dynamics | Abbreviation |
| Liver | 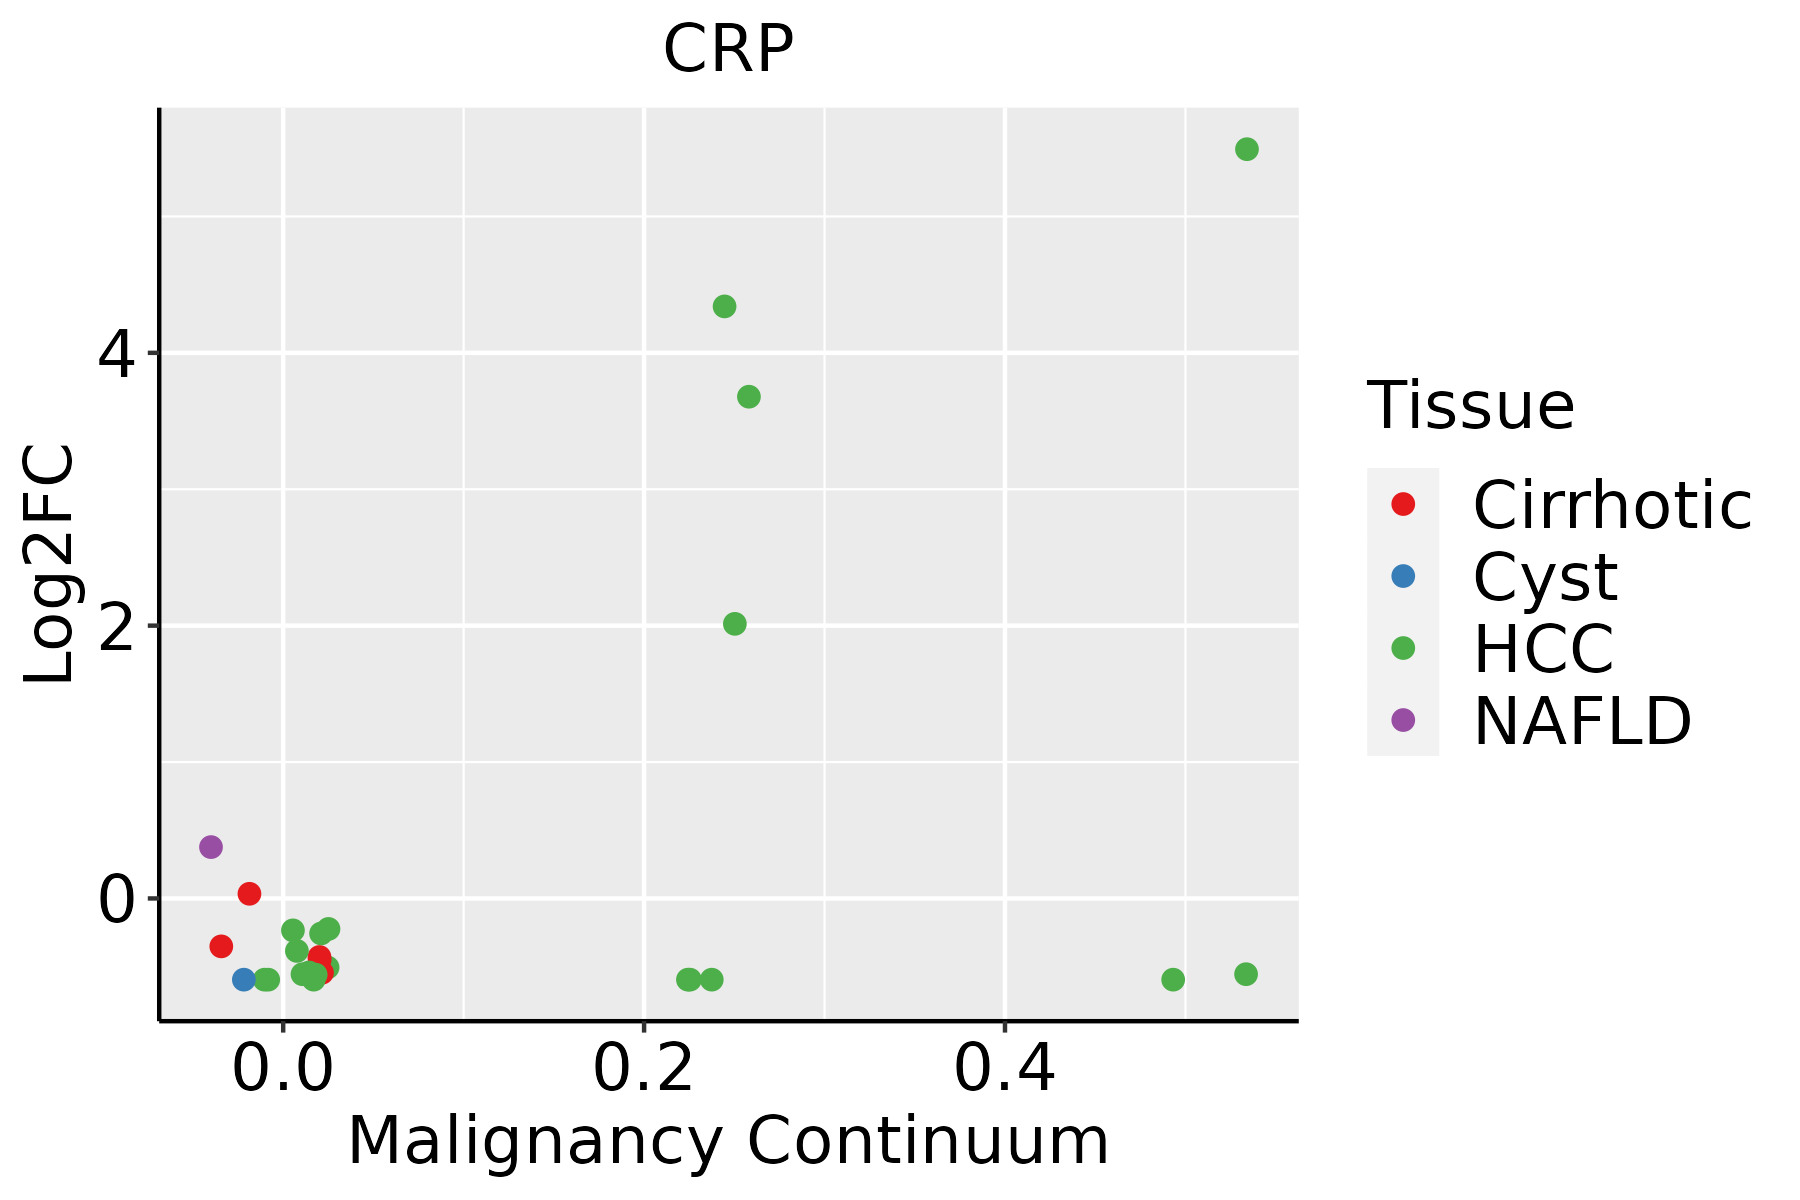 | HCC: Hepatocellular carcinoma |
| NAFLD: Non-alcoholic fatty liver disease |
| ∗log2FC in expression of this searched gene in stem-like cells from each diseased tissue sample relative to stem-like cells in normal samples in each tissue plotted against the malignancy continuum. Samples are colored based on if they are from different disease stage. |
Top |
Malignant transformation related pathway analysis |
| Find out the enriched GO biological processes and KEGG pathways involved in transition from healthy to precancer to cancer |
| Tissue | Disease Stage | Enriched GO biological Processes |
| Colorectum | AD |  |
| Colorectum | SER |  |
| Colorectum | MSS |  |
| Colorectum | MSI-H |  |
| Colorectum | FAP |  |
| ∗Top 15 enriched GO BP terms are showed in the bar plot of each disease state in each tissue. Each row represents a significant GO biological process which is colored according to the -log10(p.adjust). |
| Page: 1 2 3 4 5 6 7 8 9 |
| GO ID | Tissue | Disease Stage | Description | Gene Ratio | Bg Ratio | pvalue | p.adjust | Count |
| GO:00518172 | Liver | HCC | modulation of process of other organism involved in symbiotic interaction | 56/7958 | 81/18723 | 1.11e-06 | 1.65e-05 | 56 |
| GO:00518512 | Liver | HCC | modulation by host of symbiont process | 43/7958 | 60/18723 | 4.48e-06 | 5.66e-05 | 43 |
| GO:003582111 | Liver | HCC | modulation of process of other organism | 67/7958 | 106/18723 | 1.34e-05 | 1.48e-04 | 67 |
| GO:00517022 | Liver | HCC | biological process involved in interaction with symbiont | 60/7958 | 94/18723 | 2.41e-05 | 2.54e-04 | 60 |
| GO:200037722 | Liver | HCC | regulation of reactive oxygen species metabolic process | 92/7958 | 157/18723 | 3.34e-05 | 3.35e-04 | 92 |
| GO:001087621 | Liver | HCC | lipid localization | 228/7958 | 448/18723 | 1.80e-04 | 1.41e-03 | 228 |
| GO:00199152 | Liver | HCC | lipid storage | 53/7958 | 87/18723 | 4.01e-04 | 2.71e-03 | 53 |
| GO:200037912 | Liver | HCC | positive regulation of reactive oxygen species metabolic process | 47/7958 | 76/18723 | 5.19e-04 | 3.38e-03 | 47 |
| GO:00447881 | Liver | HCC | modulation by host of viral process | 22/7958 | 30/18723 | 6.14e-04 | 3.82e-03 | 22 |
| GO:007259312 | Liver | HCC | reactive oxygen species metabolic process | 124/7958 | 239/18723 | 2.05e-03 | 1.04e-02 | 124 |
| GO:00108832 | Liver | HCC | regulation of lipid storage | 35/7958 | 57/18723 | 3.08e-03 | 1.43e-02 | 35 |
| GO:00025262 | Liver | HCC | acute inflammatory response | 62/7958 | 112/18723 | 4.06e-03 | 1.77e-02 | 62 |
| GO:00329281 | Liver | HCC | regulation of superoxide anion generation | 17/7958 | 24/18723 | 4.72e-03 | 2.02e-02 | 17 |
| GO:00069532 | Liver | HCC | acute-phase response | 30/7958 | 49/18723 | 6.31e-03 | 2.57e-02 | 30 |
| GO:00107422 | Liver | HCC | macrophage derived foam cell differentiation | 24/7958 | 38/18723 | 8.20e-03 | 3.22e-02 | 24 |
| GO:00900772 | Liver | HCC | foam cell differentiation | 24/7958 | 38/18723 | 8.20e-03 | 3.22e-02 | 24 |
| GO:000740911 | Lung | AIS | axonogenesis | 64/1849 | 418/18723 | 2.62e-04 | 5.04e-03 | 64 |
| GO:006156411 | Lung | AIS | axon development | 69/1849 | 467/18723 | 4.37e-04 | 7.41e-03 | 69 |
| GO:0006493 | Lung | AIS | protein O-linked glycosylation | 17/1849 | 86/18723 | 4.04e-03 | 3.65e-02 | 17 |
| GO:00064863 | Lung | AIS | protein glycosylation | 35/1849 | 226/18723 | 4.93e-03 | 4.27e-02 | 35 |
| Page: 1 2 3 4 |
| Pathway ID | Tissue | Disease Stage | Description | Gene Ratio | Bg Ratio | pvalue | p.adjust | qvalue | Count |
| Page: 1 |
Top |
Cell-cell communication analysis |
| Identification of potential cell-cell interactions between two cell types and their ligand-receptor pairs for different disease states |
| Ligand | Receptor | LRpair | Pathway | Tissue | Disease Stage |
| Page: 1 |
Top |
Single-cell gene regulatory network inference analysis |
| Find out the significant the regulons (TFs) and the target genes of each regulon across cell types for different disease states |
| TF | Cell Type | Tissue | Disease Stage | Target Gene | RSS | Regulon Activity |
| ∗The dot plots of a searched regulon are shown for all cell subpopulations in each disease state of each tissue based on the regulon specific score inferred using pySCENIC and by calculating the average expression. |
| Page: 1 |
Top |
Somatic mutation of malignant transformation related genes |
| Annotation of somatic variants for genes involved in malignant transformation |
| Hugo Symbol | Variant Class | Variant Classification | dbSNP RS | HGVSc | HGVSp | HGVSp Short | SWISSPROT | BIOTYPE | SIFT | PolyPhen | Tumor Sample Barcode | Tissue | Histology | Sex | Age | Stage | Therapy Types | Drugs | Outcome |
| CRP | SNV | Missense_Mutation | c.185C>G | p.Ser62Cys | p.S62C | P02741 | protein_coding | deleterious(0.01) | possibly_damaging(0.662) | TCGA-AC-A23H-01 | Breast | breast invasive carcinoma | Female | >=65 | I/II | Unknown | Unknown | PD | |
| CRP | SNV | Missense_Mutation | c.148N>T | p.Ala50Ser | p.A50S | P02741 | protein_coding | tolerated(0.35) | benign(0.079) | TCGA-C8-A1HJ-01 | Breast | breast invasive carcinoma | Female | <65 | I/II | Unknown | Unknown | SD | |
| CRP | SNV | Missense_Mutation | c.263N>G | p.Asp88Gly | p.D88G | P02741 | protein_coding | tolerated(0.42) | benign(0.003) | TCGA-D8-A1Y1-01 | Breast | breast invasive carcinoma | Female | >=65 | III/IV | Hormone Therapy | tamoxiphen | PD | |
| CRP | insertion | Frame_Shift_Ins | novel | c.448_449insCT | p.Ser150ThrfsTer29 | p.S150Tfs*29 | P02741 | protein_coding | TCGA-AO-A0JB-01 | Breast | breast invasive carcinoma | Female | <65 | III/IV | Chemotherapy | cyclophosphamide | SD | ||
| CRP | insertion | In_Frame_Ins | novel | c.447_448insTGGGCCCCACGTCTCTGTCTCTGGTACCTCCCGCTTTTTTAC | p.Ala149_Ser150insTrpAlaProArgLeuCysLeuTrpTyrLeuProLeuPheTyr | p.A149_S150insWAPRLCLWYLPLFY | P02741 | protein_coding | TCGA-AO-A0JB-01 | Breast | breast invasive carcinoma | Female | <65 | III/IV | Chemotherapy | cyclophosphamide | SD | ||
| CRP | SNV | Missense_Mutation | rs200949626 | c.643N>A | p.Glu215Lys | p.E215K | P02741 | protein_coding | tolerated(0.18) | possibly_damaging(0.68) | TCGA-AA-3950-01 | Colorectum | colon adenocarcinoma | Female | >=65 | I/II | Unknown | Unknown | SD |
| CRP | SNV | Missense_Mutation | c.314N>A | p.Pro105His | p.P105H | P02741 | protein_coding | tolerated(0.07) | possibly_damaging(0.797) | TCGA-EI-6882-01 | Colorectum | rectum adenocarcinoma | Male | <65 | I/II | Unknown | Unknown | SD | |
| CRP | SNV | Missense_Mutation | c.283N>A | p.Val95Met | p.V95M | P02741 | protein_coding | deleterious(0) | probably_damaging(0.995) | TCGA-A5-A0VP-01 | Endometrium | uterine corpus endometrioid carcinoma | Female | >=65 | I/II | Unknown | Unknown | SD | |
| CRP | SNV | Missense_Mutation | novel | c.350N>A | p.Ser117Asn | p.S117N | P02741 | protein_coding | deleterious(0.05) | benign(0.138) | TCGA-A5-A2K5-01 | Endometrium | uterine corpus endometrioid carcinoma | Female | >=65 | I/II | Unknown | Unknown | SD |
| CRP | SNV | Missense_Mutation | c.334G>A | p.Val112Ile | p.V112I | P02741 | protein_coding | tolerated(0.27) | benign(0.033) | TCGA-AP-A051-01 | Endometrium | uterine corpus endometrioid carcinoma | Female | >=65 | I/II | Unknown | Unknown | SD |
| Page: 1 2 3 4 |
Top |
Related drugs of malignant transformation related genes |
| Identification of chemicals and drugs interact with genes involved in malignant transfromation |
| (DGIdb 4.0) |
| Entrez ID | Symbol | Category | Interaction Types | Drug Claim Name | Drug Name | PMIDs |
| 1401 | CRP | DRUGGABLE GENOME | rosuvastatin | ROSUVASTATIN | 21094359 | |
| 1401 | CRP | DRUGGABLE GENOME | fenofibrate | FENOFIBRATE | ||
| 1401 | CRP | DRUGGABLE GENOME | adalimumab | ADALIMUMAB | 27096233 | |
| 1401 | CRP | DRUGGABLE GENOME | ISIS-CRPRX | |||
| 1401 | CRP | DRUGGABLE GENOME | ISIS 353512 |
| Page: 1 |

Copyright 2023-Present -The University of Texas Health Science Center at Houston |