Schematic overview of the cellular and molecular mechanisms involved in the cancer progression, including the proposed cellular and molecular mechanisms in cancer cells trajectory. AT1: alveolar type 1 cells; AT2: alveolar type 2 cells; AAH: atypical adenomatous hyperplasia; AIS: adenocarcinoma in situ; MIA: minimally invasive adenocarcinoma; IA: invasive adenocarcinoma; EMT: epithelial-mesenchymal transition

Home

Download

Statistics

Help

Contact

Center for Computational Systems Medicine
leaf

Gene summary

leaf

Malignant transformation analysis

leaf

Malignant transformation related pathway analysis

leaf

Cell-cell communication analysis

leaf

Single-cell gene regulatory network inference analysis

leaf

Somatic mutation of malignant transformation related genes

leaf

Related drugs of malignant transformation related genes

Gene: CPNE1

Gene summary for CPNE1

check button Gene summary.

Gene informationSpeciesHuman
Gene symbol

CPNE1

Gene ID

8904

Gene namecopine 1
Gene AliasCOPN1
Cytomap20q11.22
Gene Typeprotein-coding
GO ID

GO:0000902

UniProtAcc

B0QZ18


Top

Malignant transformation analysis

check button Identification of the aberrant gene expression in precancerous and cancerous lesions by comparing the gene expression of stem-like cells in diseased tissues with normal stem cells
check button Malignant transformation involving gene list.
Entrez IDSymbolReplicatesSpeciesOrganTissueAdj P-valueLog2FCMalignancy
8904CPNE1HTA11_3410_2000001011HumanColorectumAD1.85e-032.36e-010.0155
8904CPNE1HTA11_347_2000001011HumanColorectumAD4.32e-052.96e-01-0.1954
8904CPNE1HTA11_1391_2000001011HumanColorectumAD1.81e-105.20e-01-0.059
8904CPNE1HTA11_866_3004761011HumanColorectumAD3.05e-206.97e-010.096
8904CPNE1HTA11_7696_3000711011HumanColorectumAD3.97e-043.13e-010.0674
8904CPNE1HTA11_6818_2000001021HumanColorectumAD4.84e-053.90e-010.0588
8904CPNE1HTA11_99999970781_79442HumanColorectumMSS2.76e-063.60e-010.294
8904CPNE1HTA11_99999971662_82457HumanColorectumMSS1.71e-341.07e+000.3859
8904CPNE1HTA11_99999973899_84307HumanColorectumMSS4.12e-181.06e+000.2585
8904CPNE1HTA11_99999974143_84620HumanColorectumMSS1.63e-411.10e+000.3005
8904CPNE1CRC-3-11773HumanColorectumCRC3.65e-085.63e-010.2564
8904CPNE1LZE4THumanEsophagusESCC3.18e-167.18e-010.0811
8904CPNE1LZE7THumanEsophagusESCC7.66e-056.22e-010.0667
8904CPNE1LZE8THumanEsophagusESCC2.12e-145.68e-010.067
8904CPNE1LZE20THumanEsophagusESCC6.47e-054.30e-010.0662
8904CPNE1LZE24THumanEsophagusESCC1.52e-441.89e+000.0596
8904CPNE1LZE21THumanEsophagusESCC2.60e-034.14e-020.0655
8904CPNE1LZE6THumanEsophagusESCC4.46e-109.36e-010.0845
8904CPNE1P1T-EHumanEsophagusESCC4.00e-086.63e-010.0875
8904CPNE1P2T-EHumanEsophagusESCC8.23e-601.13e+000.1177
Page: 1 2 3 4 5 6 7 

check button Transcriptomic changes along malignancy continuum.
TissueExpression DynamicsAbbreviation
Colorectum (GSE201348)The image shows the transcriptomic changes along malignancy continuum.log2FC in expression of this searched gene in stem-like cells from each diseased tissue sample relative to stem-like cells in normal samples in each tissue plotted against the malignancy continuum. Samples are colored based on if they are from different disease stage.FAP: Familial adenomatous polyposis
CRC: Colorectal cancer
Colorectum (HTA11)The image shows the transcriptomic changes along malignancy continuum.log2FC in expression of this searched gene in stem-like cells from each diseased tissue sample relative to stem-like cells in normal samples in each tissue plotted against the malignancy continuum. Samples are colored based on if they are from different disease stage.AD: Adenomas
SER: Sessile serrated lesions
MSI-H: Microsatellite-high colorectal cancer
MSS: Microsatellite stable colorectal cancer
EsophagusThe image shows the transcriptomic changes along malignancy continuum.log2FC in expression of this searched gene in stem-like cells from each diseased tissue sample relative to stem-like cells in normal samples in each tissue plotted against the malignancy continuum. Samples are colored based on if they are from different disease stage.
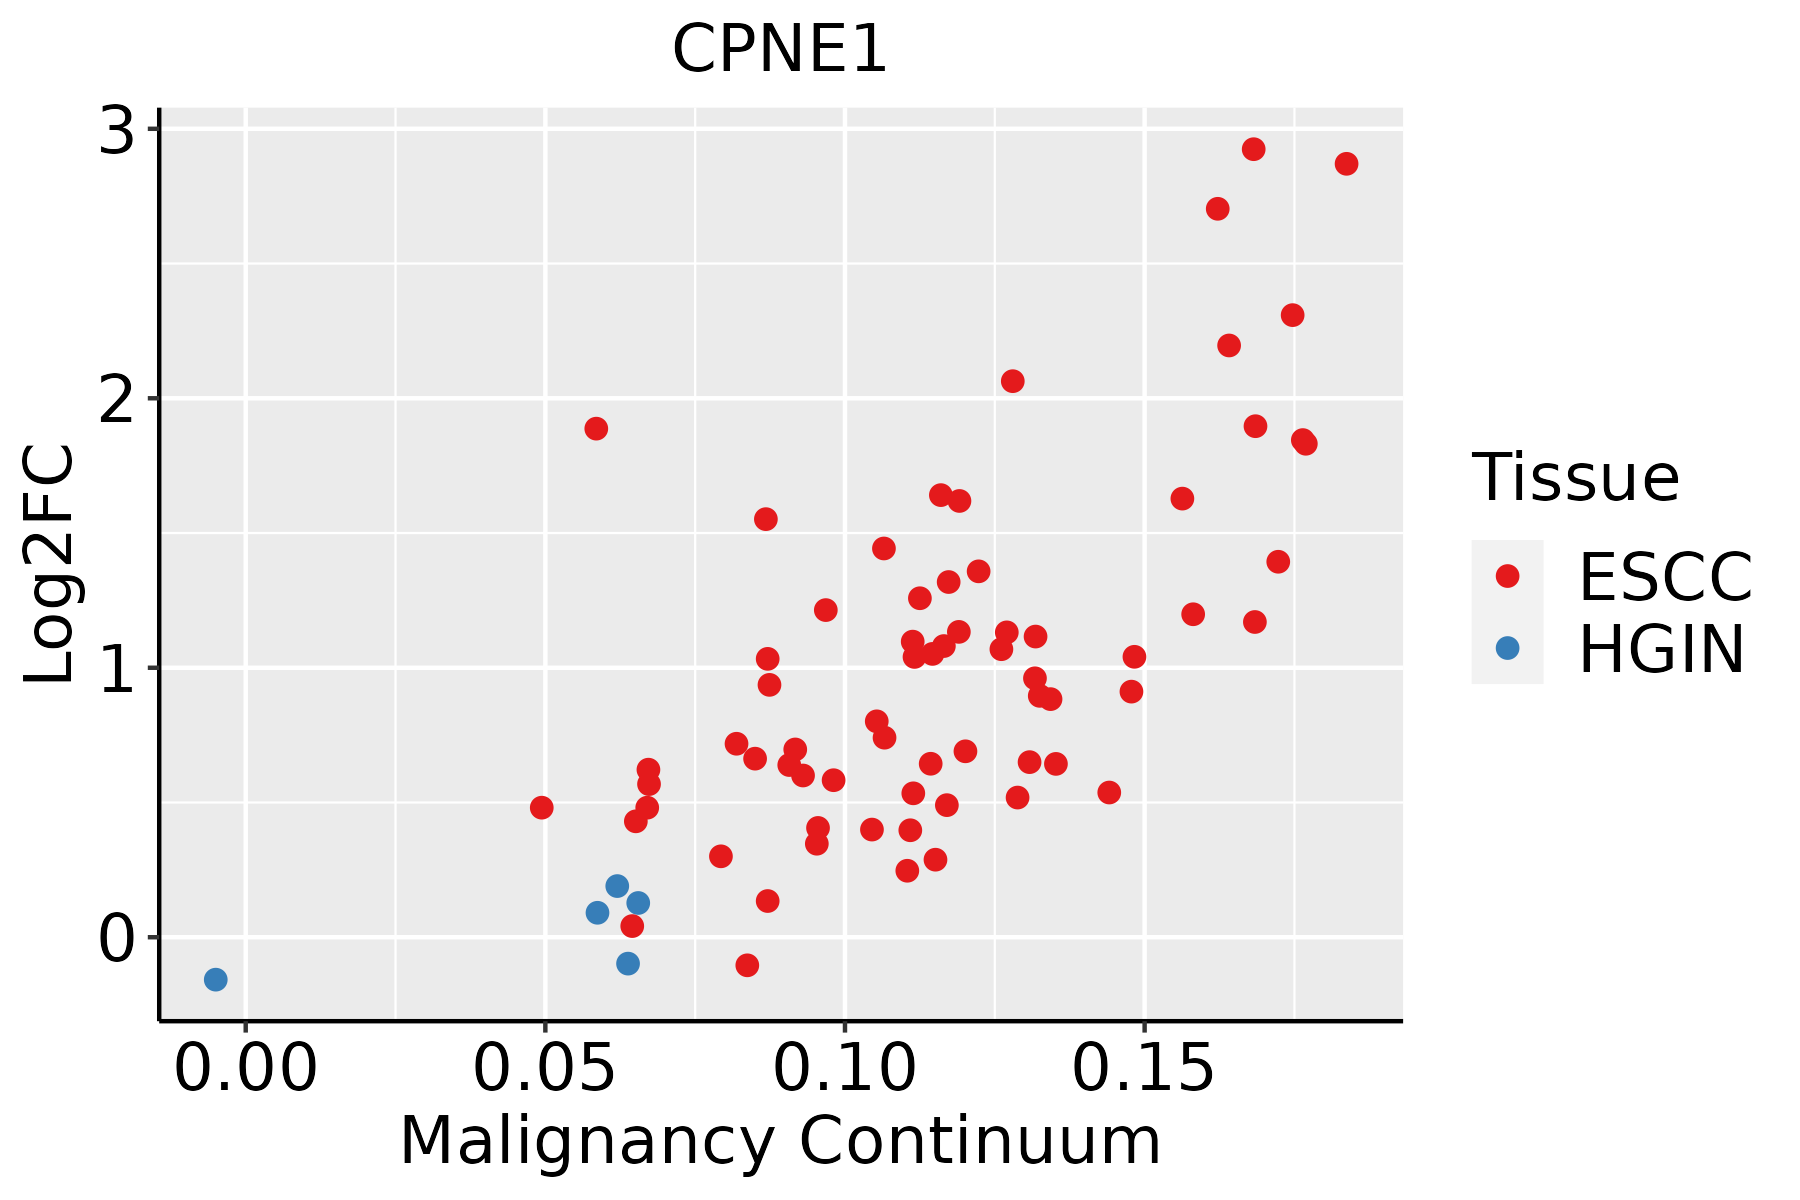
ESCC: Esophageal squamous cell carcinoma
HGIN: High-grade intraepithelial neoplasias
LGIN: Low-grade intraepithelial neoplasias
LiverThe image shows the transcriptomic changes along malignancy continuum.log2FC in expression of this searched gene in stem-like cells from each diseased tissue sample relative to stem-like cells in normal samples in each tissue plotted against the malignancy continuum. Samples are colored based on if they are from different disease stage.HCC: Hepatocellular carcinoma
NAFLD: Non-alcoholic fatty liver disease
Oral CavityThe image shows the transcriptomic changes along malignancy continuum.log2FC in expression of this searched gene in stem-like cells from each diseased tissue sample relative to stem-like cells in normal samples in each tissue plotted against the malignancy continuum. Samples are colored based on if they are from different disease stage.
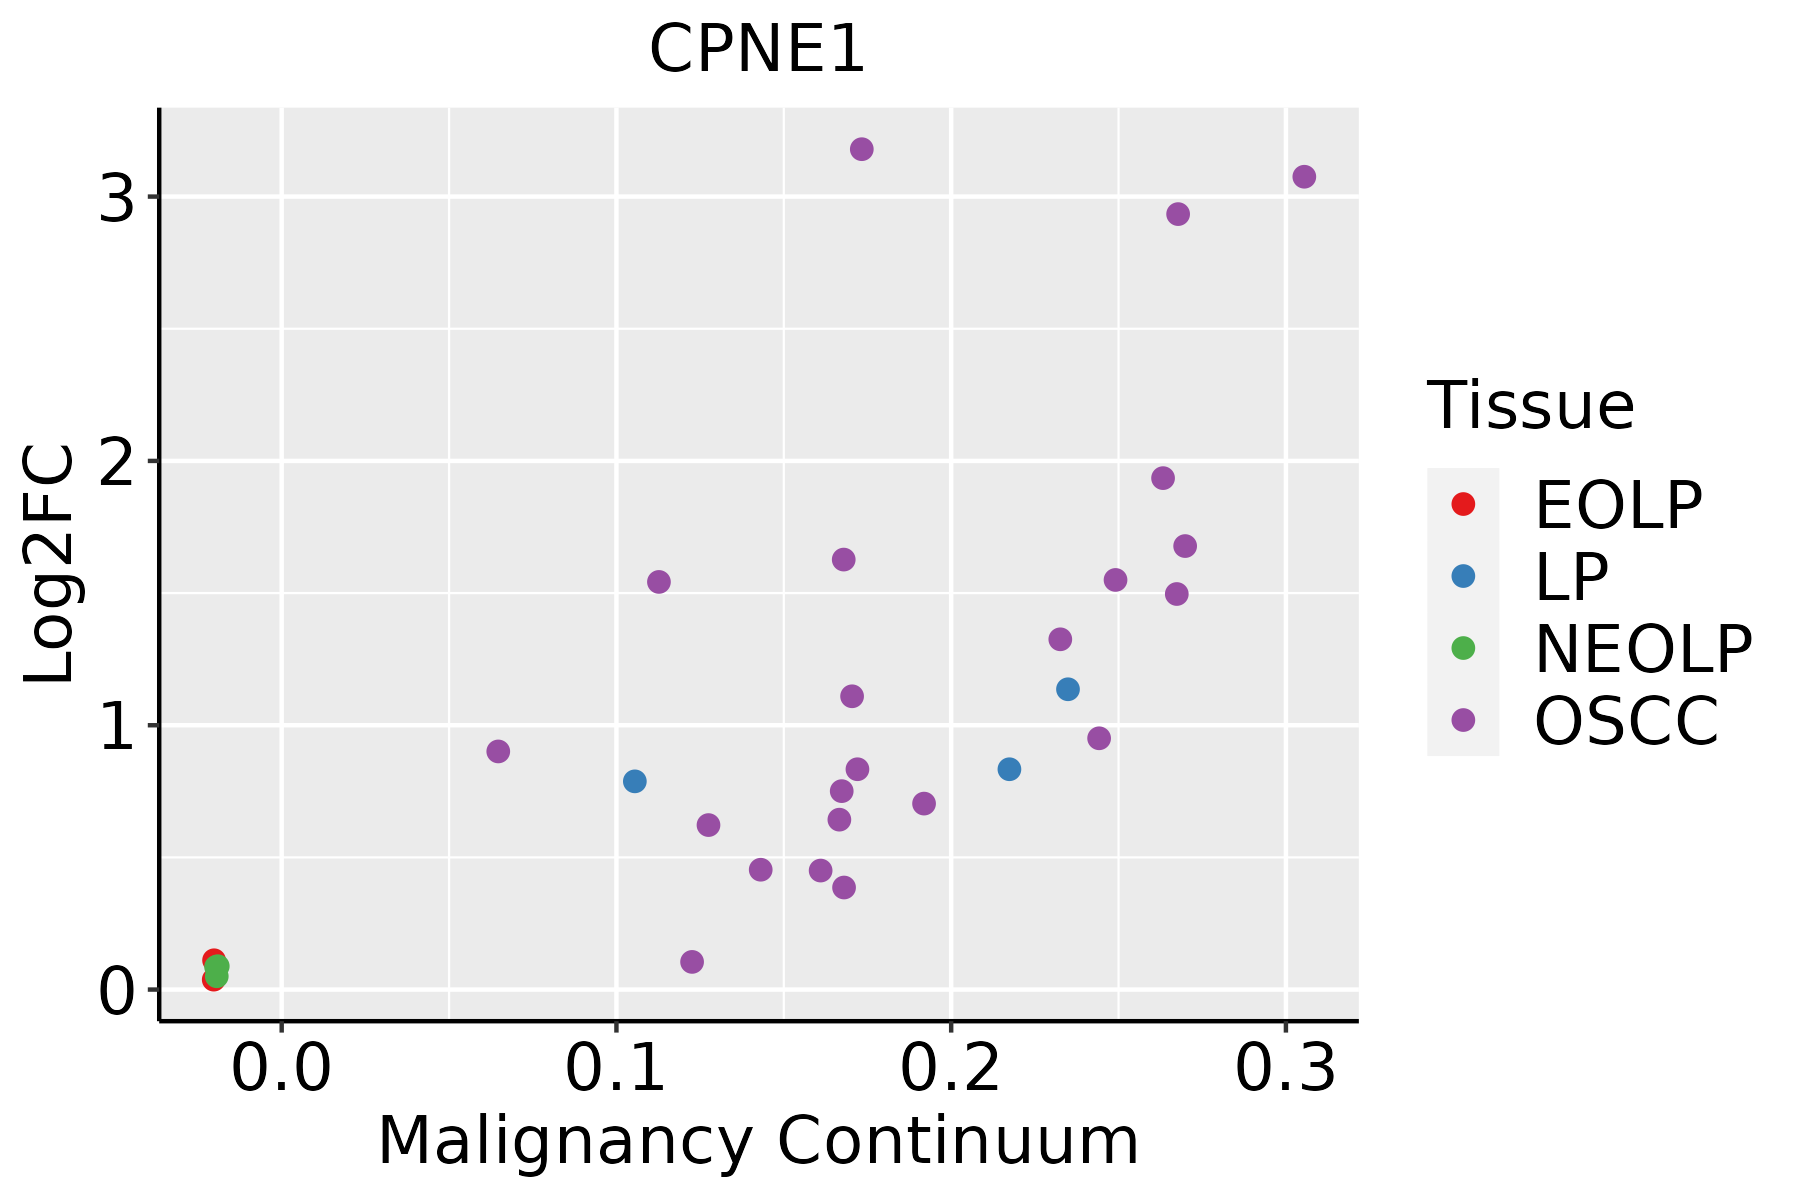
EOLP: Erosive Oral lichen planus
LP: leukoplakia
NEOLP: Non-erosive oral lichen planus
OSCC: Oral squamous cell carcinoma
SkinThe image shows the transcriptomic changes along malignancy continuum.log2FC in expression of this searched gene in stem-like cells from each diseased tissue sample relative to stem-like cells in normal samples in each tissue plotted against the malignancy continuum. Samples are colored based on if they are from different disease stage.
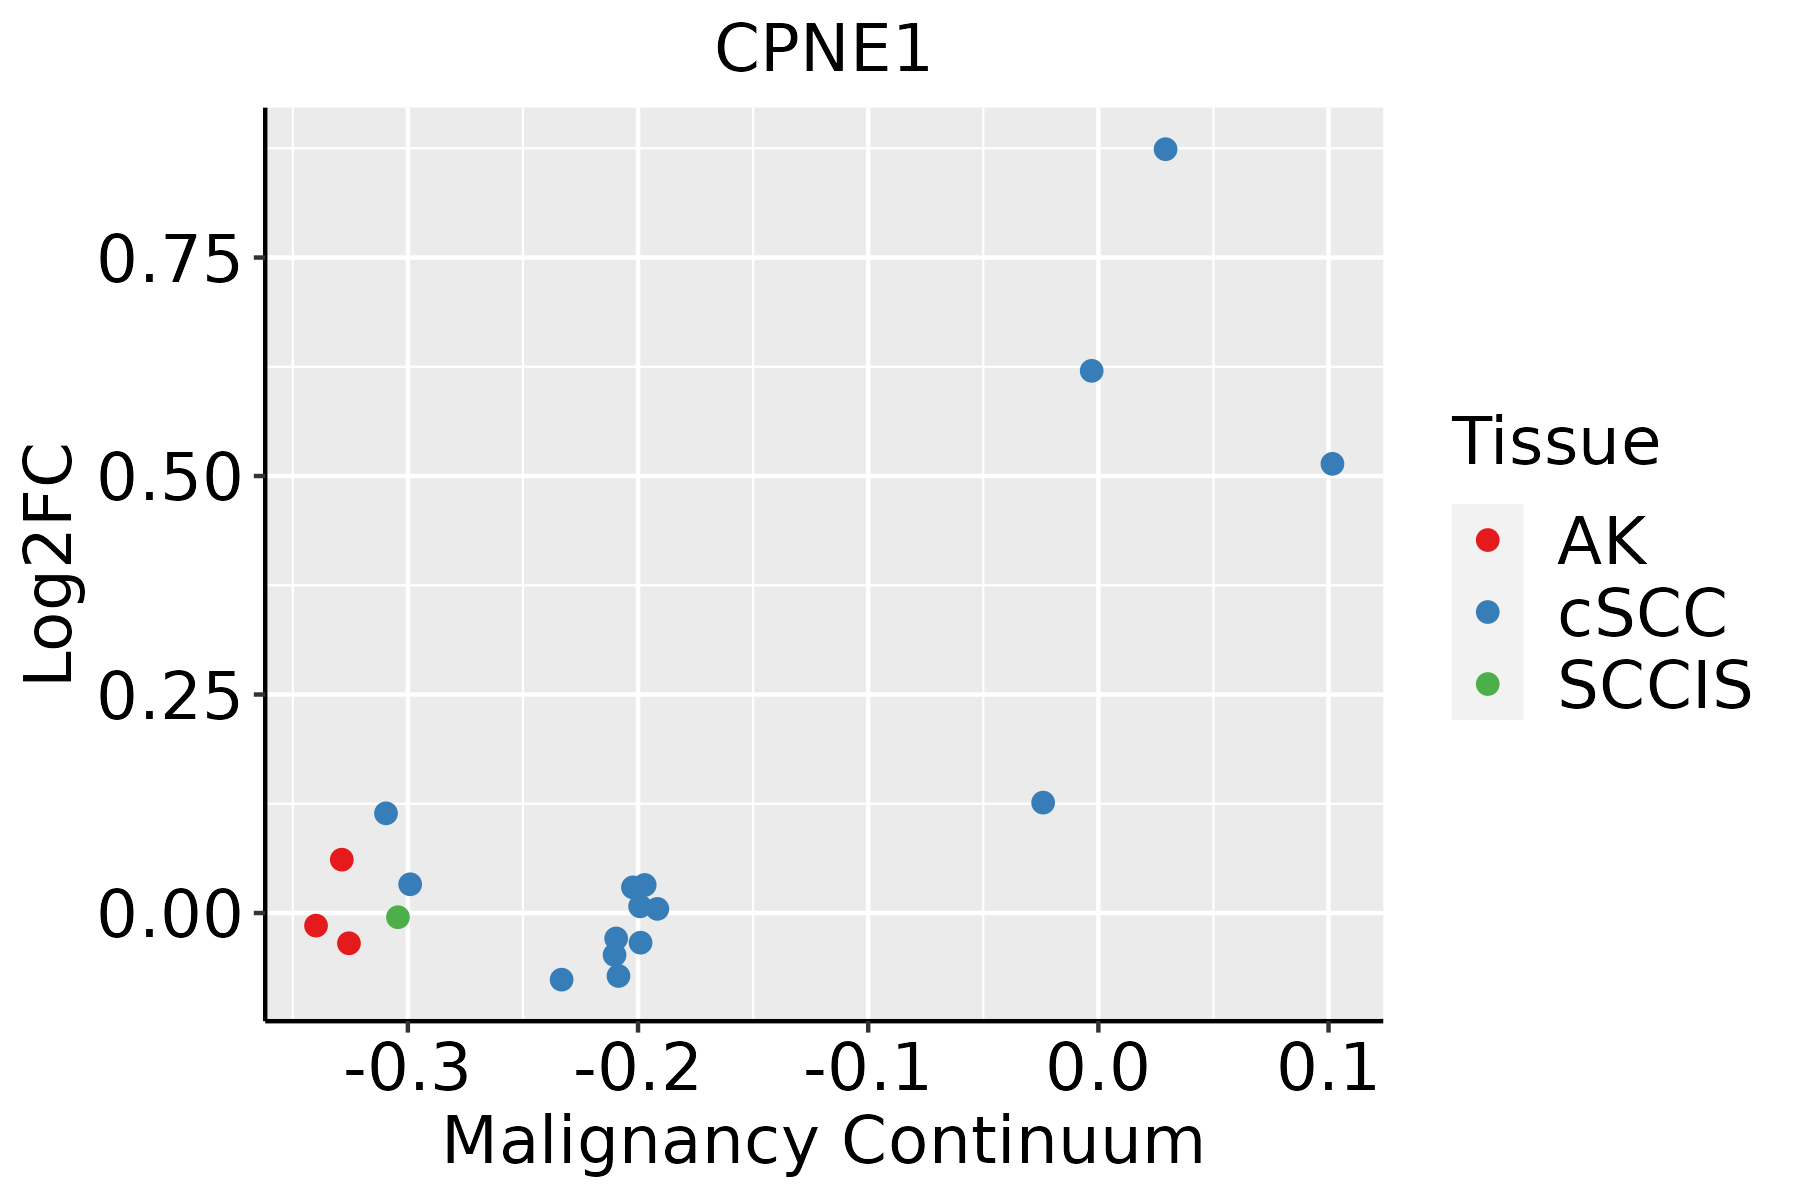
AK: Actinic keratosis
cSCC: Cutaneous squamous cell carcinoma
SCCIS:squamous cell carcinoma in situ
ThyroidThe image shows the transcriptomic changes along malignancy continuum.log2FC in expression of this searched gene in stem-like cells from each diseased tissue sample relative to stem-like cells in normal samples in each tissue plotted against the malignancy continuum. Samples are colored based on if they are from different disease stage.
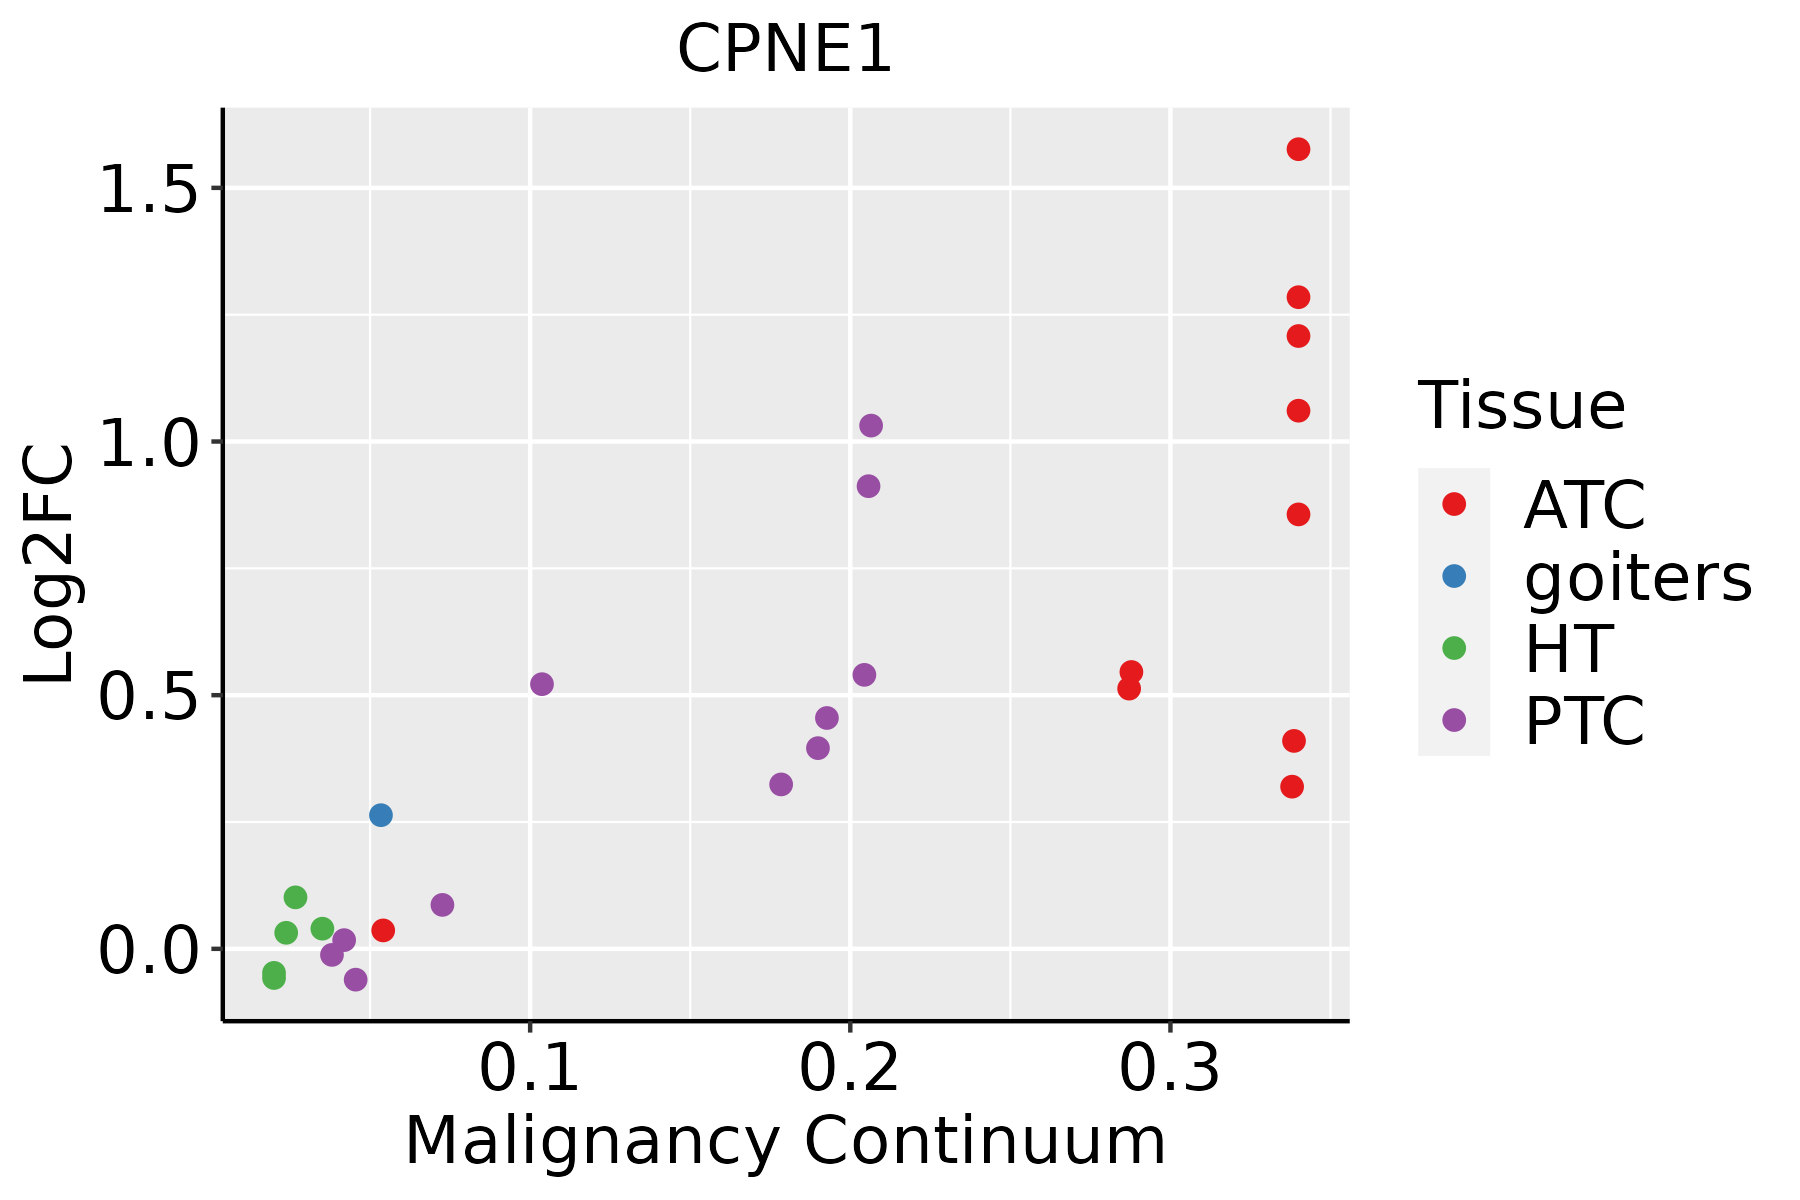
ATC: Anaplastic thyroid cancer
HT: Hashimoto's thyroiditis
PTC: Papillary thyroid cancer
∗log2FC in expression of this searched gene in stem-like cells from each diseased tissue sample relative to stem-like cells in normal samples in each tissue plotted against the malignancy continuum. Samples are colored based on if they are from different disease stage.

Top

Malignant transformation related pathway analysis

check buttonFind out the enriched GO biological processes and KEGG pathways involved in transition from healthy to precancer to cancer
check button Figure of enriched GO biological processes.
TissueDisease StageEnriched GO biological Processes
ColorectumADGO analysis - Figure of enriched GO biological processes: Top 15 enriched GO BP terms are showed in the bar plot of each disease state in each tissue. Each row represents a significant GO biological process which is colored according to the -log10(p.adjust).
ColorectumSERGO analysis - Figure of enriched GO biological processes: Top 15 enriched GO BP terms are showed in the bar plot of each disease state in each tissue. Each row represents a significant GO biological process which is colored according to the -log10(p.adjust).
ColorectumMSSGO analysis - Figure of enriched GO biological processes: Top 15 enriched GO BP terms are showed in the bar plot of each disease state in each tissue. Each row represents a significant GO biological process which is colored according to the -log10(p.adjust).
ColorectumMSI-HGO analysis - Figure of enriched GO biological processes: Top 15 enriched GO BP terms are showed in the bar plot of each disease state in each tissue. Each row represents a significant GO biological process which is colored according to the -log10(p.adjust).
ColorectumFAPGO analysis - Figure of enriched GO biological processes: Top 15 enriched GO BP terms are showed in the bar plot of each disease state in each tissue. Each row represents a significant GO biological process which is colored according to the -log10(p.adjust).
∗Top 15 enriched GO BP terms are showed in the bar plot of each disease state in each tissue. Each row represents a significant GO biological process which is colored according to the -log10(p.adjust).
Page: 1 2 3 4 5 6 7 8 9 

check button Enriched GO biological processes.
GO IDTissueDisease StageDescriptionGene RatioBg Ratiopvaluep.adjustCount
GO:007135620EsophagusESCCcellular response to tumor necrosis factor132/8552229/187231.69e-041.11e-03132
GO:00433924EsophagusESCCnegative regulation of DNA binding37/855252/187231.75e-041.14e-0337
GO:00019615EsophagusESCCpositive regulation of cytokine-mediated signaling pathway35/855250/187234.33e-042.44e-0335
GO:00607605EsophagusESCCpositive regulation of response to cytokine stimulus39/855257/187234.34e-042.44e-0339
GO:006056010EsophagusESCCdevelopmental growth involved in morphogenesis131/8552234/187239.28e-044.73e-03131
GO:007124117EsophagusESCCcellular response to inorganic substance125/8552226/187232.17e-039.67e-03125
GO:00108033EsophagusESCCregulation of tumor necrosis factor-mediated signaling pathway31/855247/187234.01e-031.62e-0231
GO:00380615EsophagusESCCNIK/NF-kappaB signaling81/8552143/187235.33e-032.00e-0281
GO:004858810EsophagusESCCdevelopmental cell growth125/8552234/187231.01e-023.46e-02125
GO:005109812LiverCirrhoticregulation of binding148/4634363/187239.14e-125.97e-10148
GO:001003812LiverCirrhoticresponse to metal ion150/4634373/187232.27e-111.37e-09150
GO:00072494LiverCirrhoticI-kappaB kinase/NF-kappaB signaling108/4634281/187232.21e-075.64e-06108
GO:00431225LiverCirrhoticregulation of I-kappaB kinase/NF-kappaB signaling95/4634249/187231.68e-063.22e-0595
GO:005159211LiverCirrhoticresponse to calcium ion61/4634149/187239.47e-061.38e-0461
GO:001604911LiverCirrhoticcell growth160/4634482/187231.50e-052.07e-04160
GO:00511006LiverCirrhoticnegative regulation of binding63/4634162/187234.54e-055.31e-0463
GO:00712487LiverCirrhoticcellular response to metal ion73/4634197/187237.73e-058.54e-0473
GO:1901222LiverCirrhoticregulation of NIK/NF-kappaB signaling46/4634112/187231.03e-041.06e-0346
GO:00712417LiverCirrhoticcellular response to inorganic substance81/4634226/187231.21e-041.20e-0381
GO:00346126LiverCirrhoticresponse to tumor necrosis factor89/4634253/187231.24e-041.22e-0389
Page: 1 2 3 4 5 6 7 8 9 10 

check button Enriched KEGG pathways.
Pathway IDTissueDisease StageDescriptionGene RatioBg Ratiopvaluep.adjustqvalueCount
Page: 1 

Top

Cell-cell communication analysis

check buttonIdentification of potential cell-cell interactions between two cell types and their ligand-receptor pairs for different disease states
LigandReceptorLRpairPathwayTissueDisease Stage
Page: 1 

Top

Single-cell gene regulatory network inference analysis

check buttonFind out the significant the regulons (TFs) and the target genes of each regulon across cell types for different disease states
TFCell TypeTissueDisease StageTarget GeneRSSRegulon Activity
∗The dot plots of a searched regulon are shown for all cell subpopulations in each disease state of each tissue based on the regulon specific score inferred using pySCENIC and by calculating the average expression.
Page: 1 

Top

Somatic mutation of malignant transformation related genes

check buttonAnnotation of somatic variants for genes involved in malignant transformation
Hugo SymbolVariant ClassVariant ClassificationdbSNP RSHGVScHGVSpHGVSp ShortSWISSPROTBIOTYPESIFTPolyPhenTumor Sample BarcodeTissueHistologySexAgeStageTherapy TypesDrugsOutcome
CPNE1SNVMissense_Mutationc.1263N>Ap.Met421Ilep.M421Iprotein_codingtolerated(0.7)benign(0)TCGA-BH-A0HF-01Breastbreast invasive carcinomaFemale>=65I/IIHormone TherapyarimidexSD
CPNE1SNVMissense_Mutationc.820N>Cp.Glu274Glnp.E274Qprotein_codingtolerated(0.27)benign(0.007)TCGA-D8-A147-01Breastbreast invasive carcinomaFemale<65I/IIChemotherapydoxorubicineSD
CPNE1SNVMissense_Mutationc.1000G>Ap.Asp334Asnp.D334Nprotein_codingdeleterious(0.03)probably_damaging(0.995)TCGA-E9-A243-01Breastbreast invasive carcinomaFemale<65I/IIChemotherapy5-fluorouracilPD
CPNE1SNVMissense_Mutationnovelc.833N>Ap.Ser278Tyrp.S278Yprotein_codingdeleterious(0)probably_damaging(0.929)TCGA-LL-A440-01Breastbreast invasive carcinomaFemale<65I/IIChemotherapycytoxanCR
CPNE1insertionFrame_Shift_Insnovelc.811_812insTGAGACAGAGTCTGGCCCTCTCACCCAGGCTGGAGTGTGGTGGCGTGp.Cys271LeufsTer19p.C271Lfs*19protein_codingTCGA-A1-A0SQ-01Breastbreast invasive carcinomaFemale<65I/IIChemotherapyacSD
CPNE1insertionIn_Frame_Insnovelc.967_968insGTGCGGp.Met323delinsSerAlaValp.M323delinsSAVprotein_codingTCGA-AN-A03X-01Breastbreast invasive carcinomaFemale>=65I/IIUnknownUnknownSD
CPNE1insertionNonsense_Mutationnovelc.965_966insTTTTTGAGAAAGAGTCTTGCTCTGTCACCCAGGCTGp.Leu322_Met323insPheTerGluArgValLeuLeuCysHisProGlyTrpp.L322_M323insF*ERVLLCHPGWprotein_codingTCGA-AN-A03X-01Breastbreast invasive carcinomaFemale>=65I/IIUnknownUnknownSD
CPNE1SNVMissense_Mutationnovelc.1086N>Cp.Leu362Phep.L362Fprotein_codingdeleterious(0)possibly_damaging(0.714)TCGA-DG-A2KM-01Cervixcervical & endocervical cancerFemale<65I/IIChemotherapycisplatinSD
CPNE1SNVMissense_Mutationc.550G>Ap.Glu184Lysp.E184Kprotein_codingdeleterious(0)probably_damaging(0.98)TCGA-MU-A5YI-01Cervixcervical & endocervical cancerFemale<65I/IIUnknownUnknownPD
CPNE1SNVMissense_Mutationc.841N>Cp.Asp281Hisp.D281Hprotein_codingdeleterious(0)probably_damaging(0.973)TCGA-AA-3494-01Colorectumcolon adenocarcinomaMale<65III/IVChemotherapyfolinicPR
Page: 1 2 3 4 5 

Top

Related drugs of malignant transformation related genes

check buttonIdentification of chemicals and drugs interact with genes involved in malignant transfromation
(DGIdb 4.0)
Entrez IDSymbolCategoryInteraction TypesDrug Claim NameDrug NamePMIDs
Page: 1