
|
|||||
|
 | |
| |
| |
| |
| |
| |
|
Gene: CHST11 |
Gene summary for CHST11 |
| Gene information | Species | Human | Gene symbol | CHST11 | Gene ID | 50515 |
| Gene name | carbohydrate sulfotransferase 11 | |
| Gene Alias | C4ST | |
| Cytomap | 12q23.3 | |
| Gene Type | protein-coding | GO ID | GO:0001501 | UniProtAcc | Q9NPF2 |
Top |
Malignant transformation analysis |
| Identification of the aberrant gene expression in precancerous and cancerous lesions by comparing the gene expression of stem-like cells in diseased tissues with normal stem cells |
| Entrez ID | Symbol | Replicates | Species | Organ | Tissue | Adj P-value | Log2FC | Malignancy |
| 50515 | CHST11 | P2T-E | Human | Esophagus | ESCC | 1.20e-79 | 2.11e+00 | 0.1177 |
| 50515 | CHST11 | P4T-E | Human | Esophagus | ESCC | 7.71e-12 | 2.40e-01 | 0.1323 |
| 50515 | CHST11 | P5T-E | Human | Esophagus | ESCC | 3.89e-20 | 2.76e-01 | 0.1327 |
| 50515 | CHST11 | P8T-E | Human | Esophagus | ESCC | 5.95e-03 | 9.06e-02 | 0.0889 |
| 50515 | CHST11 | P11T-E | Human | Esophagus | ESCC | 3.38e-08 | 4.64e-01 | 0.1426 |
| 50515 | CHST11 | P16T-E | Human | Esophagus | ESCC | 1.44e-75 | 1.64e+00 | 0.1153 |
| 50515 | CHST11 | P20T-E | Human | Esophagus | ESCC | 6.41e-12 | 1.88e-01 | 0.1124 |
| 50515 | CHST11 | P21T-E | Human | Esophagus | ESCC | 1.77e-14 | 2.90e-01 | 0.1617 |
| 50515 | CHST11 | P22T-E | Human | Esophagus | ESCC | 9.25e-05 | 1.59e-01 | 0.1236 |
| 50515 | CHST11 | P24T-E | Human | Esophagus | ESCC | 1.17e-09 | 2.15e-01 | 0.1287 |
| 50515 | CHST11 | P26T-E | Human | Esophagus | ESCC | 4.00e-06 | 7.93e-02 | 0.1276 |
| 50515 | CHST11 | P27T-E | Human | Esophagus | ESCC | 2.27e-02 | 4.04e-01 | 0.1055 |
| 50515 | CHST11 | P28T-E | Human | Esophagus | ESCC | 1.53e-04 | 7.74e-02 | 0.1149 |
| 50515 | CHST11 | P31T-E | Human | Esophagus | ESCC | 2.48e-04 | 1.30e-01 | 0.1251 |
| 50515 | CHST11 | P32T-E | Human | Esophagus | ESCC | 3.04e-12 | 2.63e-01 | 0.1666 |
| 50515 | CHST11 | P37T-E | Human | Esophagus | ESCC | 1.78e-21 | 4.91e-01 | 0.1371 |
| 50515 | CHST11 | P40T-E | Human | Esophagus | ESCC | 8.20e-08 | 3.09e-01 | 0.109 |
| 50515 | CHST11 | P42T-E | Human | Esophagus | ESCC | 3.91e-02 | 7.34e-02 | 0.1175 |
| 50515 | CHST11 | P44T-E | Human | Esophagus | ESCC | 5.22e-06 | 1.97e-01 | 0.1096 |
| 50515 | CHST11 | P47T-E | Human | Esophagus | ESCC | 8.04e-05 | 1.39e-01 | 0.1067 |
| Page: 1 2 3 |
| Tissue | Expression Dynamics | Abbreviation |
| Esophagus | 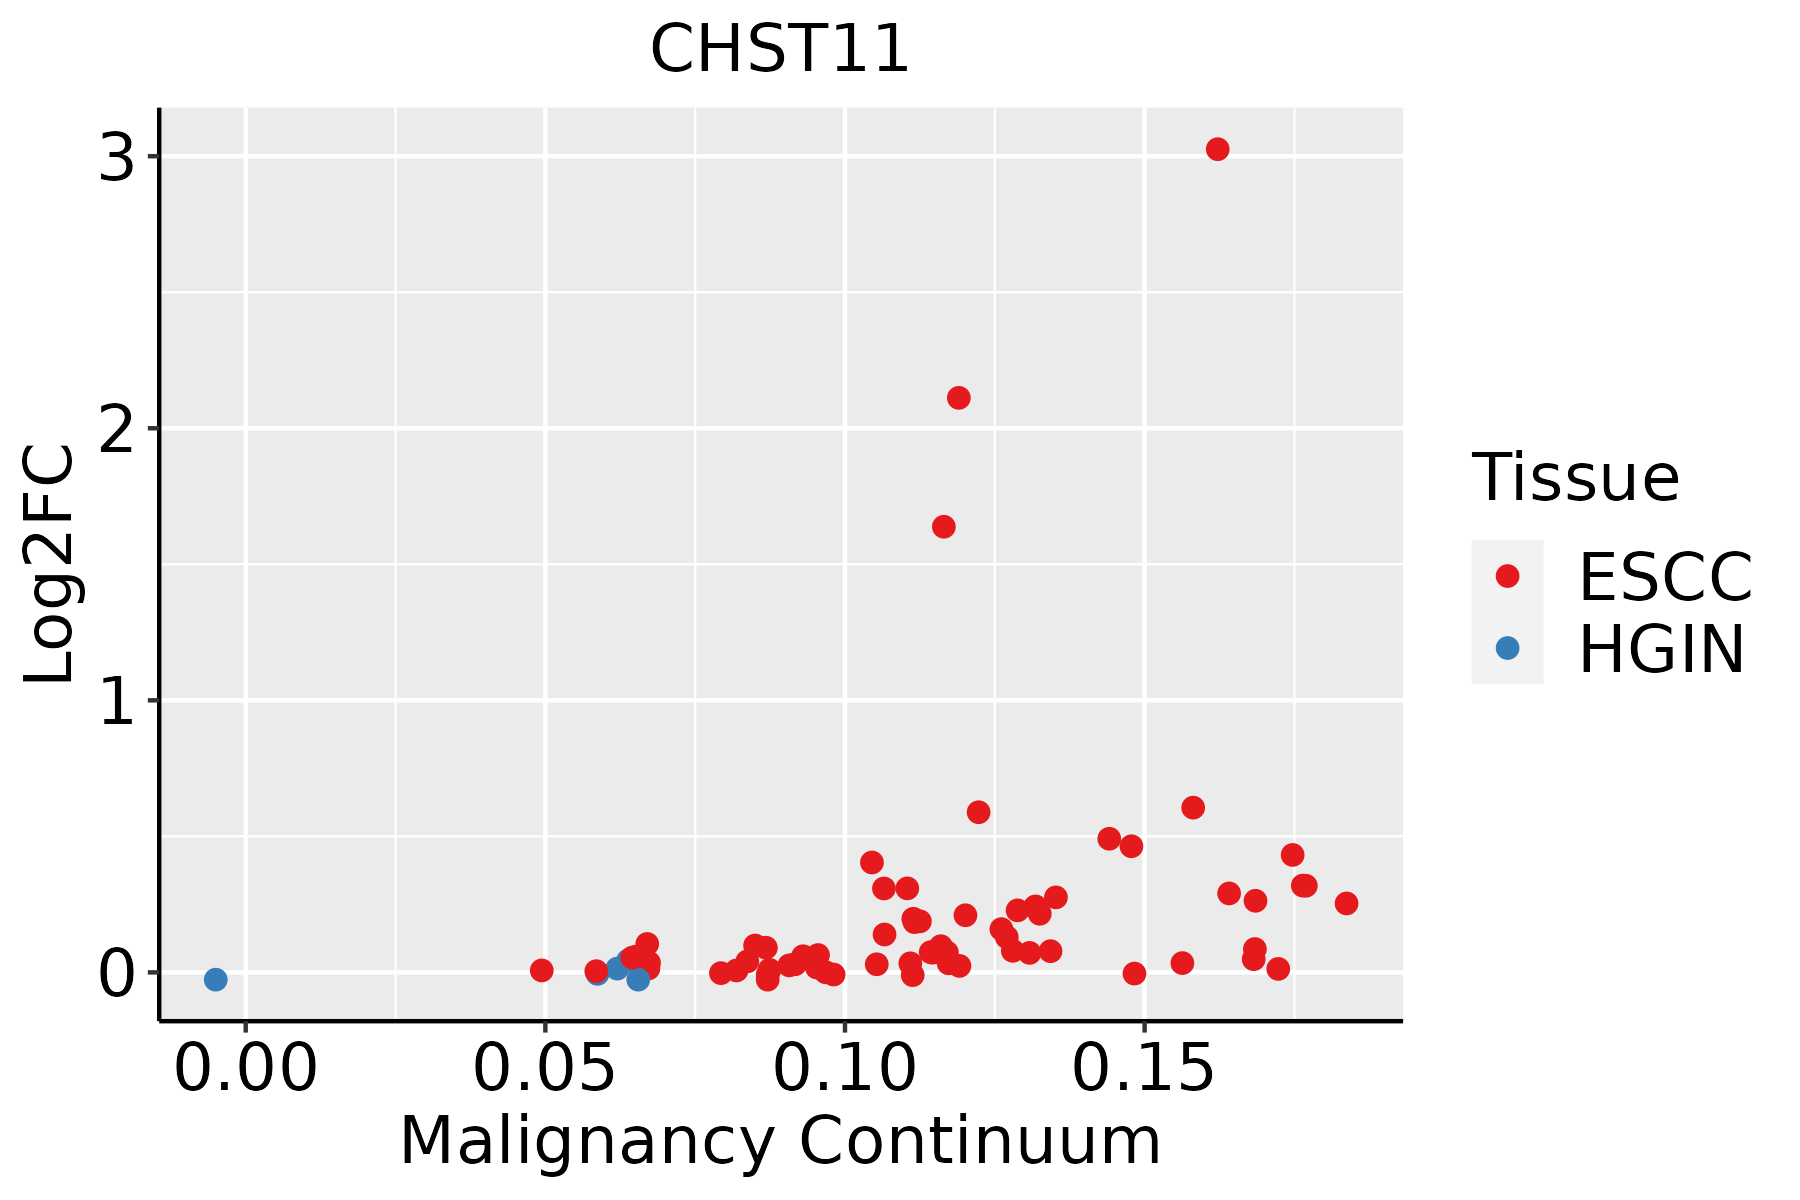 | ESCC: Esophageal squamous cell carcinoma |
| HGIN: High-grade intraepithelial neoplasias | ||
| LGIN: Low-grade intraepithelial neoplasias | ||
| Lung | 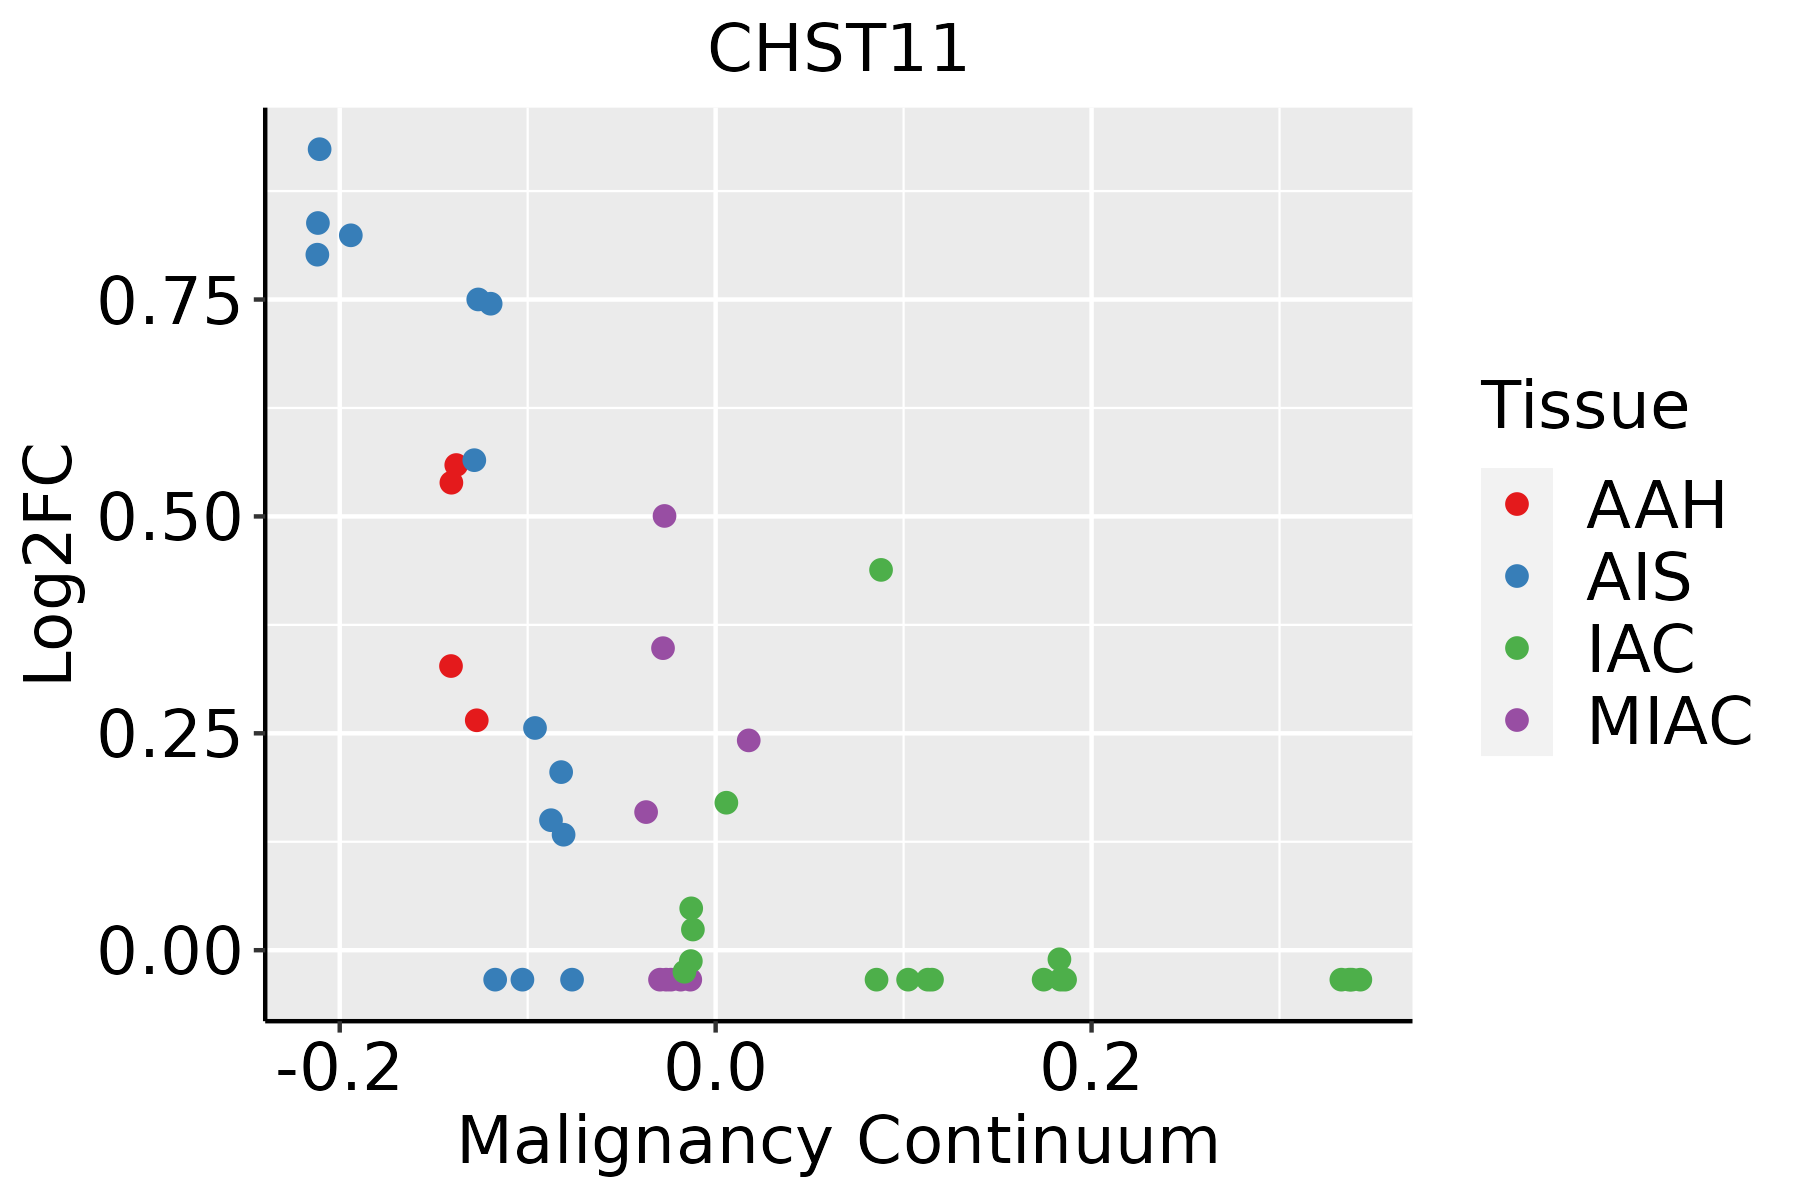 | AAH: Atypical adenomatous hyperplasia |
| AIS: Adenocarcinoma in situ | ||
| IAC: Invasive lung adenocarcinoma | ||
| MIA: Minimally invasive adenocarcinoma | ||
| Oral Cavity | 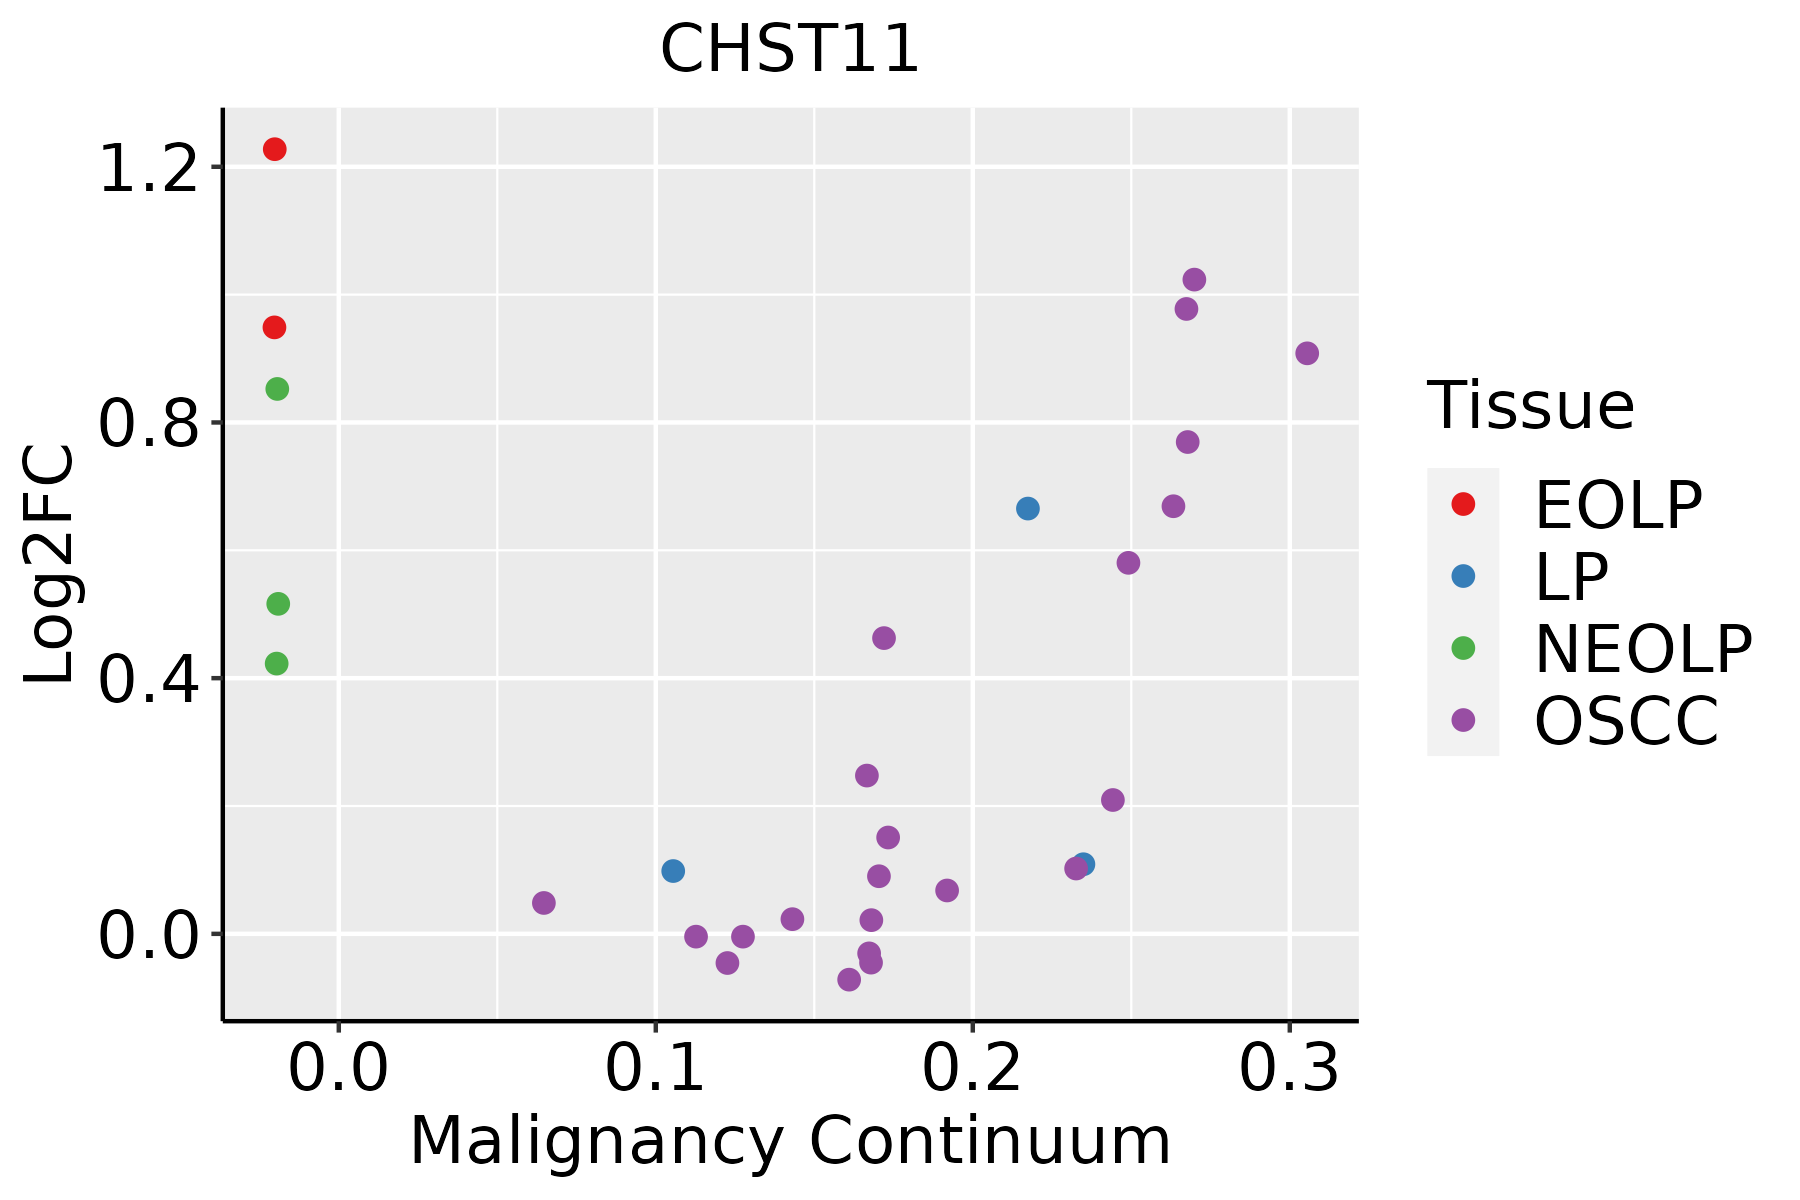 | EOLP: Erosive Oral lichen planus |
| LP: leukoplakia | ||
| NEOLP: Non-erosive oral lichen planus | ||
| OSCC: Oral squamous cell carcinoma | ||
| Thyroid |  | ATC: Anaplastic thyroid cancer |
| HT: Hashimoto's thyroiditis | ||
| PTC: Papillary thyroid cancer |
| ∗log2FC in expression of this searched gene in stem-like cells from each diseased tissue sample relative to stem-like cells in normal samples in each tissue plotted against the malignancy continuum. Samples are colored based on if they are from different disease stage. |
Top |
Malignant transformation related pathway analysis |
| Find out the enriched GO biological processes and KEGG pathways involved in transition from healthy to precancer to cancer |
| Tissue | Disease Stage | Enriched GO biological Processes |
| Colorectum | AD |  |
| Colorectum | SER |  |
| Colorectum | MSS |  |
| Colorectum | MSI-H |  |
| Colorectum | FAP |  |
| ∗Top 15 enriched GO BP terms are showed in the bar plot of each disease state in each tissue. Each row represents a significant GO biological process which is colored according to the -log10(p.adjust). |
| Page: 1 2 3 4 5 6 7 8 9 |
| GO ID | Tissue | Disease Stage | Description | Gene Ratio | Bg Ratio | pvalue | p.adjust | Count |
| GO:00067905 | Oral cavity | OSCC | sulfur compound metabolic process | 168/7305 | 339/18723 | 4.50e-05 | 3.84e-04 | 168 |
| GO:00170155 | Oral cavity | OSCC | regulation of transforming growth factor beta receptor signaling pathway | 71/7305 | 128/18723 | 1.14e-04 | 8.34e-04 | 71 |
| GO:19038446 | Oral cavity | OSCC | regulation of cellular response to transforming growth factor beta stimulus | 72/7305 | 131/18723 | 1.51e-04 | 1.06e-03 | 72 |
| GO:0030206 | Oral cavity | OSCC | chondroitin sulfate biosynthetic process | 15/7305 | 18/18723 | 1.53e-04 | 1.07e-03 | 15 |
| GO:00091001 | Oral cavity | OSCC | glycoprotein metabolic process | 185/7305 | 387/18723 | 2.37e-04 | 1.54e-03 | 185 |
| GO:00091011 | Oral cavity | OSCC | glycoprotein biosynthetic process | 151/7305 | 317/18723 | 1.01e-03 | 5.26e-03 | 151 |
| GO:00071789 | Oral cavity | OSCC | transmembrane receptor protein serine/threonine kinase signaling pathway | 165/7305 | 355/18723 | 2.31e-03 | 1.02e-02 | 165 |
| GO:0050650 | Oral cavity | OSCC | chondroitin sulfate proteoglycan biosynthetic process | 16/7305 | 23/18723 | 2.93e-03 | 1.27e-02 | 16 |
| GO:00160513 | Oral cavity | OSCC | carbohydrate biosynthetic process | 97/7305 | 202/18723 | 5.50e-03 | 2.13e-02 | 97 |
| GO:0030204 | Oral cavity | OSCC | chondroitin sulfate metabolic process | 19/7305 | 30/18723 | 6.03e-03 | 2.28e-02 | 19 |
| GO:0048703 | Oral cavity | OSCC | embryonic viscerocranium morphogenesis | 8/7305 | 10/18723 | 1.03e-02 | 3.53e-02 | 8 |
| GO:1904888 | Oral cavity | OSCC | cranial skeletal system development | 36/7305 | 68/18723 | 1.36e-02 | 4.50e-02 | 36 |
| GO:007155916 | Oral cavity | EOLP | response to transforming growth factor beta | 56/2218 | 256/18723 | 3.54e-06 | 7.58e-05 | 56 |
| GO:007156016 | Oral cavity | EOLP | cellular response to transforming growth factor beta stimulus | 54/2218 | 250/18723 | 7.76e-06 | 1.49e-04 | 54 |
| GO:000170123 | Oral cavity | EOLP | in utero embryonic development | 72/2218 | 367/18723 | 1.02e-05 | 1.83e-04 | 72 |
| GO:000979121 | Oral cavity | EOLP | post-embryonic development | 23/2218 | 80/18723 | 3.53e-05 | 4.91e-04 | 23 |
| GO:000717916 | Oral cavity | EOLP | transforming growth factor beta receptor signaling pathway | 43/2218 | 198/18723 | 5.48e-05 | 7.03e-04 | 43 |
| GO:190384414 | Oral cavity | EOLP | regulation of cellular response to transforming growth factor beta stimulus | 30/2218 | 131/18723 | 2.66e-04 | 2.56e-03 | 30 |
| GO:00902872 | Oral cavity | EOLP | regulation of cellular response to growth factor stimulus | 57/2218 | 304/18723 | 2.84e-04 | 2.70e-03 | 57 |
| GO:000717816 | Oral cavity | EOLP | transmembrane receptor protein serine/threonine kinase signaling pathway | 64/2218 | 355/18723 | 3.85e-04 | 3.46e-03 | 64 |
| Page: 1 2 3 4 5 6 7 |
| Pathway ID | Tissue | Disease Stage | Description | Gene Ratio | Bg Ratio | pvalue | p.adjust | qvalue | Count |
| hsa00532 | Oral cavity | OSCC | Glycosaminoglycan biosynthesis - chondroitin sulfate / dermatan sulfate | 16/3704 | 21/8465 | 2.61e-03 | 6.77e-03 | 3.45e-03 | 16 |
| hsa005321 | Oral cavity | OSCC | Glycosaminoglycan biosynthesis - chondroitin sulfate / dermatan sulfate | 16/3704 | 21/8465 | 2.61e-03 | 6.77e-03 | 3.45e-03 | 16 |
| Page: 1 |
Top |
Cell-cell communication analysis |
| Identification of potential cell-cell interactions between two cell types and their ligand-receptor pairs for different disease states |
| Ligand | Receptor | LRpair | Pathway | Tissue | Disease Stage |
| Page: 1 |
Top |
Single-cell gene regulatory network inference analysis |
| Find out the significant the regulons (TFs) and the target genes of each regulon across cell types for different disease states |
| TF | Cell Type | Tissue | Disease Stage | Target Gene | RSS | Regulon Activity |
| ∗The dot plots of a searched regulon are shown for all cell subpopulations in each disease state of each tissue based on the regulon specific score inferred using pySCENIC and by calculating the average expression. |
| Page: 1 |
Top |
Somatic mutation of malignant transformation related genes |
| Annotation of somatic variants for genes involved in malignant transformation |
| Hugo Symbol | Variant Class | Variant Classification | dbSNP RS | HGVSc | HGVSp | HGVSp Short | SWISSPROT | BIOTYPE | SIFT | PolyPhen | Tumor Sample Barcode | Tissue | Histology | Sex | Age | Stage | Therapy Types | Drugs | Outcome |
| CHST11 | SNV | Missense_Mutation | c.237N>C | p.Gln79His | p.Q79H | Q9NPF2 | protein_coding | deleterious(0.02) | probably_damaging(0.979) | TCGA-AC-A23H-01 | Breast | breast invasive carcinoma | Female | >=65 | I/II | Unknown | Unknown | PD | |
| CHST11 | SNV | Missense_Mutation | c.937N>A | p.Glu313Lys | p.E313K | Q9NPF2 | protein_coding | tolerated(0.26) | benign(0.124) | TCGA-AC-A6IW-01 | Breast | breast invasive carcinoma | Female | >=65 | I/II | Unknown | Unknown | SD | |
| CHST11 | SNV | Missense_Mutation | c.751C>T | p.Arg251Trp | p.R251W | Q9NPF2 | protein_coding | deleterious(0) | probably_damaging(0.955) | TCGA-EW-A1IZ-01 | Breast | breast invasive carcinoma | Female | <65 | III/IV | Chemotherapy | taxotere | SD | |
| CHST11 | deletion | Frame_Shift_Del | novel | c.769delN | p.Glu257AsnfsTer43 | p.E257Nfs*43 | Q9NPF2 | protein_coding | TCGA-D8-A27V-01 | Breast | breast invasive carcinoma | Female | <65 | I/II | Hormone Therapy | tamoxiphen | SD | ||
| CHST11 | SNV | Missense_Mutation | c.528G>C | p.Leu176Phe | p.L176F | Q9NPF2 | protein_coding | deleterious(0) | probably_damaging(1) | TCGA-C5-A1M6-01 | Cervix | cervical & endocervical cancer | Female | <65 | I/II | Chemotherapy | cisplatin | PD | |
| CHST11 | SNV | Missense_Mutation | novel | c.311C>A | p.Pro104His | p.P104H | Q9NPF2 | protein_coding | deleterious(0) | probably_damaging(0.962) | TCGA-C5-A1MJ-01 | Cervix | cervical & endocervical cancer | Female | <65 | I/II | Unknown | Unknown | SD |
| CHST11 | SNV | Missense_Mutation | c.83N>G | p.Leu28Arg | p.L28R | Q9NPF2 | protein_coding | deleterious(0) | benign(0.125) | TCGA-A6-5661-01 | Colorectum | colon adenocarcinoma | Female | >=65 | I/II | Unknown | Unknown | SD | |
| CHST11 | SNV | Missense_Mutation | novel | c.427N>G | p.Lys143Glu | p.K143E | Q9NPF2 | protein_coding | tolerated(0.24) | possibly_damaging(0.534) | TCGA-A6-6780-01 | Colorectum | colon adenocarcinoma | Male | >=65 | I/II | Unknown | Unknown | SD |
| CHST11 | SNV | Missense_Mutation | rs759769235 | c.295N>T | p.Arg99Trp | p.R99W | Q9NPF2 | protein_coding | deleterious(0) | probably_damaging(0.977) | TCGA-AA-3495-01 | Colorectum | colon adenocarcinoma | Male | >=65 | I/II | Unknown | Unknown | SD |
| CHST11 | SNV | Missense_Mutation | c.398N>A | p.Arg133Gln | p.R133Q | Q9NPF2 | protein_coding | deleterious(0) | probably_damaging(0.997) | TCGA-AA-3864-01 | Colorectum | colon adenocarcinoma | Male | >=65 | I/II | Unknown | Unknown | SD |
| Page: 1 2 3 4 5 6 |
Top |
Related drugs of malignant transformation related genes |
| Identification of chemicals and drugs interact with genes involved in malignant transfromation |
| (DGIdb 4.0) |
| Entrez ID | Symbol | Category | Interaction Types | Drug Claim Name | Drug Name | PMIDs |
| 50515 | CHST11 | ENZYME, DRUGGABLE GENOME | CHONDROITIN SULFATE | 16079159 | ||
| 50515 | CHST11 | ENZYME, DRUGGABLE GENOME | CHONDROITIN | 11056388 |
| Page: 1 |

Copyright 2023-Present -The University of Texas Health Science Center at Houston |