
|
|||||
|
 | |
| |
| |
| |
| |
| |
|
Gene: CHD7 |
Gene summary for CHD7 |
| Gene information | Species | Human | Gene symbol | CHD7 | Gene ID | 55636 |
| Gene name | chromodomain helicase DNA binding protein 7 | |
| Gene Alias | CRG | |
| Cytomap | 8q12.2 | |
| Gene Type | protein-coding | GO ID | GO:0000003 | UniProtAcc | Q9P2D1 |
Top |
Malignant transformation analysis |
| Identification of the aberrant gene expression in precancerous and cancerous lesions by comparing the gene expression of stem-like cells in diseased tissues with normal stem cells |
| Entrez ID | Symbol | Replicates | Species | Organ | Tissue | Adj P-value | Log2FC | Malignancy |
| 55636 | CHD7 | CCI_1 | Human | Cervix | CC | 8.23e-03 | 5.69e-01 | 0.528 |
| 55636 | CHD7 | CCI_2 | Human | Cervix | CC | 8.73e-03 | 7.12e-01 | 0.5249 |
| 55636 | CHD7 | CCI_3 | Human | Cervix | CC | 5.80e-06 | 5.65e-01 | 0.516 |
| 55636 | CHD7 | HTA11_3410_2000001011 | Human | Colorectum | AD | 7.20e-29 | -7.03e-01 | 0.0155 |
| 55636 | CHD7 | HTA11_2487_2000001011 | Human | Colorectum | SER | 2.04e-12 | -6.76e-01 | -0.1808 |
| 55636 | CHD7 | HTA11_2951_2000001011 | Human | Colorectum | AD | 3.50e-02 | -6.16e-01 | 0.0216 |
| 55636 | CHD7 | HTA11_2112_2000001011 | Human | Colorectum | SER | 9.97e-04 | -7.56e-01 | -0.2196 |
| 55636 | CHD7 | HTA11_3361_2000001011 | Human | Colorectum | AD | 1.11e-06 | -6.13e-01 | -0.1207 |
| 55636 | CHD7 | HTA11_696_2000001011 | Human | Colorectum | AD | 1.22e-03 | -2.97e-01 | -0.1464 |
| 55636 | CHD7 | HTA11_866_2000001011 | Human | Colorectum | AD | 2.14e-04 | -3.45e-01 | -0.1001 |
| 55636 | CHD7 | HTA11_2992_2000001011 | Human | Colorectum | SER | 1.49e-05 | -6.98e-01 | -0.1706 |
| 55636 | CHD7 | HTA11_5212_2000001011 | Human | Colorectum | AD | 1.24e-03 | -6.69e-01 | -0.2061 |
| 55636 | CHD7 | HTA11_9341_2000001011 | Human | Colorectum | SER | 3.95e-03 | -8.56e-01 | -0.00410000000000005 |
| 55636 | CHD7 | HTA11_7862_2000001011 | Human | Colorectum | AD | 9.85e-09 | -7.97e-01 | -0.0179 |
| 55636 | CHD7 | HTA11_866_3004761011 | Human | Colorectum | AD | 6.63e-03 | -3.26e-01 | 0.096 |
| 55636 | CHD7 | HTA11_4255_2000001011 | Human | Colorectum | SER | 2.01e-02 | -6.69e-01 | 0.0446 |
| 55636 | CHD7 | HTA11_8622_2000001021 | Human | Colorectum | SER | 2.10e-04 | -6.47e-01 | 0.0528 |
| 55636 | CHD7 | HTA11_6801_2000001011 | Human | Colorectum | SER | 8.77e-03 | -7.02e-01 | 0.0171 |
| 55636 | CHD7 | HTA11_10711_2000001011 | Human | Colorectum | AD | 7.83e-06 | -4.65e-01 | 0.0338 |
| 55636 | CHD7 | HTA11_7696_3000711011 | Human | Colorectum | AD | 4.12e-04 | -3.41e-01 | 0.0674 |
| Page: 1 2 3 4 5 6 7 8 |
| Tissue | Expression Dynamics | Abbreviation |
| Cervix | 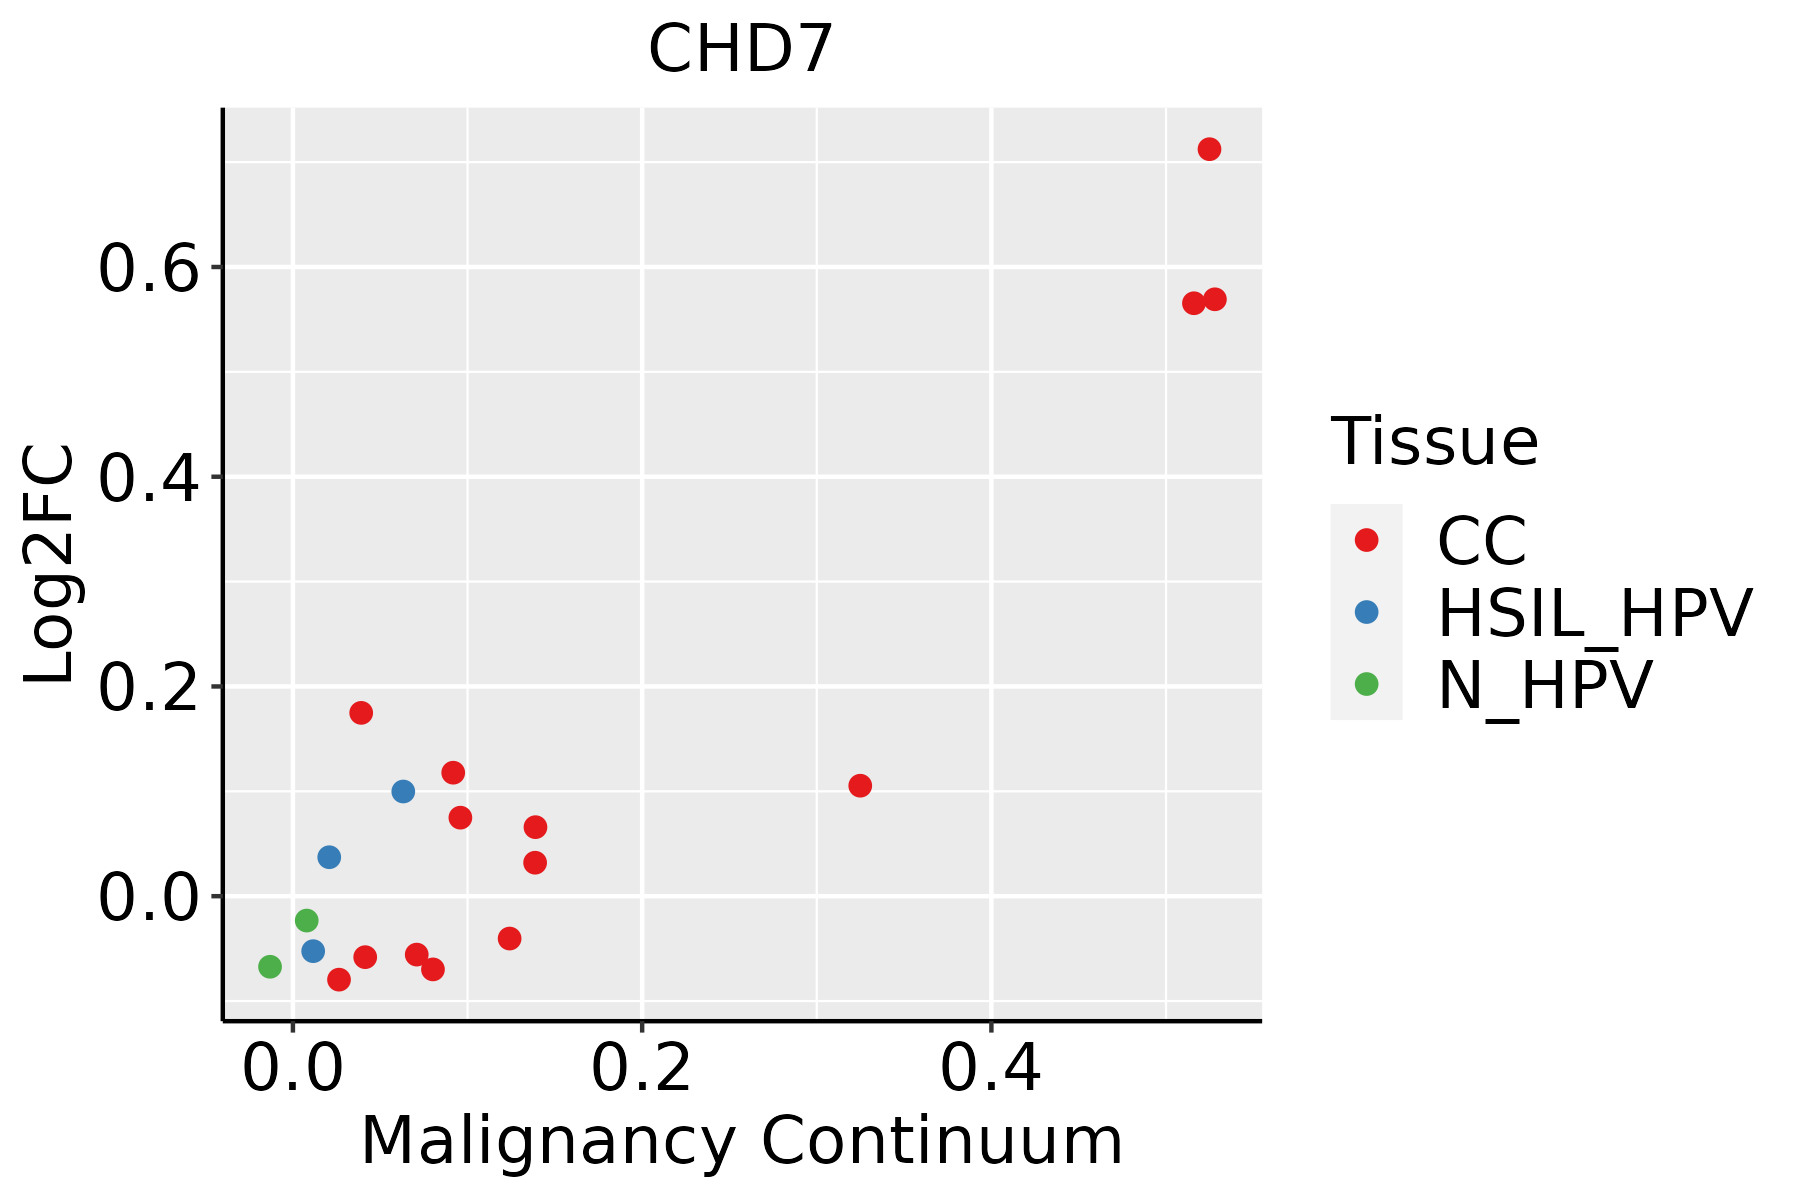 | CC: Cervix cancer |
| HSIL_HPV: HPV-infected high-grade squamous intraepithelial lesions | ||
| N_HPV: HPV-infected normal cervix | ||
| Colorectum (GSE201348) |  | FAP: Familial adenomatous polyposis |
| CRC: Colorectal cancer | ||
| Colorectum (HTA11) |  | AD: Adenomas |
| SER: Sessile serrated lesions | ||
| MSI-H: Microsatellite-high colorectal cancer | ||
| MSS: Microsatellite stable colorectal cancer | ||
| Esophagus | 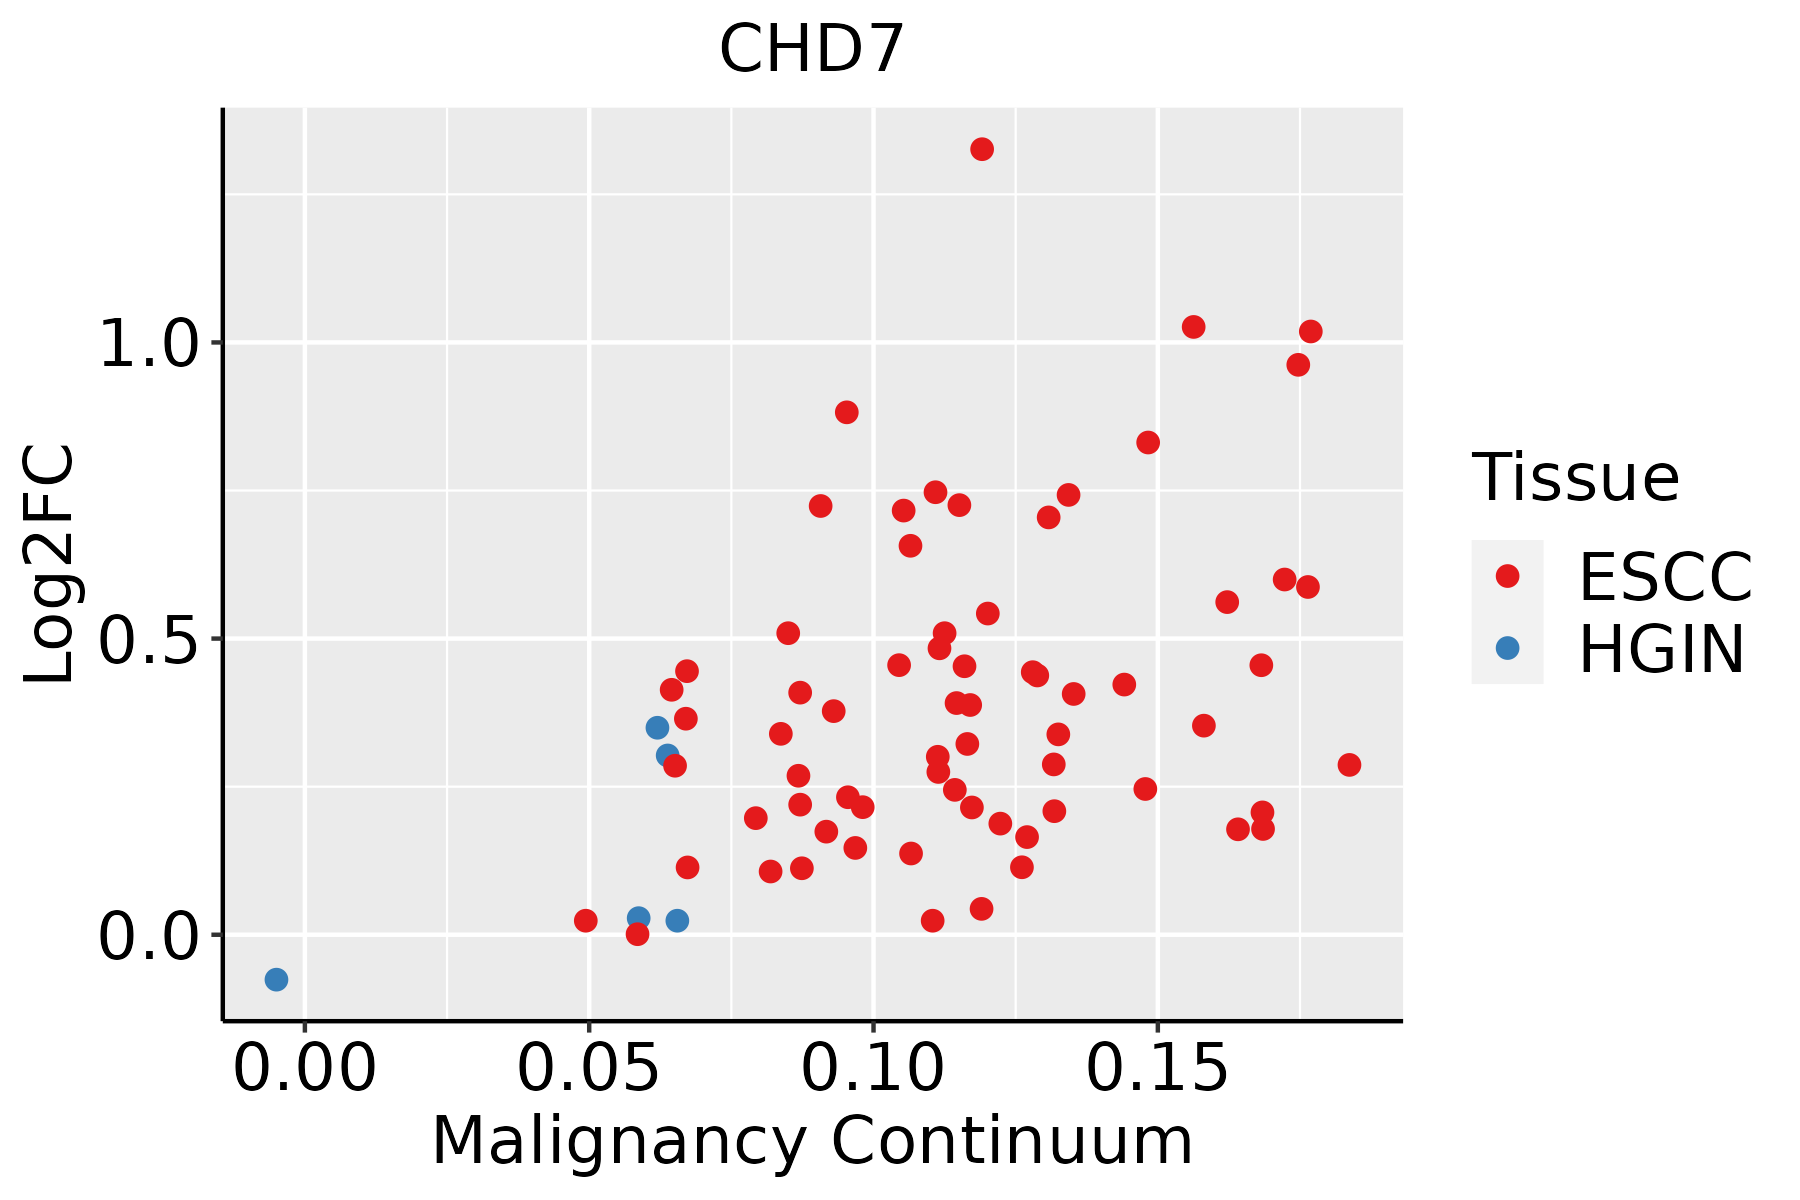 | ESCC: Esophageal squamous cell carcinoma |
| HGIN: High-grade intraepithelial neoplasias | ||
| LGIN: Low-grade intraepithelial neoplasias | ||
| Liver | 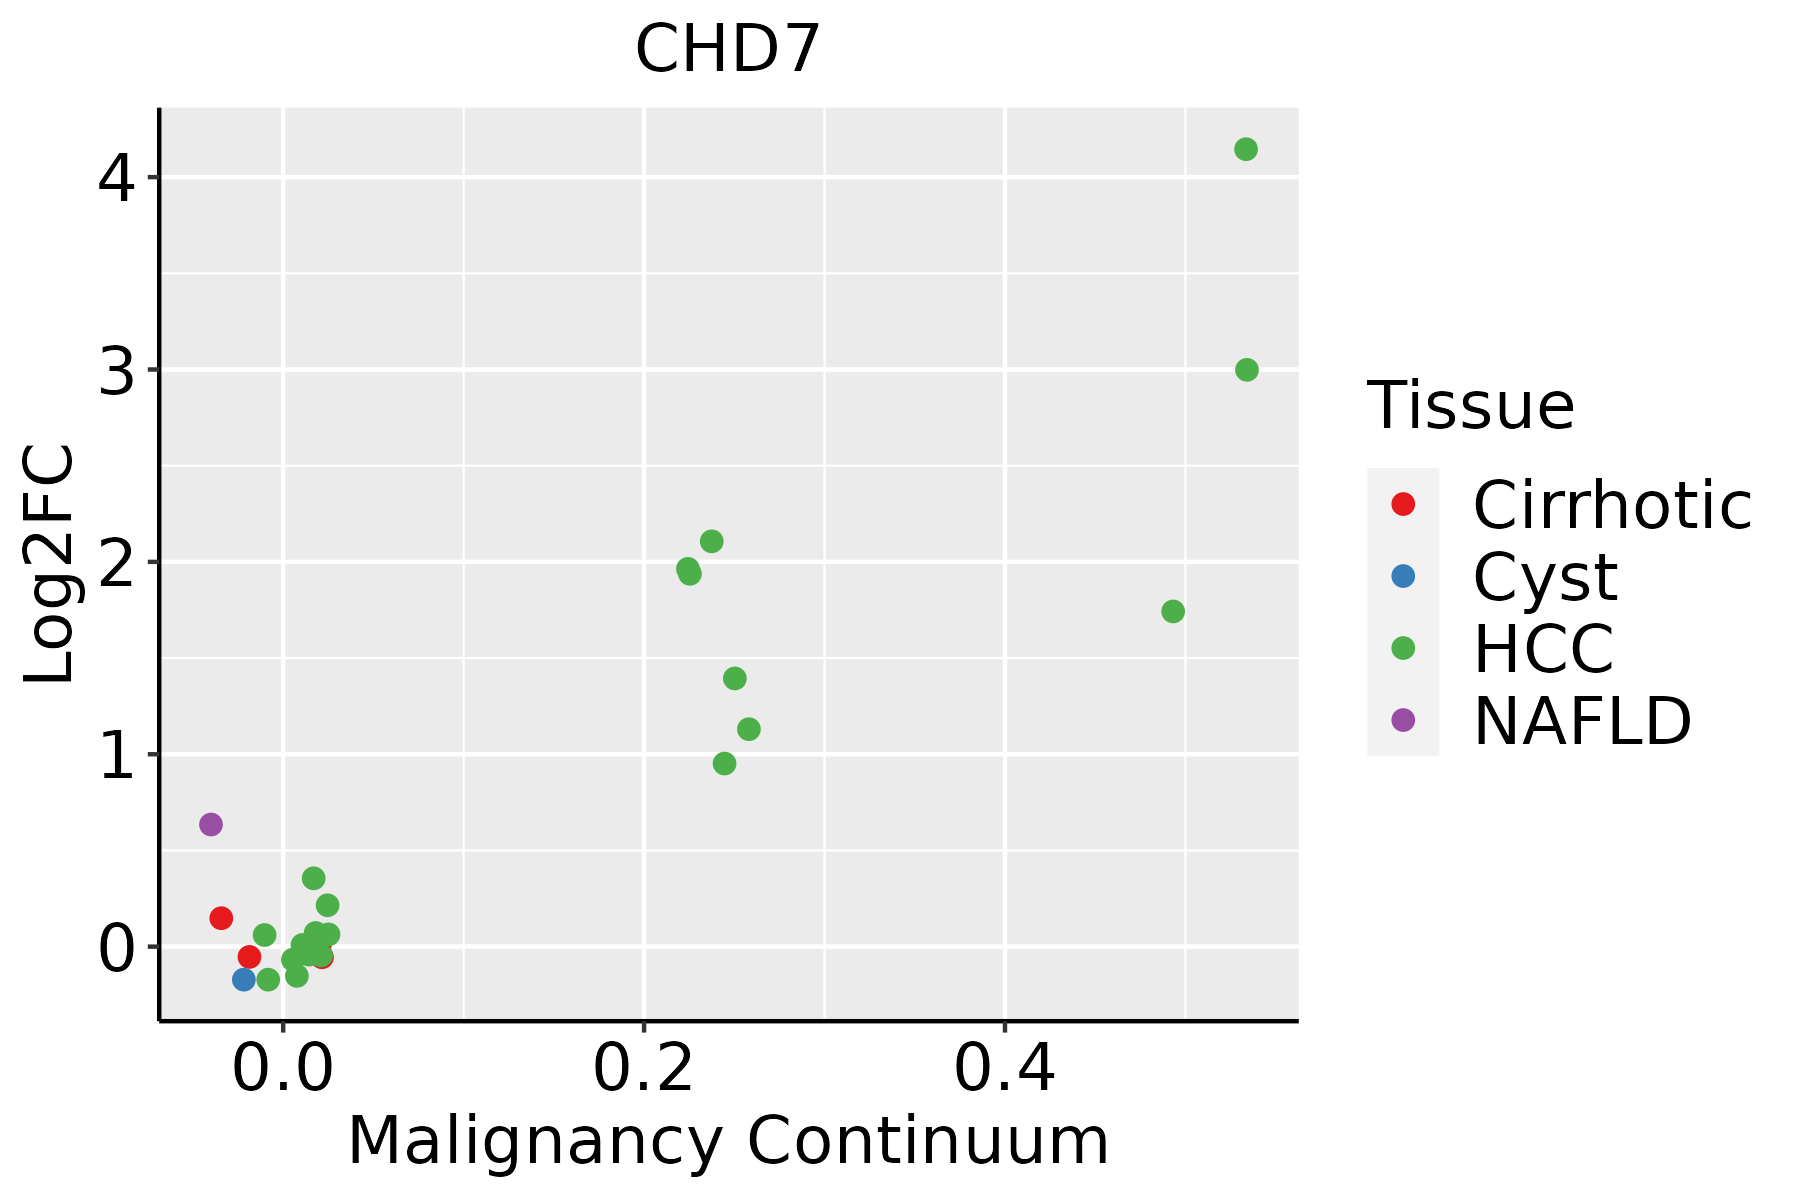 | HCC: Hepatocellular carcinoma |
| NAFLD: Non-alcoholic fatty liver disease | ||
| Oral Cavity | 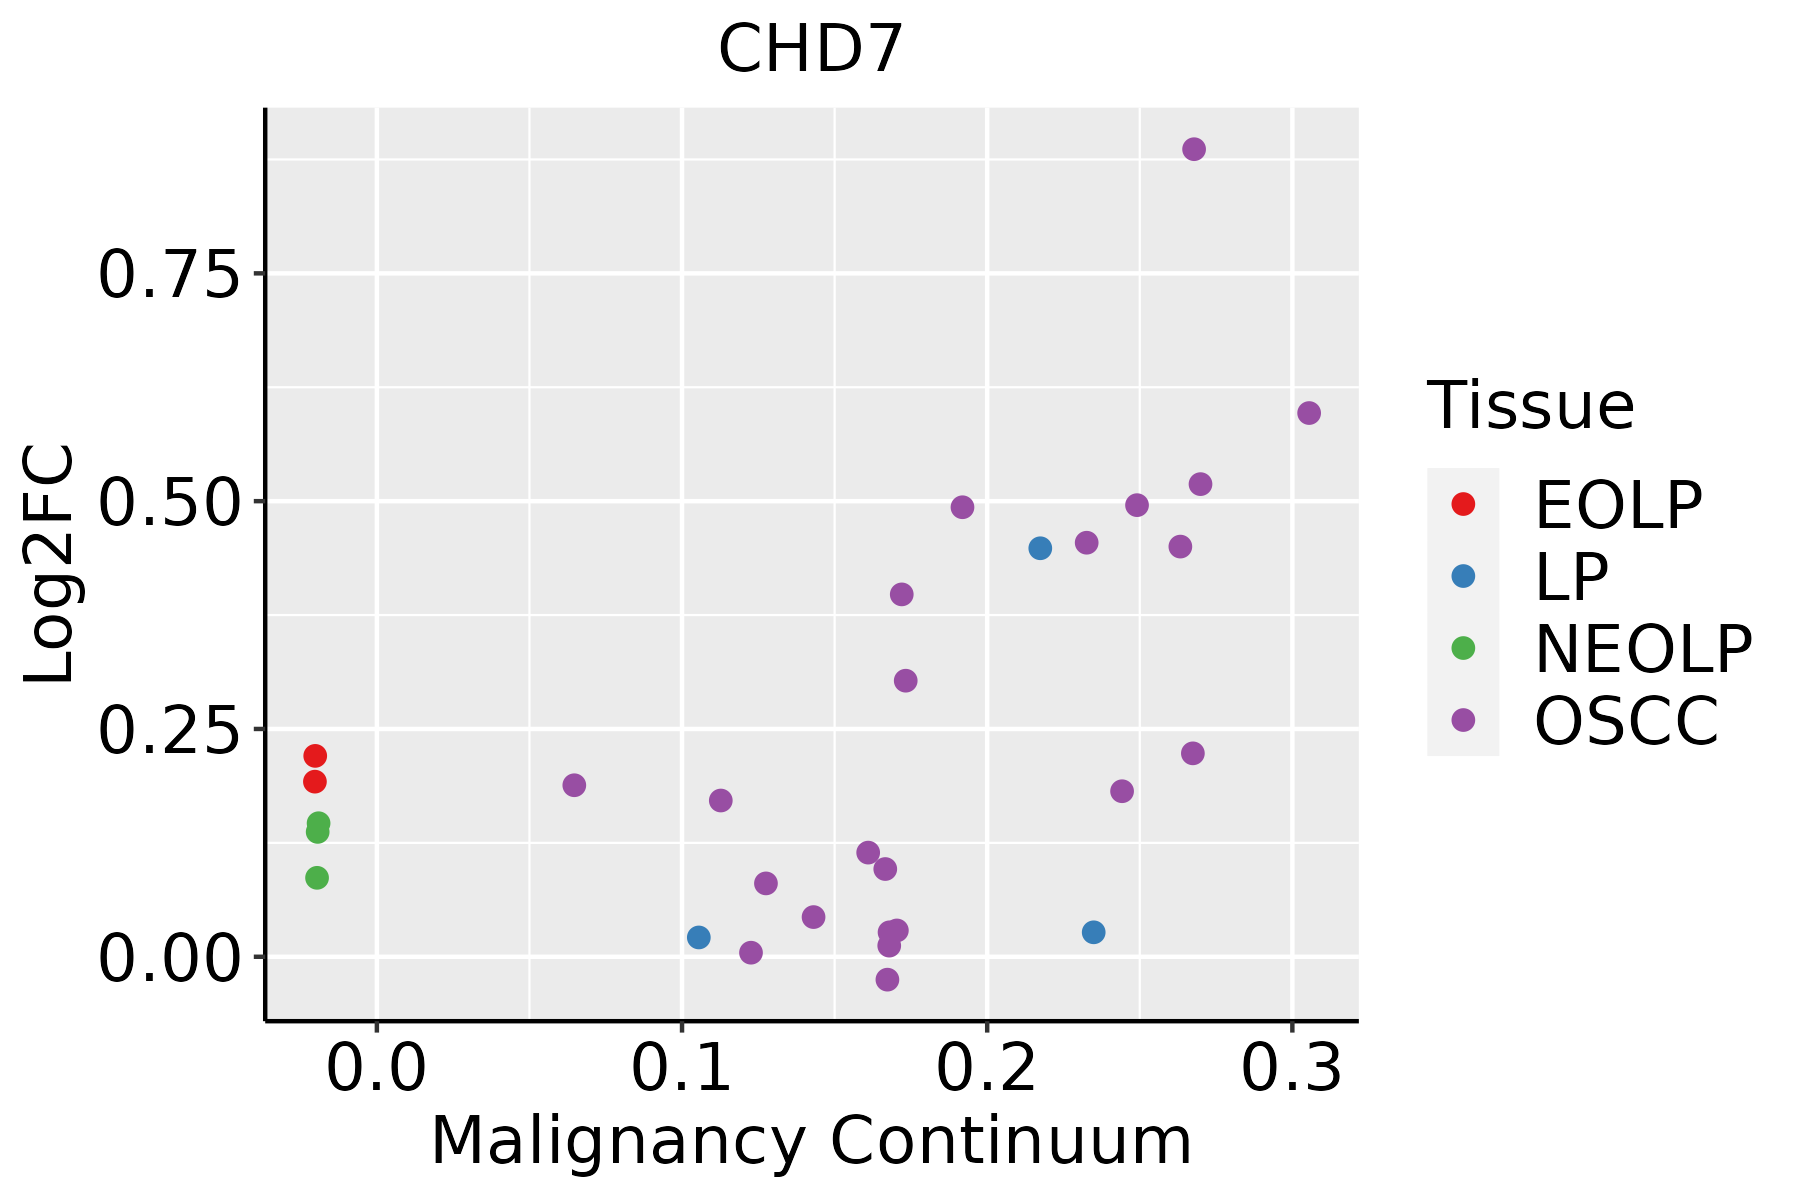 | EOLP: Erosive Oral lichen planus |
| LP: leukoplakia | ||
| NEOLP: Non-erosive oral lichen planus | ||
| OSCC: Oral squamous cell carcinoma | ||
| Thyroid | 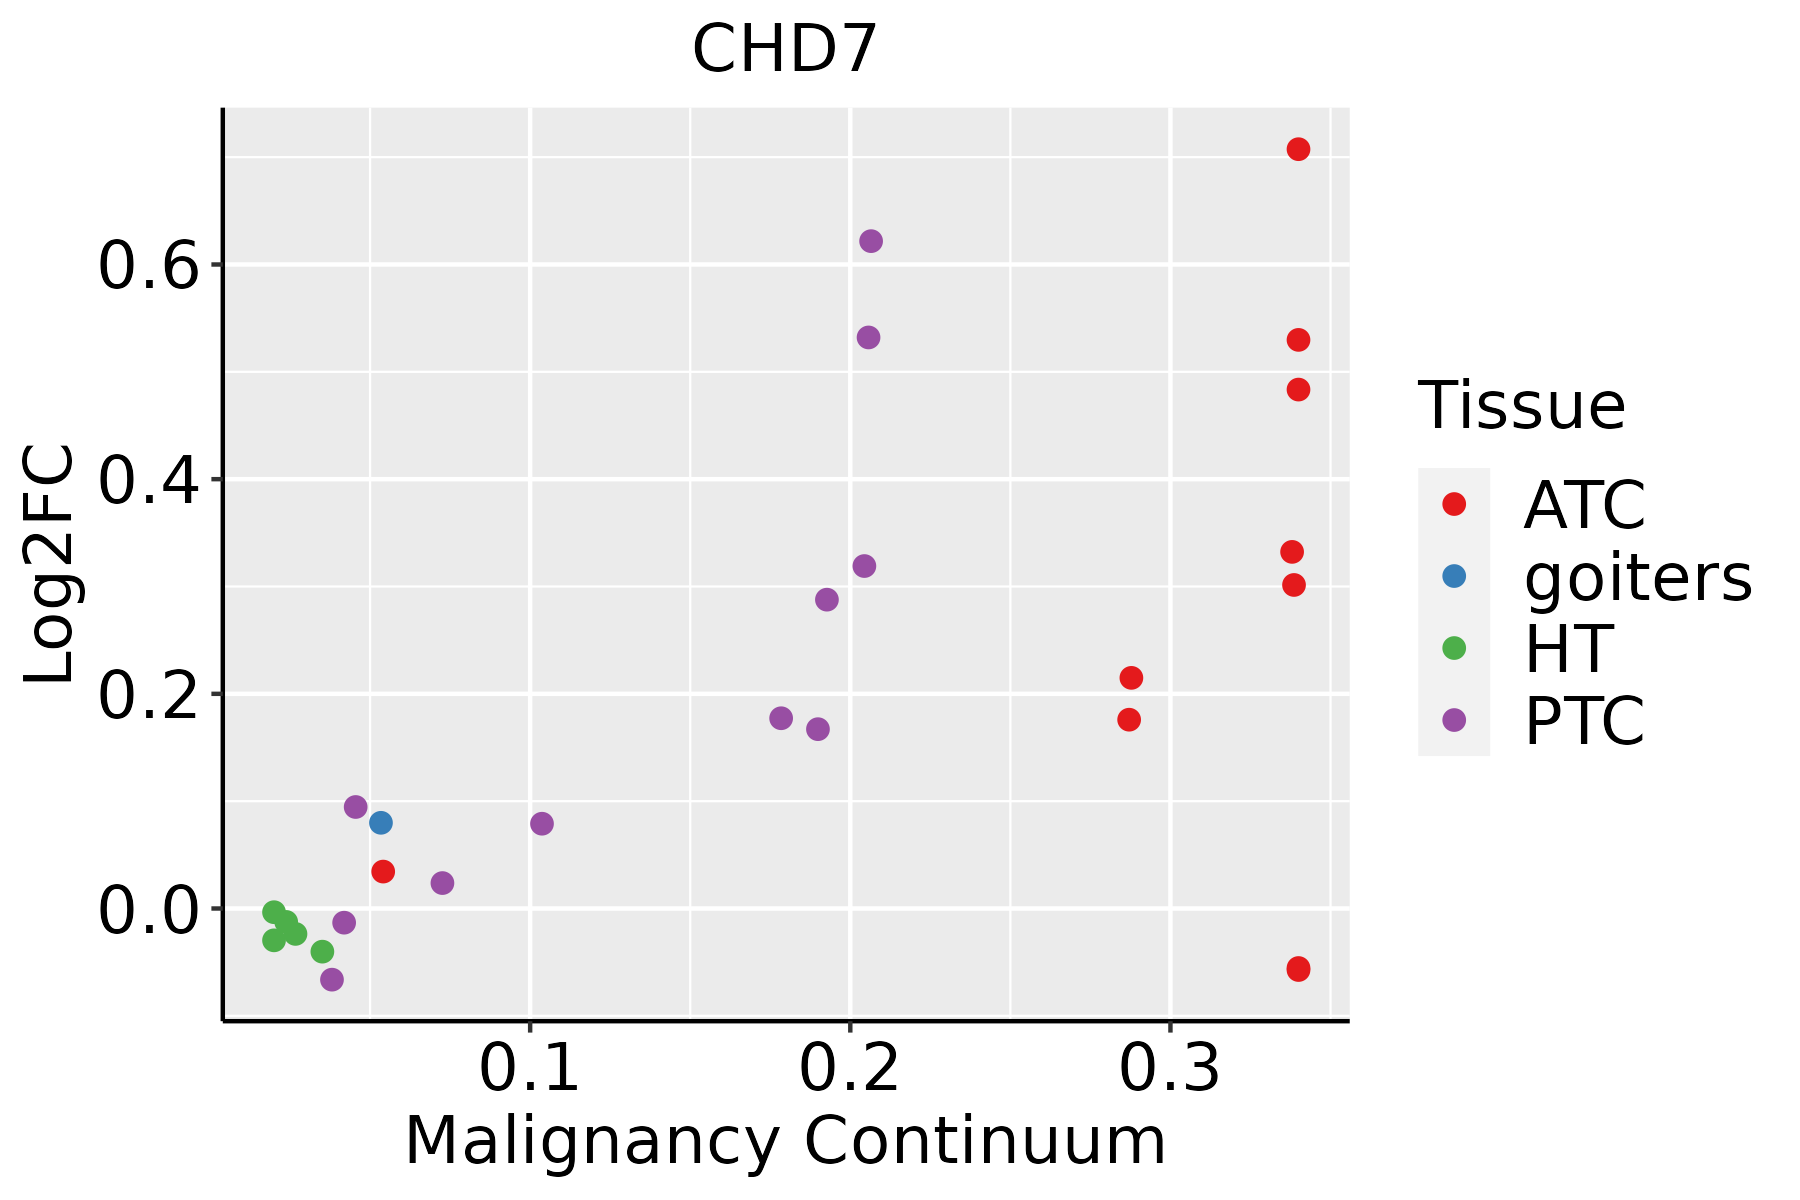 | ATC: Anaplastic thyroid cancer |
| HT: Hashimoto's thyroiditis | ||
| PTC: Papillary thyroid cancer |
| ∗log2FC in expression of this searched gene in stem-like cells from each diseased tissue sample relative to stem-like cells in normal samples in each tissue plotted against the malignancy continuum. Samples are colored based on if they are from different disease stage. |
Top |
Malignant transformation related pathway analysis |
| Find out the enriched GO biological processes and KEGG pathways involved in transition from healthy to precancer to cancer |
| Tissue | Disease Stage | Enriched GO biological Processes |
| Colorectum | AD |  |
| Colorectum | SER |  |
| Colorectum | MSS |  |
| Colorectum | MSI-H |  |
| Colorectum | FAP |  |
| ∗Top 15 enriched GO BP terms are showed in the bar plot of each disease state in each tissue. Each row represents a significant GO biological process which is colored according to the -log10(p.adjust). |
| Page: 1 2 3 4 5 6 7 8 9 |
| GO ID | Tissue | Disease Stage | Description | Gene Ratio | Bg Ratio | pvalue | p.adjust | Count |
| GO:0048608 | Colorectum | AD | reproductive structure development | 114/3918 | 424/18723 | 1.78e-03 | 1.47e-02 | 114 |
| GO:0042254 | Colorectum | AD | ribosome biogenesis | 84/3918 | 299/18723 | 1.82e-03 | 1.50e-02 | 84 |
| GO:0090087 | Colorectum | AD | regulation of peptide transport | 60/3918 | 202/18723 | 1.94e-03 | 1.58e-02 | 60 |
| GO:0032392 | Colorectum | AD | DNA geometric change | 31/3918 | 90/18723 | 2.02e-03 | 1.63e-02 | 31 |
| GO:0050767 | Colorectum | AD | regulation of neurogenesis | 99/3918 | 364/18723 | 2.35e-03 | 1.82e-02 | 99 |
| GO:0030072 | Colorectum | AD | peptide hormone secretion | 68/3918 | 236/18723 | 2.39e-03 | 1.85e-02 | 68 |
| GO:0002791 | Colorectum | AD | regulation of peptide secretion | 59/3918 | 200/18723 | 2.50e-03 | 1.92e-02 | 59 |
| GO:0090276 | Colorectum | AD | regulation of peptide hormone secretion | 58/3918 | 196/18723 | 2.51e-03 | 1.92e-02 | 58 |
| GO:0002790 | Colorectum | AD | peptide secretion | 69/3918 | 242/18723 | 2.97e-03 | 2.22e-02 | 69 |
| GO:0048639 | Colorectum | AD | positive regulation of developmental growth | 52/3918 | 174/18723 | 3.24e-03 | 2.38e-02 | 52 |
| GO:0042886 | Colorectum | AD | amide transport | 83/3918 | 301/18723 | 3.37e-03 | 2.46e-02 | 83 |
| GO:0048736 | Colorectum | AD | appendage development | 51/3918 | 172/18723 | 4.20e-03 | 2.89e-02 | 51 |
| GO:0060173 | Colorectum | AD | limb development | 51/3918 | 172/18723 | 4.20e-03 | 2.89e-02 | 51 |
| GO:0048568 | Colorectum | AD | embryonic organ development | 112/3918 | 427/18723 | 4.60e-03 | 3.14e-02 | 112 |
| GO:0051651 | Colorectum | AD | maintenance of location in cell | 61/3918 | 214/18723 | 5.02e-03 | 3.37e-02 | 61 |
| GO:0006338 | Colorectum | AD | chromatin remodeling | 70/3918 | 255/18723 | 7.44e-03 | 4.53e-02 | 70 |
| GO:00226131 | Colorectum | SER | ribonucleoprotein complex biogenesis | 112/2897 | 463/18723 | 5.01e-07 | 2.48e-05 | 112 |
| GO:00063251 | Colorectum | SER | chromatin organization | 89/2897 | 409/18723 | 4.15e-04 | 6.17e-03 | 89 |
| GO:00487361 | Colorectum | SER | appendage development | 42/2897 | 172/18723 | 1.43e-03 | 1.55e-02 | 42 |
| GO:00601731 | Colorectum | SER | limb development | 42/2897 | 172/18723 | 1.43e-03 | 1.55e-02 | 42 |
| Page: 1 2 3 4 5 6 7 8 9 10 11 12 13 14 15 16 17 18 19 20 21 22 |
| Pathway ID | Tissue | Disease Stage | Description | Gene Ratio | Bg Ratio | pvalue | p.adjust | qvalue | Count |
| Page: 1 |
Top |
Cell-cell communication analysis |
| Identification of potential cell-cell interactions between two cell types and their ligand-receptor pairs for different disease states |
| Ligand | Receptor | LRpair | Pathway | Tissue | Disease Stage |
| Page: 1 |
Top |
Single-cell gene regulatory network inference analysis |
| Find out the significant the regulons (TFs) and the target genes of each regulon across cell types for different disease states |
| TF | Cell Type | Tissue | Disease Stage | Target Gene | RSS | Regulon Activity |
| ∗The dot plots of a searched regulon are shown for all cell subpopulations in each disease state of each tissue based on the regulon specific score inferred using pySCENIC and by calculating the average expression. |
| Page: 1 |
Top |
Somatic mutation of malignant transformation related genes |
| Annotation of somatic variants for genes involved in malignant transformation |
| Hugo Symbol | Variant Class | Variant Classification | dbSNP RS | HGVSc | HGVSp | HGVSp Short | SWISSPROT | BIOTYPE | SIFT | PolyPhen | Tumor Sample Barcode | Tissue | Histology | Sex | Age | Stage | Therapy Types | Drugs | Outcome |
| CHD7 | SNV | Missense_Mutation | novel | c.181N>G | p.Gln61Glu | p.Q61E | Q9P2D1 | protein_coding | deleterious_low_confidence(0.03) | benign(0.053) | TCGA-5L-AAT1-01 | Breast | breast invasive carcinoma | Female | <65 | III/IV | Hormone Therapy | letrozol | SD |
| CHD7 | SNV | Missense_Mutation | c.4660N>T | p.Asp1554Tyr | p.D1554Y | Q9P2D1 | protein_coding | deleterious(0) | possibly_damaging(0.825) | TCGA-A2-A04P-01 | Breast | breast invasive carcinoma | Female | <65 | III/IV | Chemotherapy | taxol | PD | |
| CHD7 | SNV | Missense_Mutation | c.8096T>A | p.Met2699Lys | p.M2699K | Q9P2D1 | protein_coding | tolerated(0.5) | possibly_damaging(0.888) | TCGA-A7-A13G-01 | Breast | breast invasive carcinoma | Female | >=65 | I/II | Hormone Therapy | arimidex | PD | |
| CHD7 | SNV | Missense_Mutation | c.6571G>C | p.Glu2191Gln | p.E2191Q | Q9P2D1 | protein_coding | tolerated(0.15) | benign(0.003) | TCGA-A7-A26H-01 | Breast | breast invasive carcinoma | Female | >=65 | I/II | Hormone Therapy | anastrozole | PD | |
| CHD7 | SNV | Missense_Mutation | c.7756N>T | p.Pro2586Ser | p.P2586S | Q9P2D1 | protein_coding | deleterious(0.02) | benign(0.026) | TCGA-A7-A26I-01 | Breast | breast invasive carcinoma | Female | >=65 | I/II | Chemotherapy | cytoxan | SD | |
| CHD7 | SNV | Missense_Mutation | novel | c.1537N>T | p.Thr513Ser | p.T513S | Q9P2D1 | protein_coding | tolerated_low_confidence(0.62) | benign(0) | TCGA-A7-A4SC-01 | Breast | breast invasive carcinoma | Female | <65 | I/II | Hormone Therapy | tamoxiphen | SD |
| CHD7 | SNV | Missense_Mutation | rs368609862 | c.5440N>A | p.Ala1814Thr | p.A1814T | Q9P2D1 | protein_coding | tolerated(0.22) | benign(0.009) | TCGA-A8-A091-01 | Breast | breast invasive carcinoma | Female | <65 | I/II | Chemotherapy | 5-fluorouracil | PD |
| CHD7 | SNV | Missense_Mutation | c.223N>C | p.Tyr75His | p.Y75H | Q9P2D1 | protein_coding | deleterious_low_confidence(0) | probably_damaging(0.987) | TCGA-A8-A09Z-01 | Breast | breast invasive carcinoma | Female | >=65 | I/II | Unknown | Unknown | SD | |
| CHD7 | SNV | Missense_Mutation | rs750047137 | c.6529N>A | p.Glu2177Lys | p.E2177K | Q9P2D1 | protein_coding | tolerated(0.45) | benign(0.003) | TCGA-AC-A23H-01 | Breast | breast invasive carcinoma | Female | >=65 | I/II | Unknown | Unknown | PD |
| CHD7 | SNV | Missense_Mutation | c.4611G>C | p.Lys1537Asn | p.K1537N | Q9P2D1 | protein_coding | deleterious(0.01) | probably_damaging(0.946) | TCGA-AN-A0G0-01 | Breast | breast invasive carcinoma | Female | <65 | I/II | Unknown | Unknown | SD |
| Page: 1 2 3 4 5 6 7 8 9 10 11 12 13 14 15 16 17 18 19 20 21 22 23 24 25 26 27 28 29 30 31 32 33 34 35 36 37 38 |
Top |
Related drugs of malignant transformation related genes |
| Identification of chemicals and drugs interact with genes involved in malignant transfromation |
| (DGIdb 4.0) |
| Entrez ID | Symbol | Category | Interaction Types | Drug Claim Name | Drug Name | PMIDs |
| Page: 1 |

Copyright 2023-Present -The University of Texas Health Science Center at Houston |