
|
|||||
|
 | |
| |
| |
| |
| |
| |
|
Gene: CDT1 |
Gene summary for CDT1 |
| Gene information | Species | Human | Gene symbol | CDT1 | Gene ID | 81620 |
| Gene name | chromatin licensing and DNA replication factor 1 | |
| Gene Alias | DUP | |
| Cytomap | 16q24.3 | |
| Gene Type | protein-coding | GO ID | GO:0000070 | UniProtAcc | Q9H211 |
Top |
Malignant transformation analysis |
| Identification of the aberrant gene expression in precancerous and cancerous lesions by comparing the gene expression of stem-like cells in diseased tissues with normal stem cells |
| Entrez ID | Symbol | Replicates | Species | Organ | Tissue | Adj P-value | Log2FC | Malignancy |
| 81620 | CDT1 | P1T-E | Human | Esophagus | ESCC | 9.99e-03 | 3.60e-01 | 0.0875 |
| 81620 | CDT1 | P2T-E | Human | Esophagus | ESCC | 3.24e-19 | 6.20e-01 | 0.1177 |
| 81620 | CDT1 | P4T-E | Human | Esophagus | ESCC | 1.83e-16 | 5.22e-01 | 0.1323 |
| 81620 | CDT1 | P5T-E | Human | Esophagus | ESCC | 1.73e-35 | 7.31e-01 | 0.1327 |
| 81620 | CDT1 | P8T-E | Human | Esophagus | ESCC | 1.21e-20 | 5.12e-01 | 0.0889 |
| 81620 | CDT1 | P10T-E | Human | Esophagus | ESCC | 2.57e-02 | 9.82e-02 | 0.116 |
| 81620 | CDT1 | P12T-E | Human | Esophagus | ESCC | 7.00e-03 | 1.58e-01 | 0.1122 |
| 81620 | CDT1 | P15T-E | Human | Esophagus | ESCC | 7.75e-12 | 4.68e-01 | 0.1149 |
| 81620 | CDT1 | P16T-E | Human | Esophagus | ESCC | 3.39e-05 | 2.49e-01 | 0.1153 |
| 81620 | CDT1 | P17T-E | Human | Esophagus | ESCC | 1.39e-07 | 6.93e-01 | 0.1278 |
| 81620 | CDT1 | P21T-E | Human | Esophagus | ESCC | 5.55e-07 | 2.02e-01 | 0.1617 |
| 81620 | CDT1 | P22T-E | Human | Esophagus | ESCC | 2.80e-07 | 2.81e-01 | 0.1236 |
| 81620 | CDT1 | P23T-E | Human | Esophagus | ESCC | 1.00e-07 | 4.10e-01 | 0.108 |
| 81620 | CDT1 | P24T-E | Human | Esophagus | ESCC | 4.01e-18 | 5.36e-01 | 0.1287 |
| 81620 | CDT1 | P26T-E | Human | Esophagus | ESCC | 1.60e-10 | 4.31e-01 | 0.1276 |
| 81620 | CDT1 | P27T-E | Human | Esophagus | ESCC | 3.93e-06 | 1.94e-01 | 0.1055 |
| 81620 | CDT1 | P28T-E | Human | Esophagus | ESCC | 3.86e-18 | 4.65e-01 | 0.1149 |
| 81620 | CDT1 | P31T-E | Human | Esophagus | ESCC | 1.41e-30 | 8.94e-01 | 0.1251 |
| 81620 | CDT1 | P32T-E | Human | Esophagus | ESCC | 1.94e-21 | 4.73e-01 | 0.1666 |
| 81620 | CDT1 | P37T-E | Human | Esophagus | ESCC | 2.77e-07 | 3.34e-01 | 0.1371 |
| Page: 1 2 3 4 |
| Tissue | Expression Dynamics | Abbreviation |
| Esophagus | 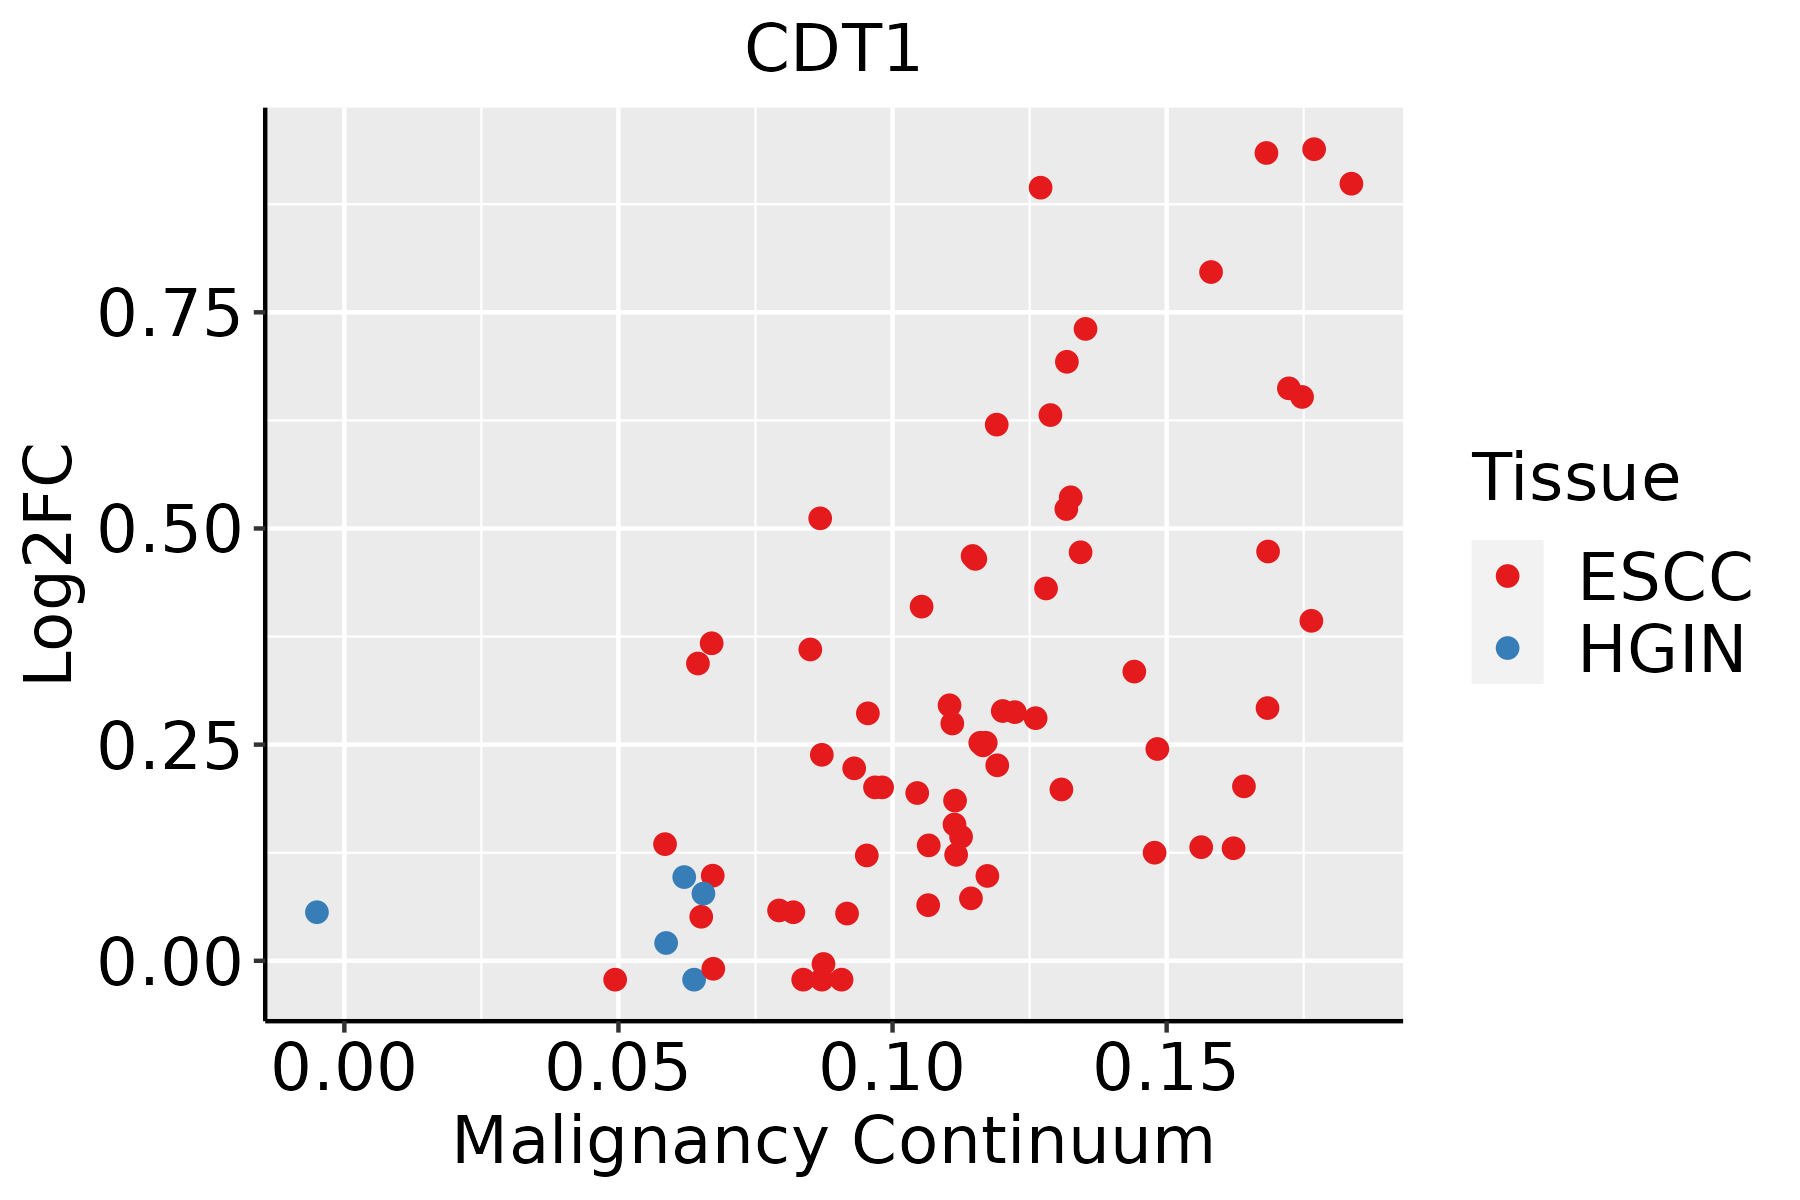 | ESCC: Esophageal squamous cell carcinoma |
| HGIN: High-grade intraepithelial neoplasias | ||
| LGIN: Low-grade intraepithelial neoplasias | ||
| Liver | 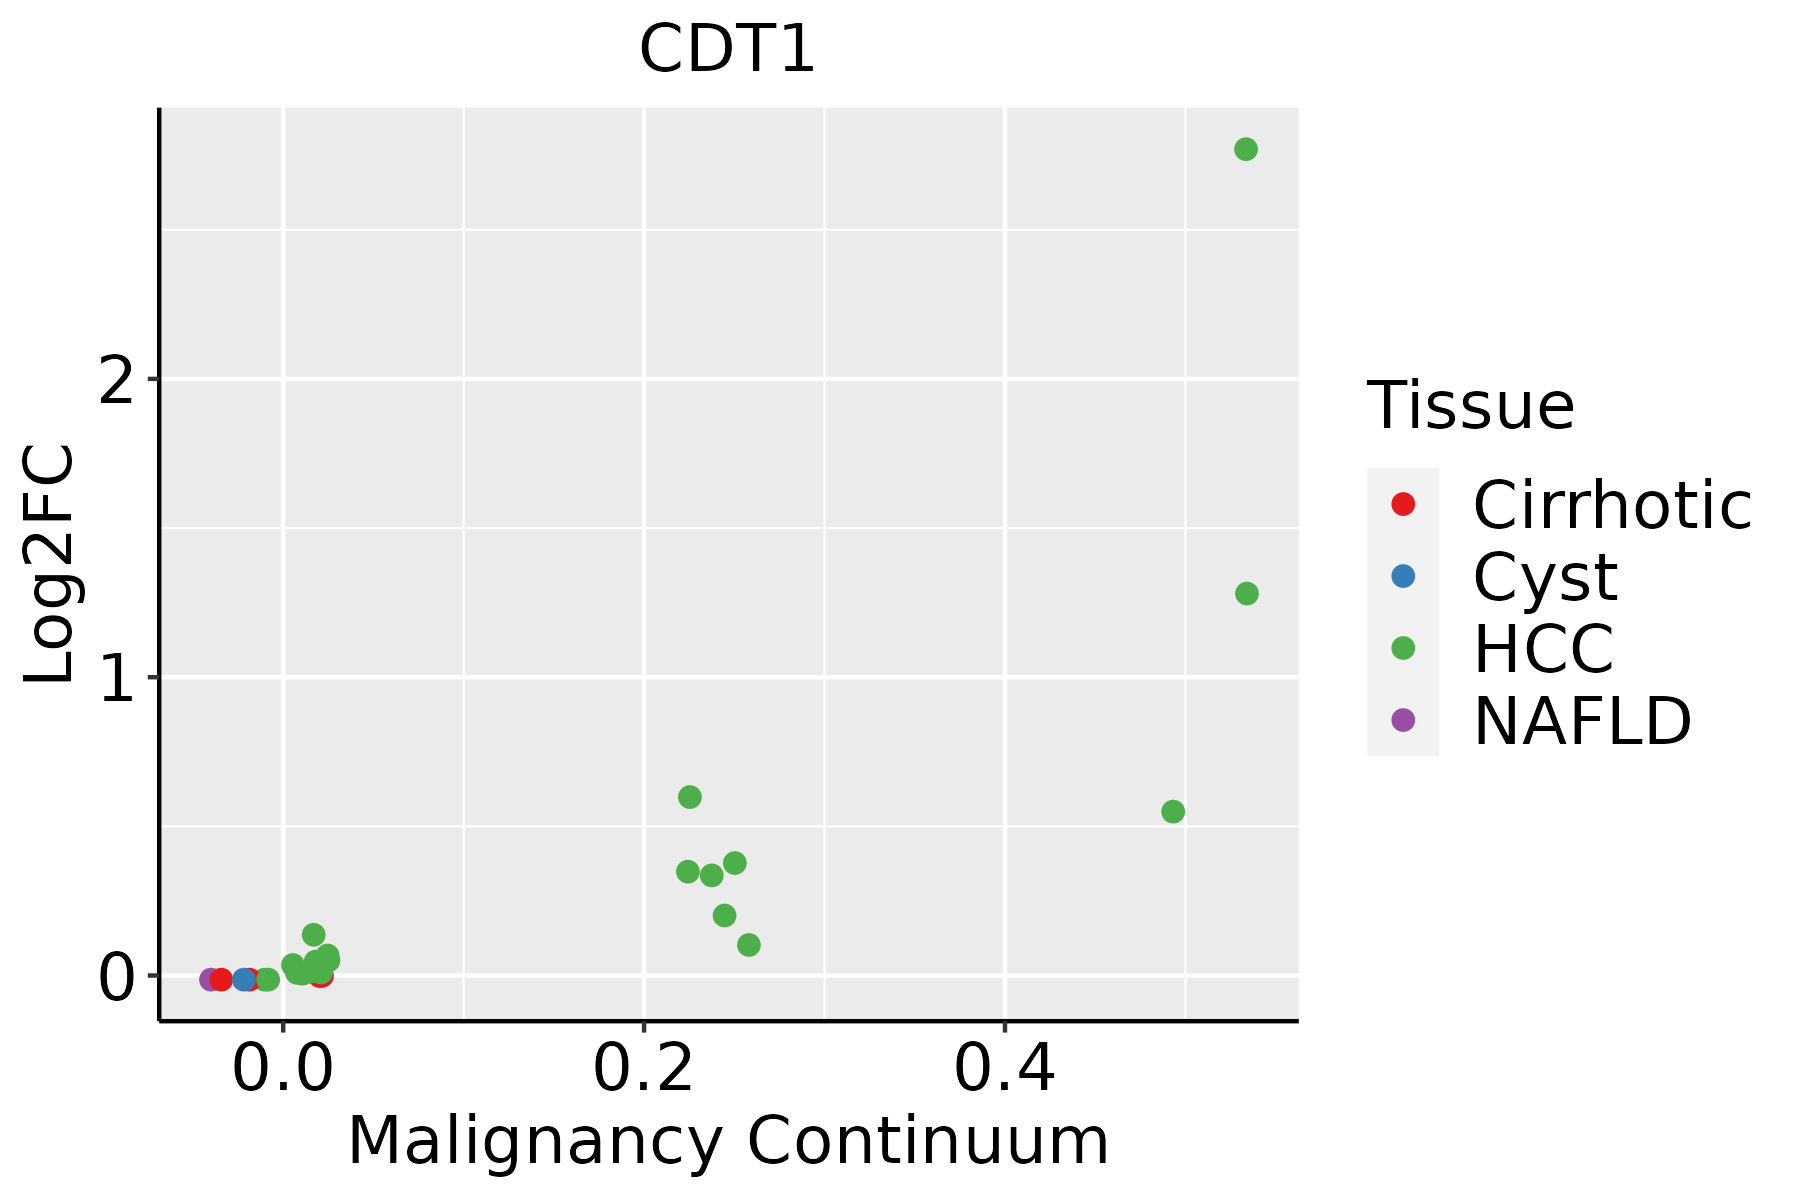 | HCC: Hepatocellular carcinoma |
| NAFLD: Non-alcoholic fatty liver disease | ||
| Oral Cavity | 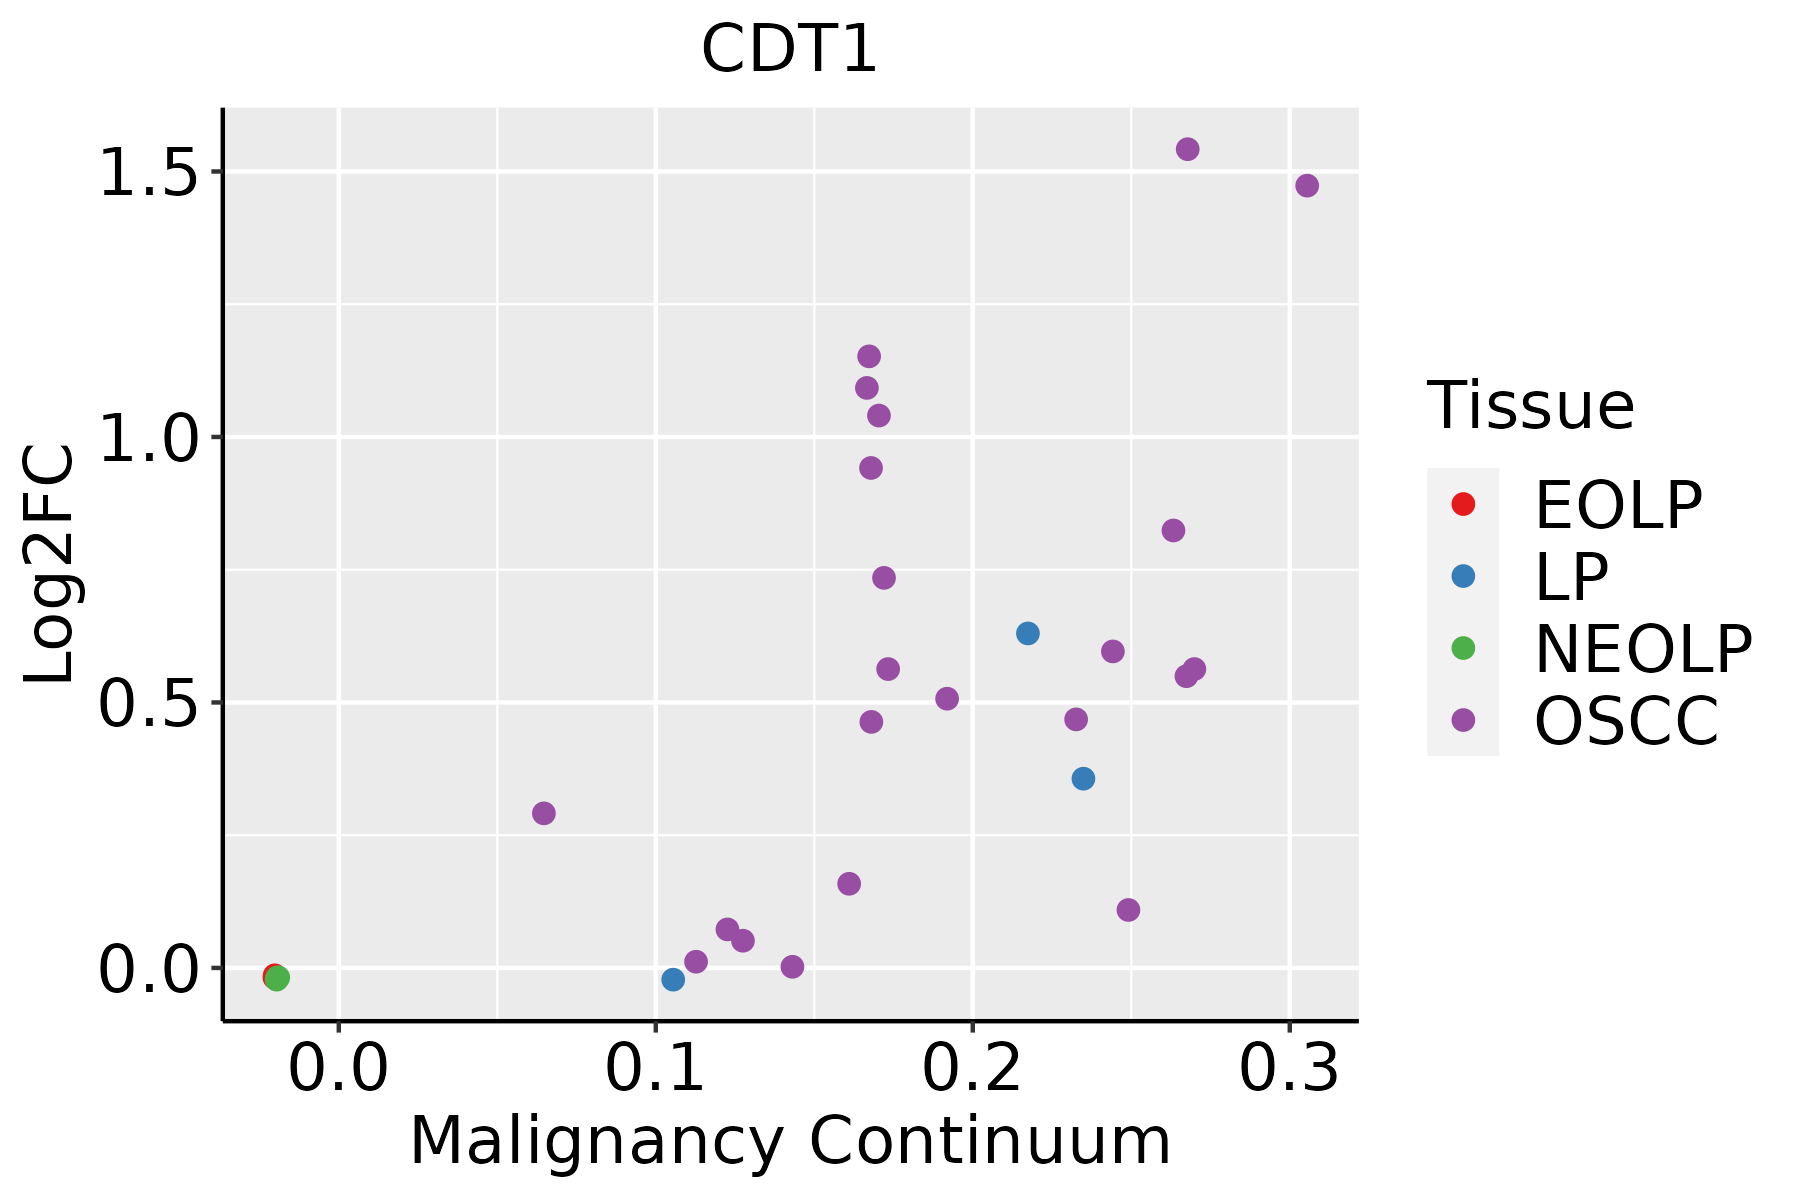 | EOLP: Erosive Oral lichen planus |
| LP: leukoplakia | ||
| NEOLP: Non-erosive oral lichen planus | ||
| OSCC: Oral squamous cell carcinoma |
| ∗log2FC in expression of this searched gene in stem-like cells from each diseased tissue sample relative to stem-like cells in normal samples in each tissue plotted against the malignancy continuum. Samples are colored based on if they are from different disease stage. |
Top |
Malignant transformation related pathway analysis |
| Find out the enriched GO biological processes and KEGG pathways involved in transition from healthy to precancer to cancer |
| Tissue | Disease Stage | Enriched GO biological Processes |
| Colorectum | AD |  |
| Colorectum | SER |  |
| Colorectum | MSS |  |
| Colorectum | MSI-H |  |
| Colorectum | FAP |  |
| ∗Top 15 enriched GO BP terms are showed in the bar plot of each disease state in each tissue. Each row represents a significant GO biological process which is colored according to the -log10(p.adjust). |
| Page: 1 2 3 4 5 6 7 8 9 |
| GO ID | Tissue | Disease Stage | Description | Gene Ratio | Bg Ratio | pvalue | p.adjust | Count |
| GO:00447842 | Esophagus | ESCC | metaphase/anaphase transition of cell cycle | 50/8552 | 65/18723 | 2.67e-07 | 3.97e-06 | 50 |
| GO:004593116 | Esophagus | ESCC | positive regulation of mitotic cell cycle | 83/8552 | 121/18723 | 2.78e-07 | 4.08e-06 | 83 |
| GO:00109484 | Esophagus | ESCC | negative regulation of cell cycle process | 177/8552 | 294/18723 | 3.26e-07 | 4.59e-06 | 177 |
| GO:19058182 | Esophagus | ESCC | regulation of chromosome separation | 54/8552 | 72/18723 | 3.85e-07 | 5.32e-06 | 54 |
| GO:19020992 | Esophagus | ESCC | regulation of metaphase/anaphase transition of cell cycle | 48/8552 | 63/18723 | 7.67e-07 | 9.95e-06 | 48 |
| GO:00315705 | Esophagus | ESCC | DNA integrity checkpoint | 83/8552 | 123/18723 | 8.17e-07 | 1.06e-05 | 83 |
| GO:19019883 | Esophagus | ESCC | negative regulation of cell cycle phase transition | 151/8552 | 249/18723 | 1.28e-06 | 1.57e-05 | 151 |
| GO:004593013 | Esophagus | ESCC | negative regulation of mitotic cell cycle | 143/8552 | 235/18723 | 1.84e-06 | 2.15e-05 | 143 |
| GO:00062754 | Esophagus | ESCC | regulation of DNA replication | 73/8552 | 107/18723 | 1.97e-06 | 2.28e-05 | 73 |
| GO:19019896 | Esophagus | ESCC | positive regulation of cell cycle phase transition | 77/8552 | 115/18723 | 3.20e-06 | 3.58e-05 | 77 |
| GO:190199113 | Esophagus | ESCC | negative regulation of mitotic cell cycle phase transition | 112/8552 | 179/18723 | 3.69e-06 | 4.03e-05 | 112 |
| GO:00517831 | Esophagus | ESCC | regulation of nuclear division | 90/8552 | 139/18723 | 4.30e-06 | 4.60e-05 | 90 |
| GO:00900689 | Esophagus | ESCC | positive regulation of cell cycle process | 142/8552 | 236/18723 | 4.79e-06 | 5.08e-05 | 142 |
| GO:20012513 | Esophagus | ESCC | negative regulation of chromosome organization | 60/8552 | 86/18723 | 5.20e-06 | 5.45e-05 | 60 |
| GO:00513831 | Esophagus | ESCC | kinetochore organization | 21/8552 | 23/18723 | 5.69e-06 | 5.90e-05 | 21 |
| GO:00086081 | Esophagus | ESCC | attachment of spindle microtubules to kinetochore | 29/8552 | 35/18723 | 6.61e-06 | 6.75e-05 | 29 |
| GO:00513151 | Esophagus | ESCC | attachment of mitotic spindle microtubules to kinetochore | 15/8552 | 15/18723 | 7.81e-06 | 7.69e-05 | 15 |
| GO:00458393 | Esophagus | ESCC | negative regulation of mitotic nuclear division | 37/8552 | 48/18723 | 8.99e-06 | 8.65e-05 | 37 |
| GO:19038289 | Esophagus | ESCC | negative regulation of cellular protein localization | 76/8552 | 117/18723 | 1.97e-05 | 1.72e-04 | 76 |
| GO:00513042 | Esophagus | ESCC | chromosome separation | 64/8552 | 96/18723 | 2.61e-05 | 2.20e-04 | 64 |
| Page: 1 2 3 4 5 6 7 8 9 10 11 12 13 |
| Pathway ID | Tissue | Disease Stage | Description | Gene Ratio | Bg Ratio | pvalue | p.adjust | qvalue | Count |
| hsa0411023 | Esophagus | ESCC | Cell cycle | 126/4205 | 157/8465 | 1.34e-15 | 5.60e-14 | 2.87e-14 | 126 |
| hsa0411033 | Esophagus | ESCC | Cell cycle | 126/4205 | 157/8465 | 1.34e-15 | 5.60e-14 | 2.87e-14 | 126 |
| hsa041102 | Liver | HCC | Cell cycle | 106/4020 | 157/8465 | 2.54e-07 | 3.04e-06 | 1.69e-06 | 106 |
| hsa041103 | Liver | HCC | Cell cycle | 106/4020 | 157/8465 | 2.54e-07 | 3.04e-06 | 1.69e-06 | 106 |
| hsa041108 | Oral cavity | OSCC | Cell cycle | 118/3704 | 157/8465 | 7.15e-16 | 2.66e-14 | 1.35e-14 | 118 |
| hsa0411015 | Oral cavity | OSCC | Cell cycle | 118/3704 | 157/8465 | 7.15e-16 | 2.66e-14 | 1.35e-14 | 118 |
| Page: 1 |
Top |
Cell-cell communication analysis |
| Identification of potential cell-cell interactions between two cell types and their ligand-receptor pairs for different disease states |
| Ligand | Receptor | LRpair | Pathway | Tissue | Disease Stage |
| Page: 1 |
Top |
Single-cell gene regulatory network inference analysis |
| Find out the significant the regulons (TFs) and the target genes of each regulon across cell types for different disease states |
| TF | Cell Type | Tissue | Disease Stage | Target Gene | RSS | Regulon Activity |
| ∗The dot plots of a searched regulon are shown for all cell subpopulations in each disease state of each tissue based on the regulon specific score inferred using pySCENIC and by calculating the average expression. |
| Page: 1 |
Top |
Somatic mutation of malignant transformation related genes |
| Annotation of somatic variants for genes involved in malignant transformation |
| Hugo Symbol | Variant Class | Variant Classification | dbSNP RS | HGVSc | HGVSp | HGVSp Short | SWISSPROT | BIOTYPE | SIFT | PolyPhen | Tumor Sample Barcode | Tissue | Histology | Sex | Age | Stage | Therapy Types | Drugs | Outcome |
| CDT1 | SNV | Missense_Mutation | c.545C>A | p.Pro182Gln | p.P182Q | Q9H211 | protein_coding | deleterious(0) | probably_damaging(0.989) | TCGA-BH-A18G-01 | Breast | breast invasive carcinoma | Female | >=65 | I/II | Unknown | Unknown | SD | |
| CDT1 | SNV | Missense_Mutation | novel | c.1018G>T | p.Val340Leu | p.V340L | Q9H211 | protein_coding | deleterious(0) | probably_damaging(0.977) | TCGA-E2-A574-01 | Breast | breast invasive carcinoma | Female | <65 | I/II | Chemotherapy | adriamycin | SD |
| CDT1 | SNV | Missense_Mutation | novel | c.468G>T | p.Glu156Asp | p.E156D | Q9H211 | protein_coding | tolerated(0.13) | benign(0.007) | TCGA-2W-A8YY-01 | Cervix | cervical & endocervical cancer | Female | <65 | I/II | Chemotherapy | cisplatin | CR |
| CDT1 | SNV | Missense_Mutation | novel | c.466N>A | p.Glu156Lys | p.E156K | Q9H211 | protein_coding | tolerated(0.35) | benign(0.007) | TCGA-JW-A5VL-01 | Cervix | cervical & endocervical cancer | Female | <65 | I/II | Unknown | Unknown | SD |
| CDT1 | SNV | Missense_Mutation | novel | c.466G>A | p.Glu156Lys | p.E156K | Q9H211 | protein_coding | tolerated(0.35) | benign(0.007) | TCGA-Q1-A73O-01 | Cervix | cervical & endocervical cancer | Female | <65 | I/II | Chemotherapy | cisplatin | CR |
| CDT1 | SNV | Missense_Mutation | novel | c.641C>A | p.Pro214His | p.P214H | Q9H211 | protein_coding | deleterious(0) | possibly_damaging(0.882) | TCGA-5M-AAT6-01 | Colorectum | colon adenocarcinoma | Female | <65 | III/IV | Unknown | Unknown | PD |
| CDT1 | SNV | Missense_Mutation | c.1621C>T | p.Arg541Cys | p.R541C | Q9H211 | protein_coding | deleterious(0.02) | possibly_damaging(0.676) | TCGA-AD-6895-01 | Colorectum | colon adenocarcinoma | Male | >=65 | III/IV | Unknown | Unknown | SD | |
| CDT1 | SNV | Missense_Mutation | novel | c.310N>A | p.Ala104Thr | p.A104T | Q9H211 | protein_coding | tolerated(0.32) | benign(0.039) | TCGA-AP-A0LS-01 | Endometrium | uterine corpus endometrioid carcinoma | Female | <65 | I/II | Unknown | Unknown | SD |
| CDT1 | SNV | Missense_Mutation | novel | c.1118C>T | p.Pro373Leu | p.P373L | Q9H211 | protein_coding | deleterious(0) | probably_damaging(0.948) | TCGA-AP-A1DK-01 | Endometrium | uterine corpus endometrioid carcinoma | Female | <65 | I/II | Unknown | Unknown | SD |
| CDT1 | SNV | Missense_Mutation | novel | c.1065G>T | p.Glu355Asp | p.E355D | Q9H211 | protein_coding | tolerated(0.47) | benign(0.07) | TCGA-AP-A1DV-01 | Endometrium | uterine corpus endometrioid carcinoma | Female | <65 | I/II | Unknown | Unknown | SD |
| Page: 1 2 3 4 5 |
Top |
Related drugs of malignant transformation related genes |
| Identification of chemicals and drugs interact with genes involved in malignant transfromation |
| (DGIdb 4.0) |
| Entrez ID | Symbol | Category | Interaction Types | Drug Claim Name | Drug Name | PMIDs |
| Page: 1 |

Copyright 2023-Present -The University of Texas Health Science Center at Houston |