| Tissue | Expression Dynamics | Abbreviation |
| Colorectum (GSE201348) |  | FAP: Familial adenomatous polyposis |
| CRC: Colorectal cancer |
| Colorectum (HTA11) | 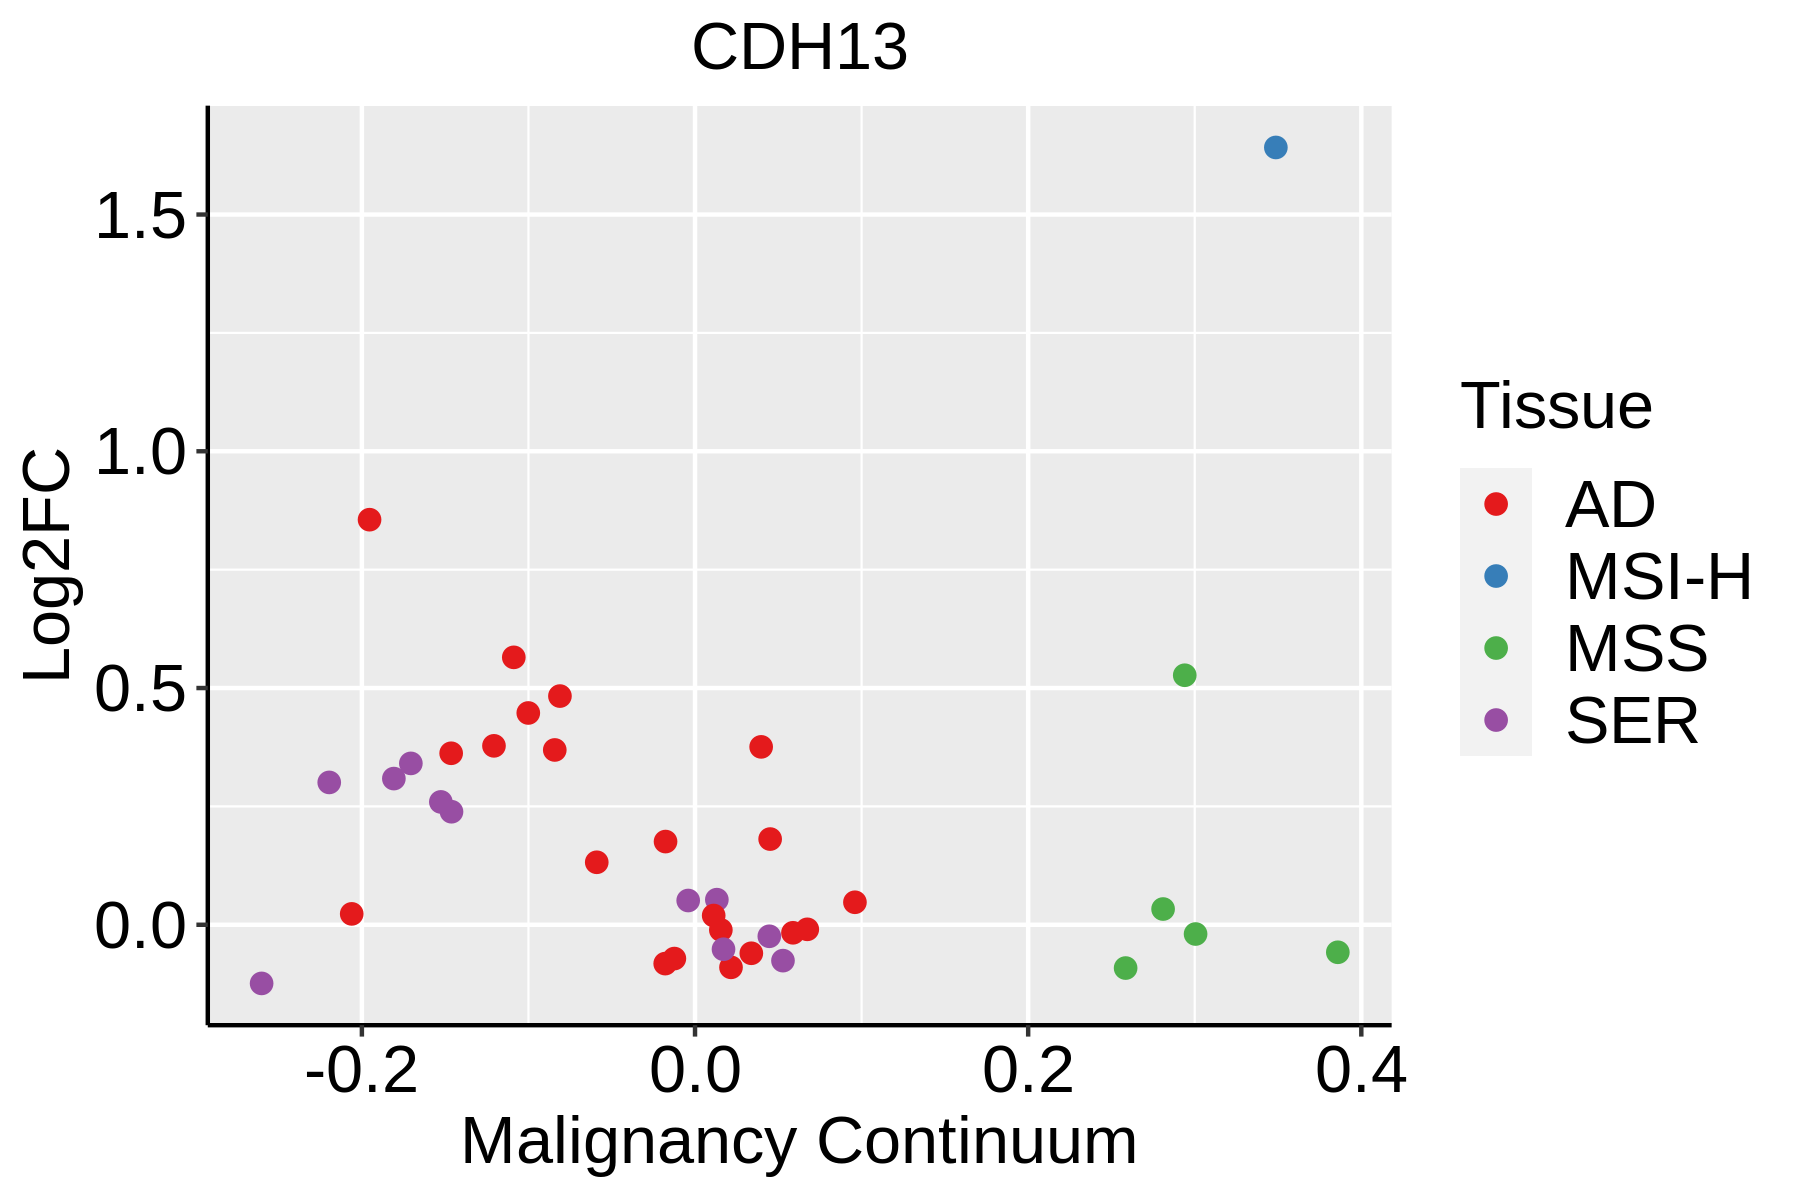 | AD: Adenomas |
| SER: Sessile serrated lesions |
| MSI-H: Microsatellite-high colorectal cancer |
| MSS: Microsatellite stable colorectal cancer |
| Esophagus | 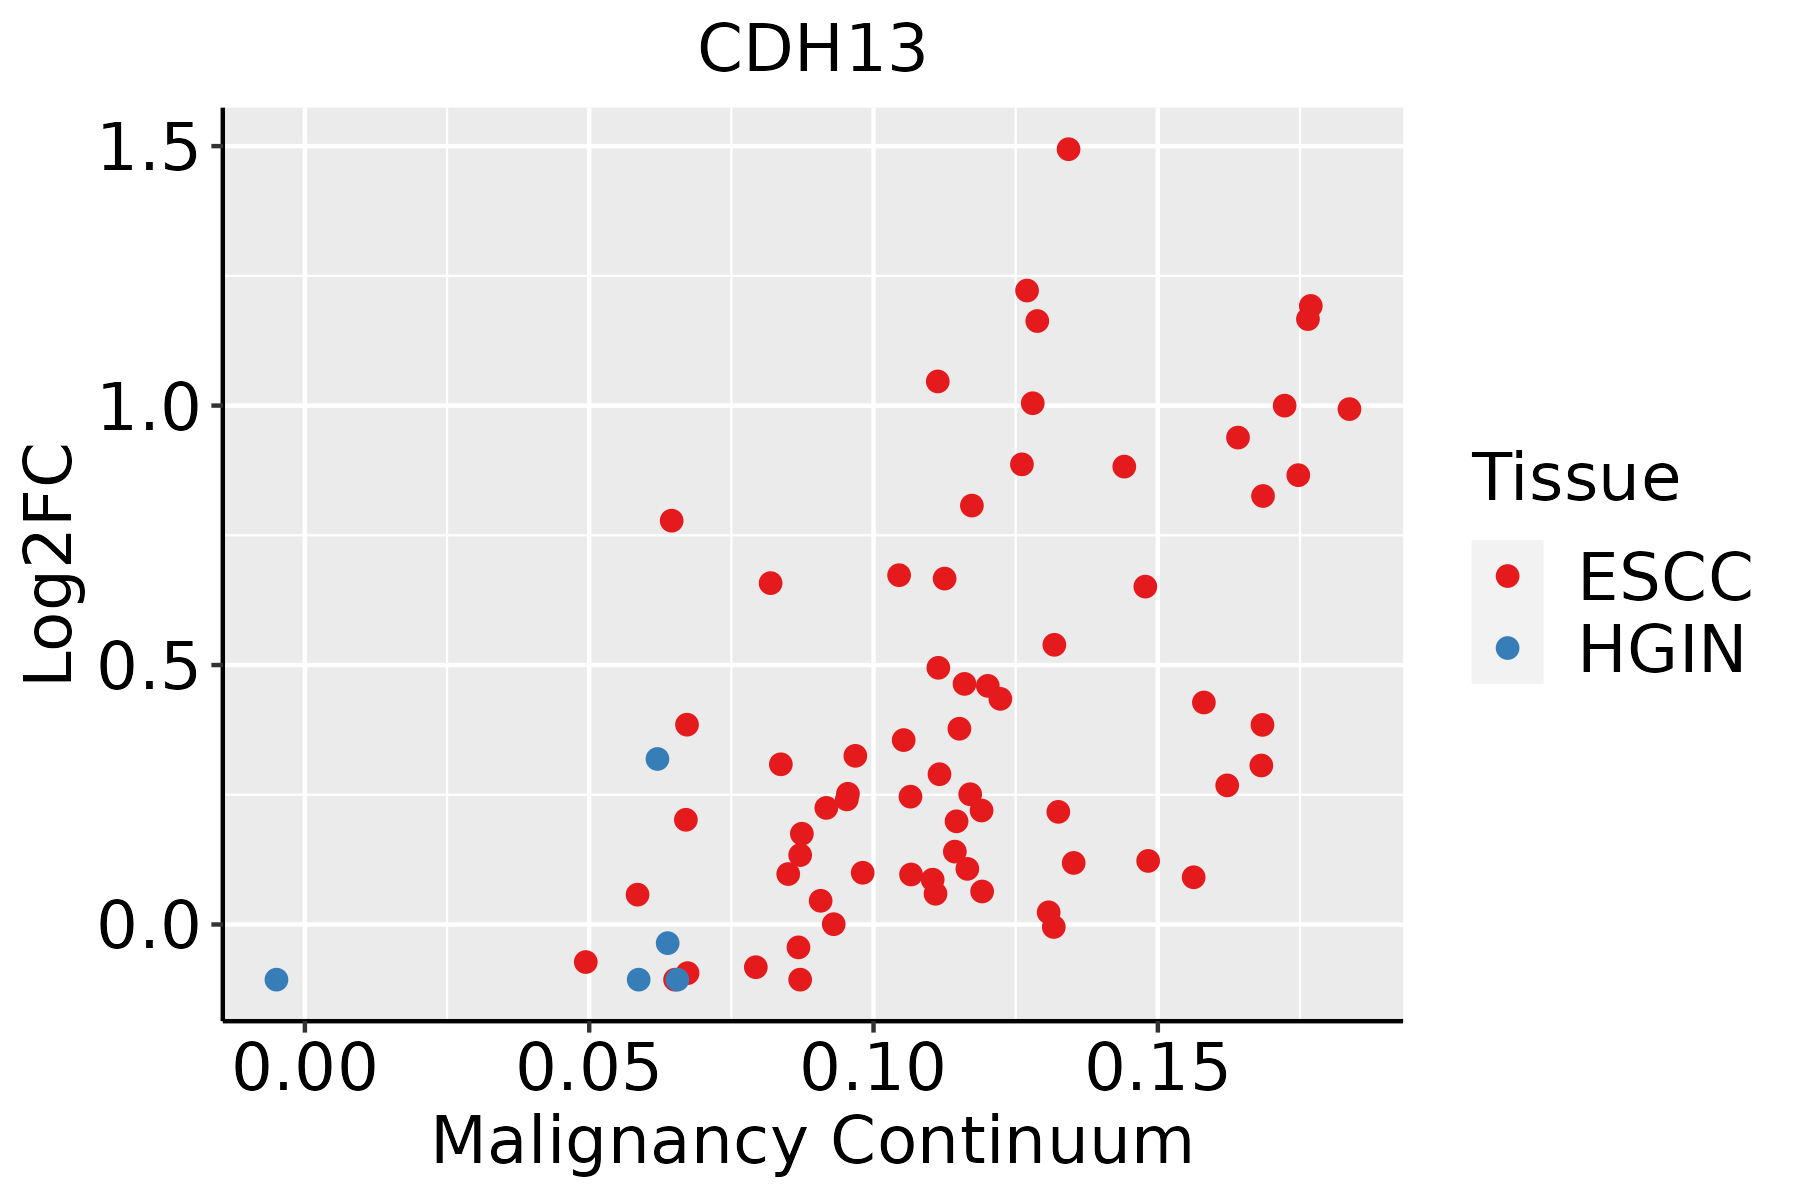 | ESCC: Esophageal squamous cell carcinoma |
| HGIN: High-grade intraepithelial neoplasias |
| LGIN: Low-grade intraepithelial neoplasias |
| Oral Cavity |  | EOLP: Erosive Oral lichen planus |
| LP: leukoplakia |
| NEOLP: Non-erosive oral lichen planus |
| OSCC: Oral squamous cell carcinoma |
| Skin | 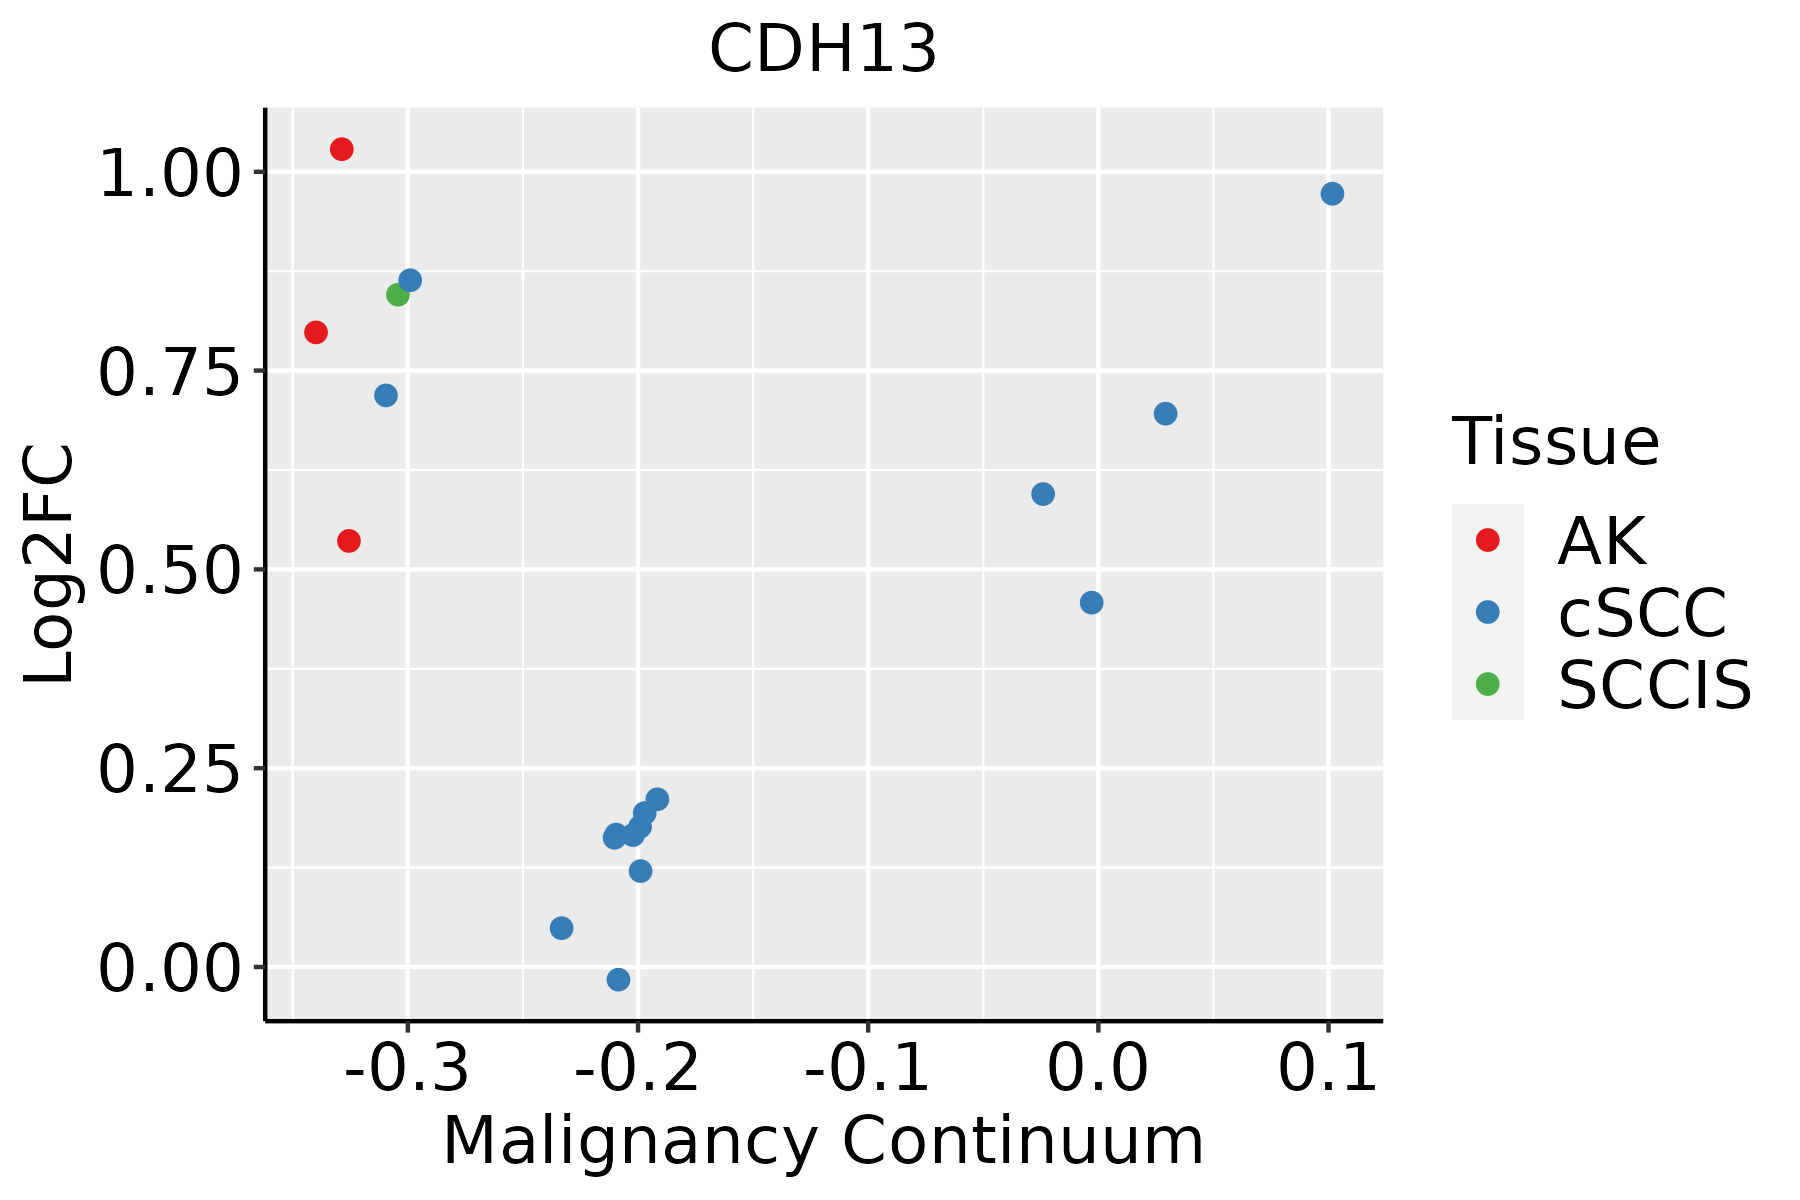 | AK: Actinic keratosis |
| cSCC: Cutaneous squamous cell carcinoma |
| SCCIS:squamous cell carcinoma in situ |
| Thyroid | 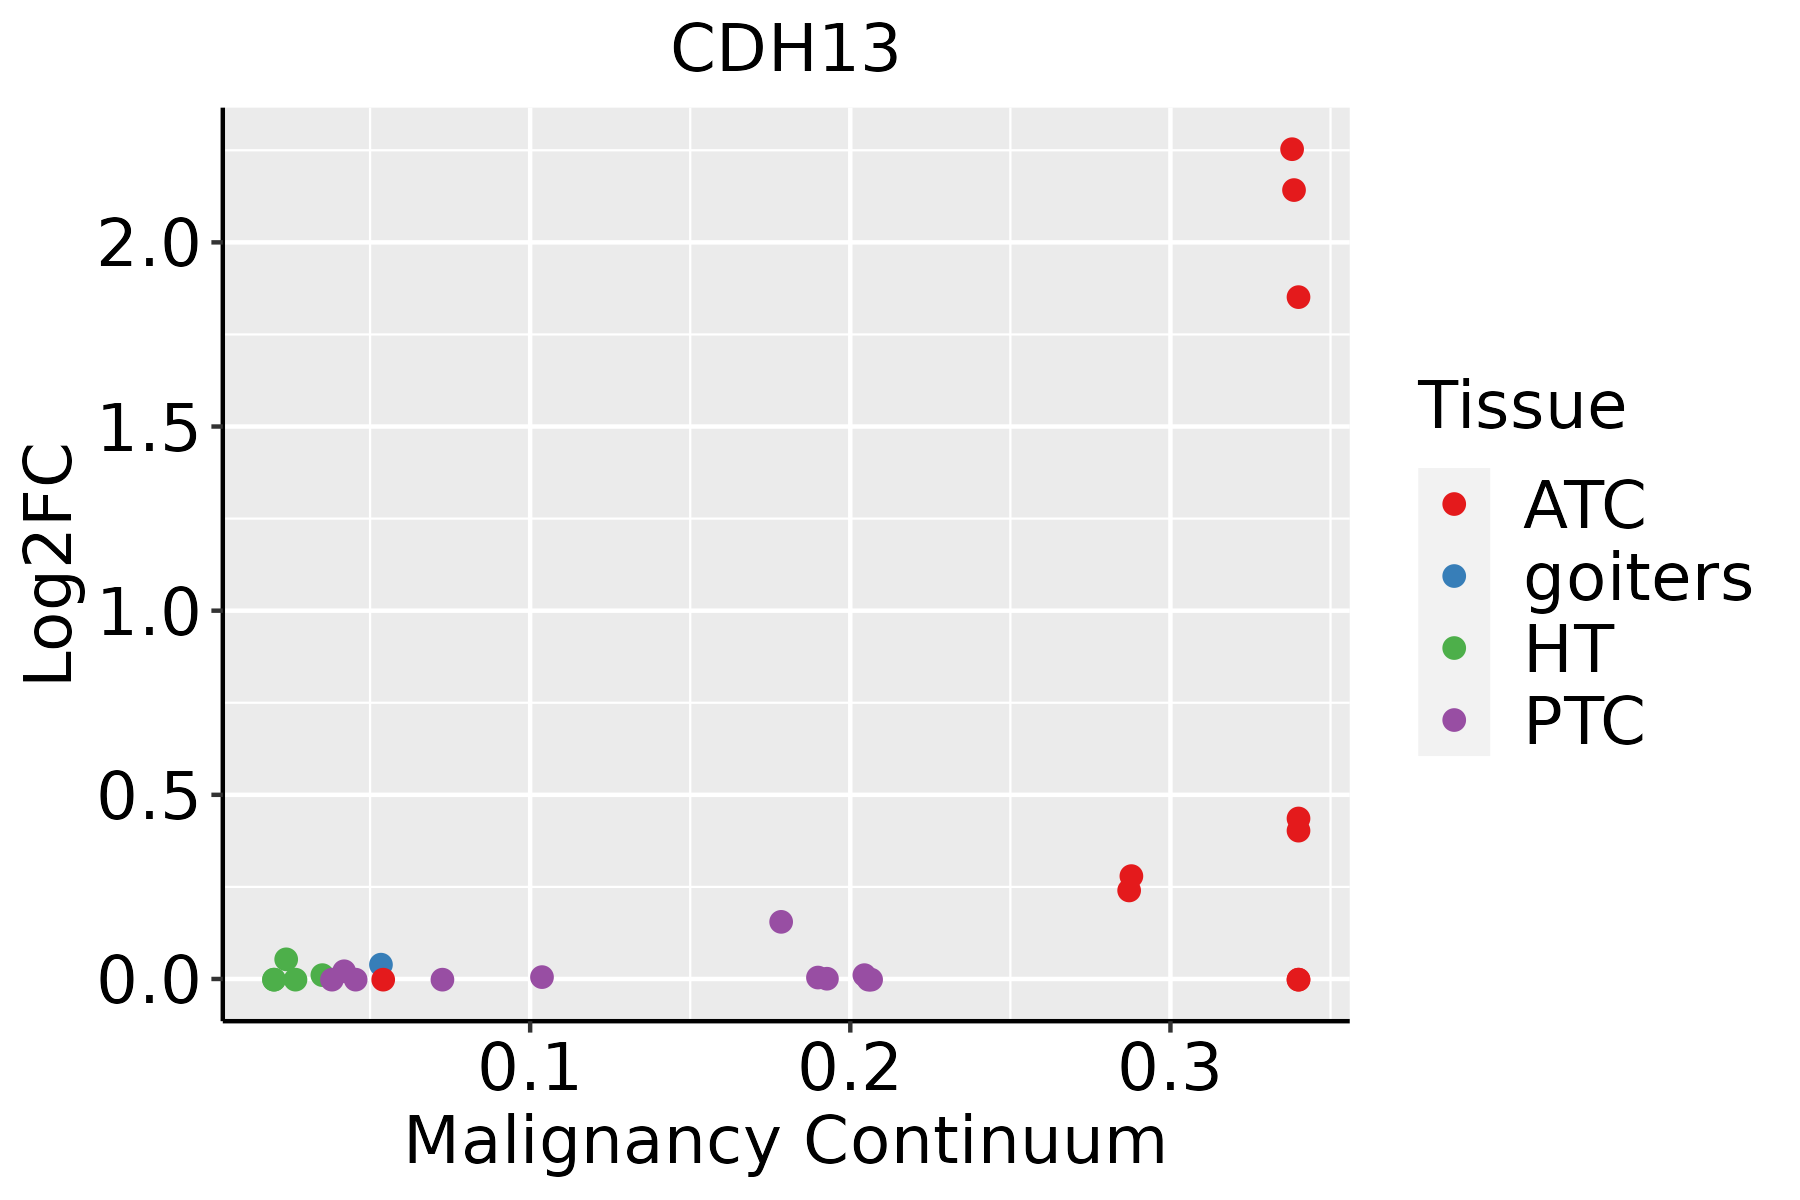 | ATC: Anaplastic thyroid cancer |
| HT: Hashimoto's thyroiditis |
| PTC: Papillary thyroid cancer |
| GO ID | Tissue | Disease Stage | Description | Gene Ratio | Bg Ratio | pvalue | p.adjust | Count |
| GO:00106312 | Colorectum | MSS | epithelial cell migration | 92/3467 | 357/18723 | 3.87e-04 | 4.86e-03 | 92 |
| GO:00420581 | Colorectum | MSS | regulation of epidermal growth factor receptor signaling pathway | 26/3467 | 73/18723 | 4.05e-04 | 4.99e-03 | 26 |
| GO:00901302 | Colorectum | MSS | tissue migration | 93/3467 | 365/18723 | 5.42e-04 | 6.06e-03 | 93 |
| GO:00506731 | Colorectum | MSS | epithelial cell proliferation | 108/3467 | 437/18723 | 6.76e-04 | 7.30e-03 | 108 |
| GO:00166011 | Colorectum | MSS | Rac protein signal transduction | 17/3467 | 42/18723 | 7.63e-04 | 8.10e-03 | 17 |
| GO:00300321 | Colorectum | MSS | lamellipodium assembly | 24/3467 | 72/18723 | 1.91e-03 | 1.66e-02 | 24 |
| GO:00435422 | Colorectum | MSS | endothelial cell migration | 70/3467 | 279/18723 | 3.69e-03 | 2.71e-02 | 70 |
| GO:0048659 | Colorectum | MSS | smooth muscle cell proliferation | 49/3467 | 184/18723 | 4.08e-03 | 2.97e-02 | 49 |
| GO:0048660 | Colorectum | MSS | regulation of smooth muscle cell proliferation | 48/3467 | 180/18723 | 4.32e-03 | 3.07e-02 | 48 |
| GO:0048661 | Colorectum | MSS | positive regulation of smooth muscle cell proliferation | 30/3467 | 104/18723 | 6.69e-03 | 4.38e-02 | 30 |
| GO:0050678 | Colorectum | MSS | regulation of epithelial cell proliferation | 90/3467 | 381/18723 | 6.92e-03 | 4.45e-02 | 90 |
| GO:00108113 | Colorectum | MSI-H | positive regulation of cell-substrate adhesion | 20/1319 | 123/18723 | 3.67e-04 | 8.46e-03 | 20 |
| GO:00106313 | Colorectum | MSI-H | epithelial cell migration | 42/1319 | 357/18723 | 7.51e-04 | 1.42e-02 | 42 |
| GO:00901323 | Colorectum | MSI-H | epithelium migration | 42/1319 | 360/18723 | 8.89e-04 | 1.58e-02 | 42 |
| GO:00901303 | Colorectum | MSI-H | tissue migration | 42/1319 | 365/18723 | 1.17e-03 | 1.92e-02 | 42 |
| GO:00457853 | Colorectum | MSI-H | positive regulation of cell adhesion | 48/1319 | 437/18723 | 1.47e-03 | 2.23e-02 | 48 |
| GO:00975813 | Colorectum | MSI-H | lamellipodium organization | 15/1319 | 90/18723 | 1.48e-03 | 2.23e-02 | 15 |
| GO:00108103 | Colorectum | MSI-H | regulation of cell-substrate adhesion | 28/1319 | 221/18723 | 1.83e-03 | 2.63e-02 | 28 |
| GO:00381273 | Colorectum | MSI-H | ERBB signaling pathway | 18/1319 | 121/18723 | 2.01e-03 | 2.83e-02 | 18 |
| GO:00071733 | Colorectum | MSI-H | epidermal growth factor receptor signaling pathway | 16/1319 | 108/18723 | 3.63e-03 | 4.28e-02 | 16 |
| Hugo Symbol | Variant Class | Variant Classification | dbSNP RS | HGVSc | HGVSp | HGVSp Short | SWISSPROT | BIOTYPE | SIFT | PolyPhen | Tumor Sample Barcode | Tissue | Histology | Sex | Age | Stage | Therapy Types | Drugs | Outcome |
| CDH13 | SNV | Missense_Mutation | novel | c.1360N>A | p.Pro454Thr | p.P454T | P55290 | protein_coding | deleterious(0.02) | benign(0.426) | TCGA-A2-A0EM-01 | Breast | breast invasive carcinoma | Female | >=65 | I/II | Hormone Therapy | tamoxiphen | SD |
| CDH13 | SNV | Missense_Mutation | rs372445890 | c.1510N>A | p.Gly504Ser | p.G504S | P55290 | protein_coding | tolerated(0.73) | probably_damaging(0.997) | TCGA-A8-A08T-01 | Breast | breast invasive carcinoma | Female | <65 | III/IV | Unknown | Unknown | PD |
| CDH13 | SNV | Missense_Mutation | novel | c.1414T>C | p.Ser472Pro | p.S472P | P55290 | protein_coding | deleterious(0.01) | probably_damaging(0.981) | TCGA-A8-A094-01 | Breast | breast invasive carcinoma | Female | >=65 | I/II | Unknown | Unknown | SD |
| CDH13 | SNV | Missense_Mutation | novel | c.1954N>C | p.Gly652Arg | p.G652R | P55290 | protein_coding | tolerated(0.14) | probably_damaging(0.999) | TCGA-D8-A73U-01 | Breast | breast invasive carcinoma | Female | >=65 | I/II | Hormone Therapy | tamoxiphen | SD |
| CDH13 | insertion | Nonsense_Mutation | novel | c.1332_1333insCGGCTCAAAGGAATGTGCTAATGAAAGCTCATGAAATTCTCTATCTAT | p.Arg444_Ala445insArgLeuLysGlyMetCysTerTerLysLeuMetLysPheSerIleTyr | p.R444_A445insRLKGMC**KLMKFSIY | P55290 | protein_coding | | | TCGA-BH-A0EE-01 | Breast | breast invasive carcinoma | Female | >=65 | I/II | Chemotherapy | docetaxel | SD |
| CDH13 | SNV | Missense_Mutation | rs868363122 | c.1078T>C | p.Ser360Pro | p.S360P | P55290 | protein_coding | tolerated(0.1) | benign(0.003) | TCGA-2W-A8YY-01 | Cervix | cervical & endocervical cancer | Female | <65 | I/II | Chemotherapy | cisplatin | CR |
| CDH13 | SNV | Missense_Mutation | novel | c.1910C>A | p.Ala637Asp | p.A637D | P55290 | protein_coding | deleterious(0.01) | probably_damaging(0.996) | TCGA-EK-A2PG-01 | Cervix | cervical & endocervical cancer | Female | >=65 | I/II | Unknown | Unknown | SD |
| CDH13 | SNV | Missense_Mutation | | c.2186G>A | p.Cys729Tyr | p.C729Y | P55290 | protein_coding | deleterious(0) | possibly_damaging(0.56) | TCGA-IR-A3LH-01 | Cervix | cervical & endocervical cancer | Female | <65 | I/II | Chemotherapy | cisplatin | CR |
| CDH13 | SNV | Missense_Mutation | | c.240N>C | p.Gln80His | p.Q80H | P55290 | protein_coding | deleterious(0.04) | benign(0.444) | TCGA-JW-A5VL-01 | Cervix | cervical & endocervical cancer | Female | <65 | I/II | Unknown | Unknown | SD |
| CDH13 | SNV | Missense_Mutation | novel | c.1213N>C | p.Asp405His | p.D405H | P55290 | protein_coding | deleterious(0) | probably_damaging(0.998) | TCGA-VS-A959-01 | Cervix | cervical & endocervical cancer | Female | >=65 | I/II | Unknown | Unknown | SD |


