
|
|||||
|
 | |
| |
| |
| |
| |
| |
|
Gene: CCNY |
Gene summary for CCNY |
| Gene information | Species | Human | Gene symbol | CCNY | Gene ID | 219771 |
| Gene name | cyclin Y | |
| Gene Alias | C10orf9 | |
| Cytomap | 10p11.21 | |
| Gene Type | protein-coding | GO ID | GO:0000079 | UniProtAcc | Q8ND76 |
Top |
Malignant transformation analysis |
| Identification of the aberrant gene expression in precancerous and cancerous lesions by comparing the gene expression of stem-like cells in diseased tissues with normal stem cells |
| Entrez ID | Symbol | Replicates | Species | Organ | Tissue | Adj P-value | Log2FC | Malignancy |
| 219771 | CCNY | CCI_1 | Human | Cervix | CC | 2.76e-07 | 1.33e+00 | 0.528 |
| 219771 | CCNY | CCI_2 | Human | Cervix | CC | 6.32e-05 | 9.03e-01 | 0.5249 |
| 219771 | CCNY | CCI_3 | Human | Cervix | CC | 1.56e-02 | 5.07e-01 | 0.516 |
| 219771 | CCNY | HTA11_3410_2000001011 | Human | Colorectum | AD | 2.50e-07 | -4.77e-01 | 0.0155 |
| 219771 | CCNY | HTA11_6818_2000001011 | Human | Colorectum | AD | 1.04e-04 | -3.08e-01 | 0.0112 |
| 219771 | CCNY | HTA11_99999974143_84620 | Human | Colorectum | MSS | 3.10e-05 | -3.20e-01 | 0.3005 |
| 219771 | CCNY | A002-C-010 | Human | Colorectum | FAP | 5.16e-04 | -8.11e-02 | 0.242 |
| 219771 | CCNY | A015-C-203 | Human | Colorectum | FAP | 2.22e-33 | -5.24e-01 | -0.1294 |
| 219771 | CCNY | A015-C-204 | Human | Colorectum | FAP | 2.57e-03 | -2.21e-01 | -0.0228 |
| 219771 | CCNY | A014-C-040 | Human | Colorectum | FAP | 1.00e-05 | -5.37e-01 | -0.1184 |
| 219771 | CCNY | A002-C-201 | Human | Colorectum | FAP | 5.01e-10 | -3.40e-01 | 0.0324 |
| 219771 | CCNY | A002-C-203 | Human | Colorectum | FAP | 3.10e-05 | -1.08e-01 | 0.2786 |
| 219771 | CCNY | A001-C-119 | Human | Colorectum | FAP | 6.43e-10 | -5.15e-01 | -0.1557 |
| 219771 | CCNY | A001-C-108 | Human | Colorectum | FAP | 2.20e-16 | -3.53e-01 | -0.0272 |
| 219771 | CCNY | A002-C-205 | Human | Colorectum | FAP | 3.17e-25 | -5.63e-01 | -0.1236 |
| 219771 | CCNY | A015-C-005 | Human | Colorectum | FAP | 3.25e-06 | -3.91e-01 | -0.0336 |
| 219771 | CCNY | A015-C-006 | Human | Colorectum | FAP | 2.74e-14 | -4.46e-01 | -0.0994 |
| 219771 | CCNY | A015-C-106 | Human | Colorectum | FAP | 4.89e-15 | -2.76e-01 | -0.0511 |
| 219771 | CCNY | A002-C-114 | Human | Colorectum | FAP | 1.09e-17 | -4.85e-01 | -0.1561 |
| 219771 | CCNY | A015-C-104 | Human | Colorectum | FAP | 2.62e-36 | -5.39e-01 | -0.1899 |
| Page: 1 2 3 4 5 6 7 8 |
| Tissue | Expression Dynamics | Abbreviation |
| Cervix | 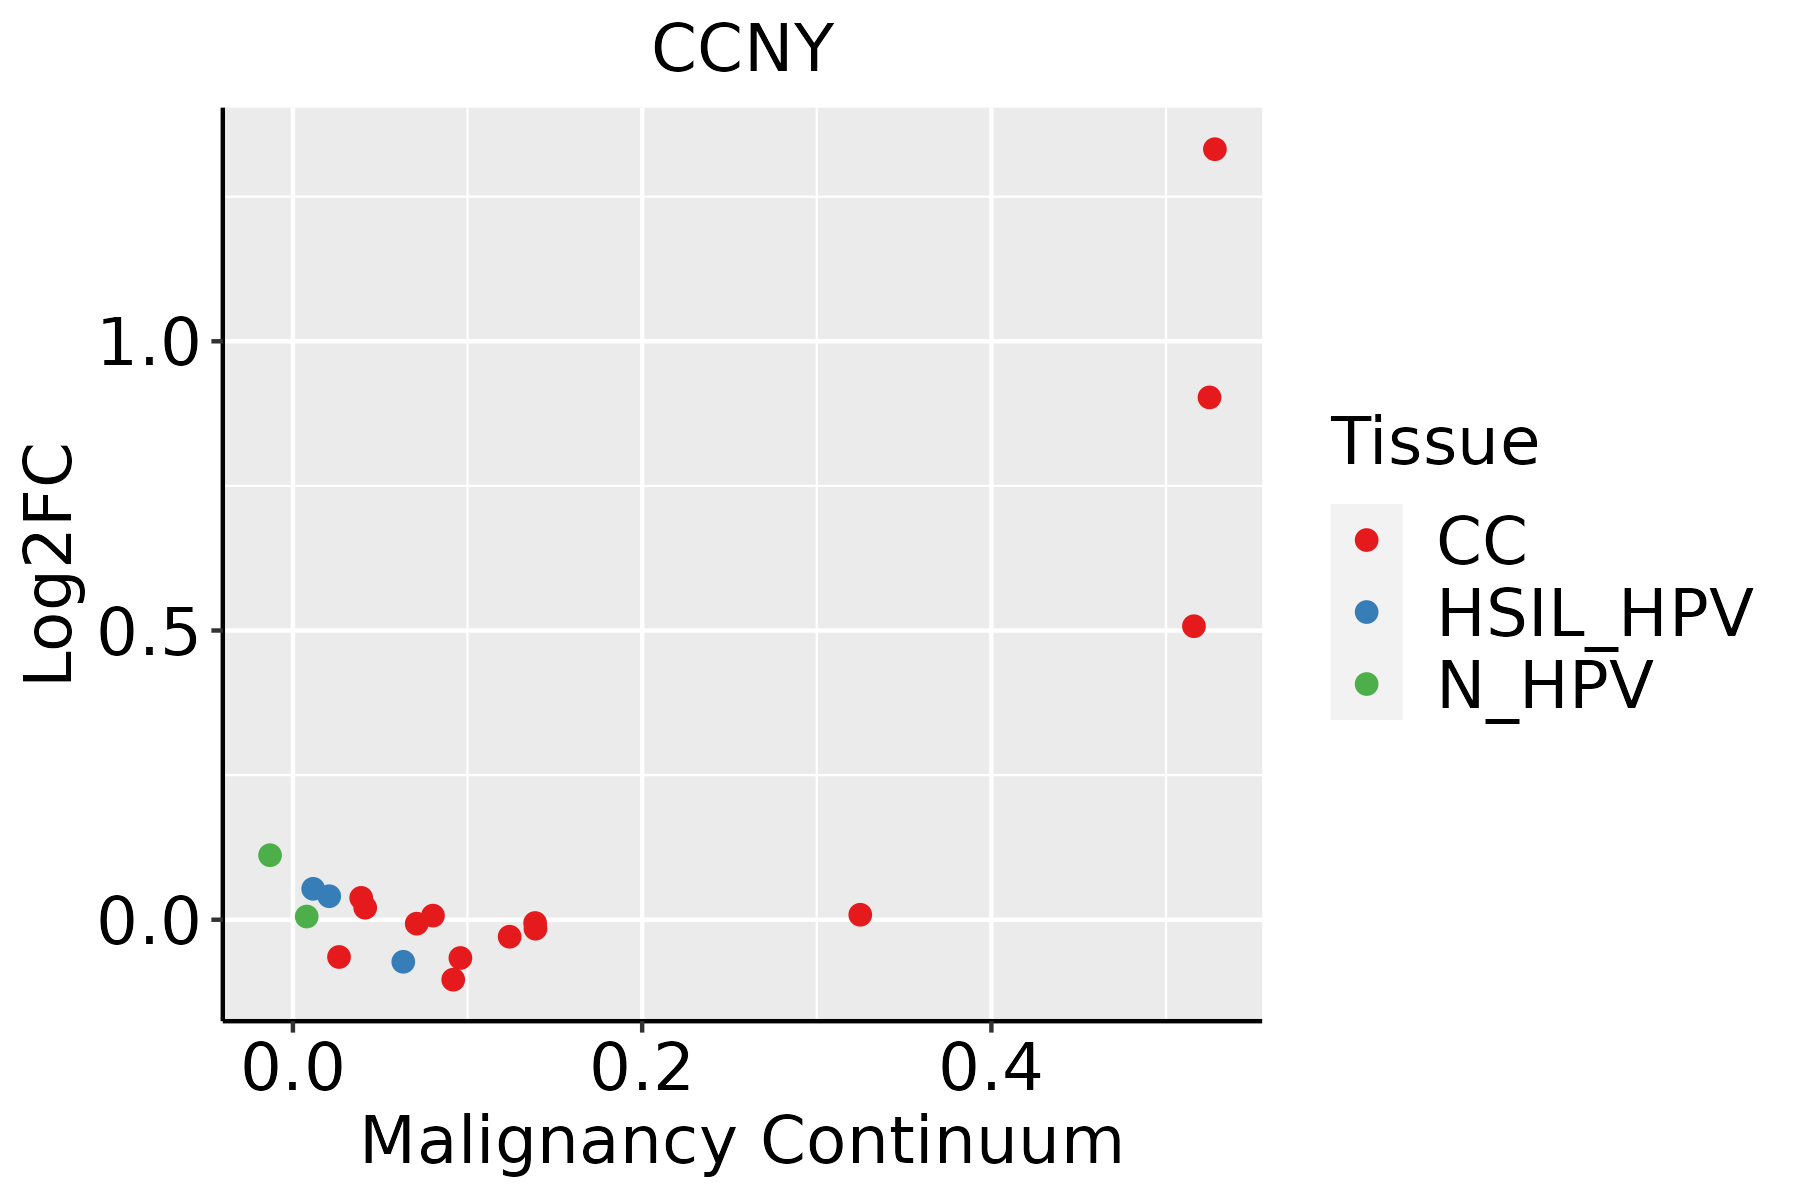 | CC: Cervix cancer |
| HSIL_HPV: HPV-infected high-grade squamous intraepithelial lesions | ||
| N_HPV: HPV-infected normal cervix | ||
| Colorectum (GSE201348) |  | FAP: Familial adenomatous polyposis |
| CRC: Colorectal cancer | ||
| Colorectum (HTA11) |  | AD: Adenomas |
| SER: Sessile serrated lesions | ||
| MSI-H: Microsatellite-high colorectal cancer | ||
| MSS: Microsatellite stable colorectal cancer | ||
| Endometrium | 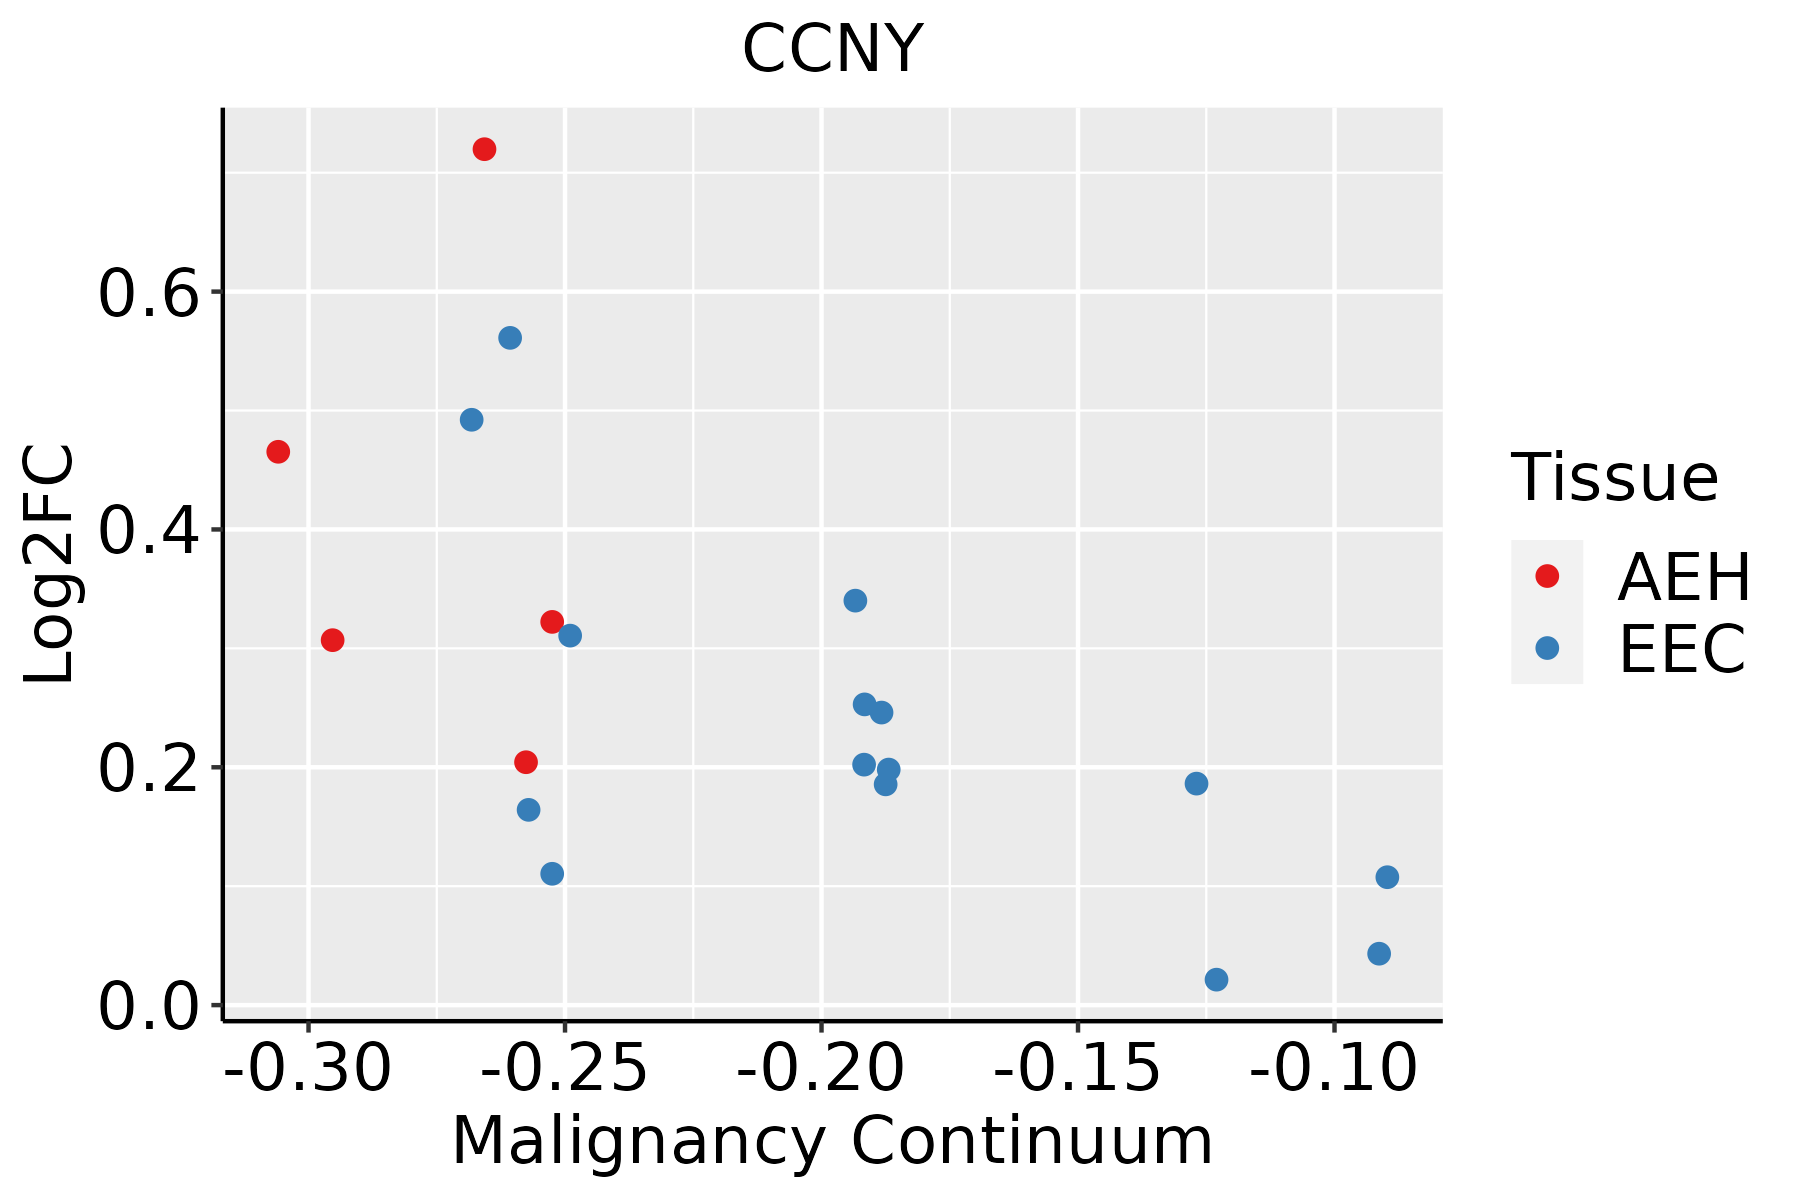 | AEH: Atypical endometrial hyperplasia |
| EEC: Endometrioid Cancer | ||
| Esophagus | 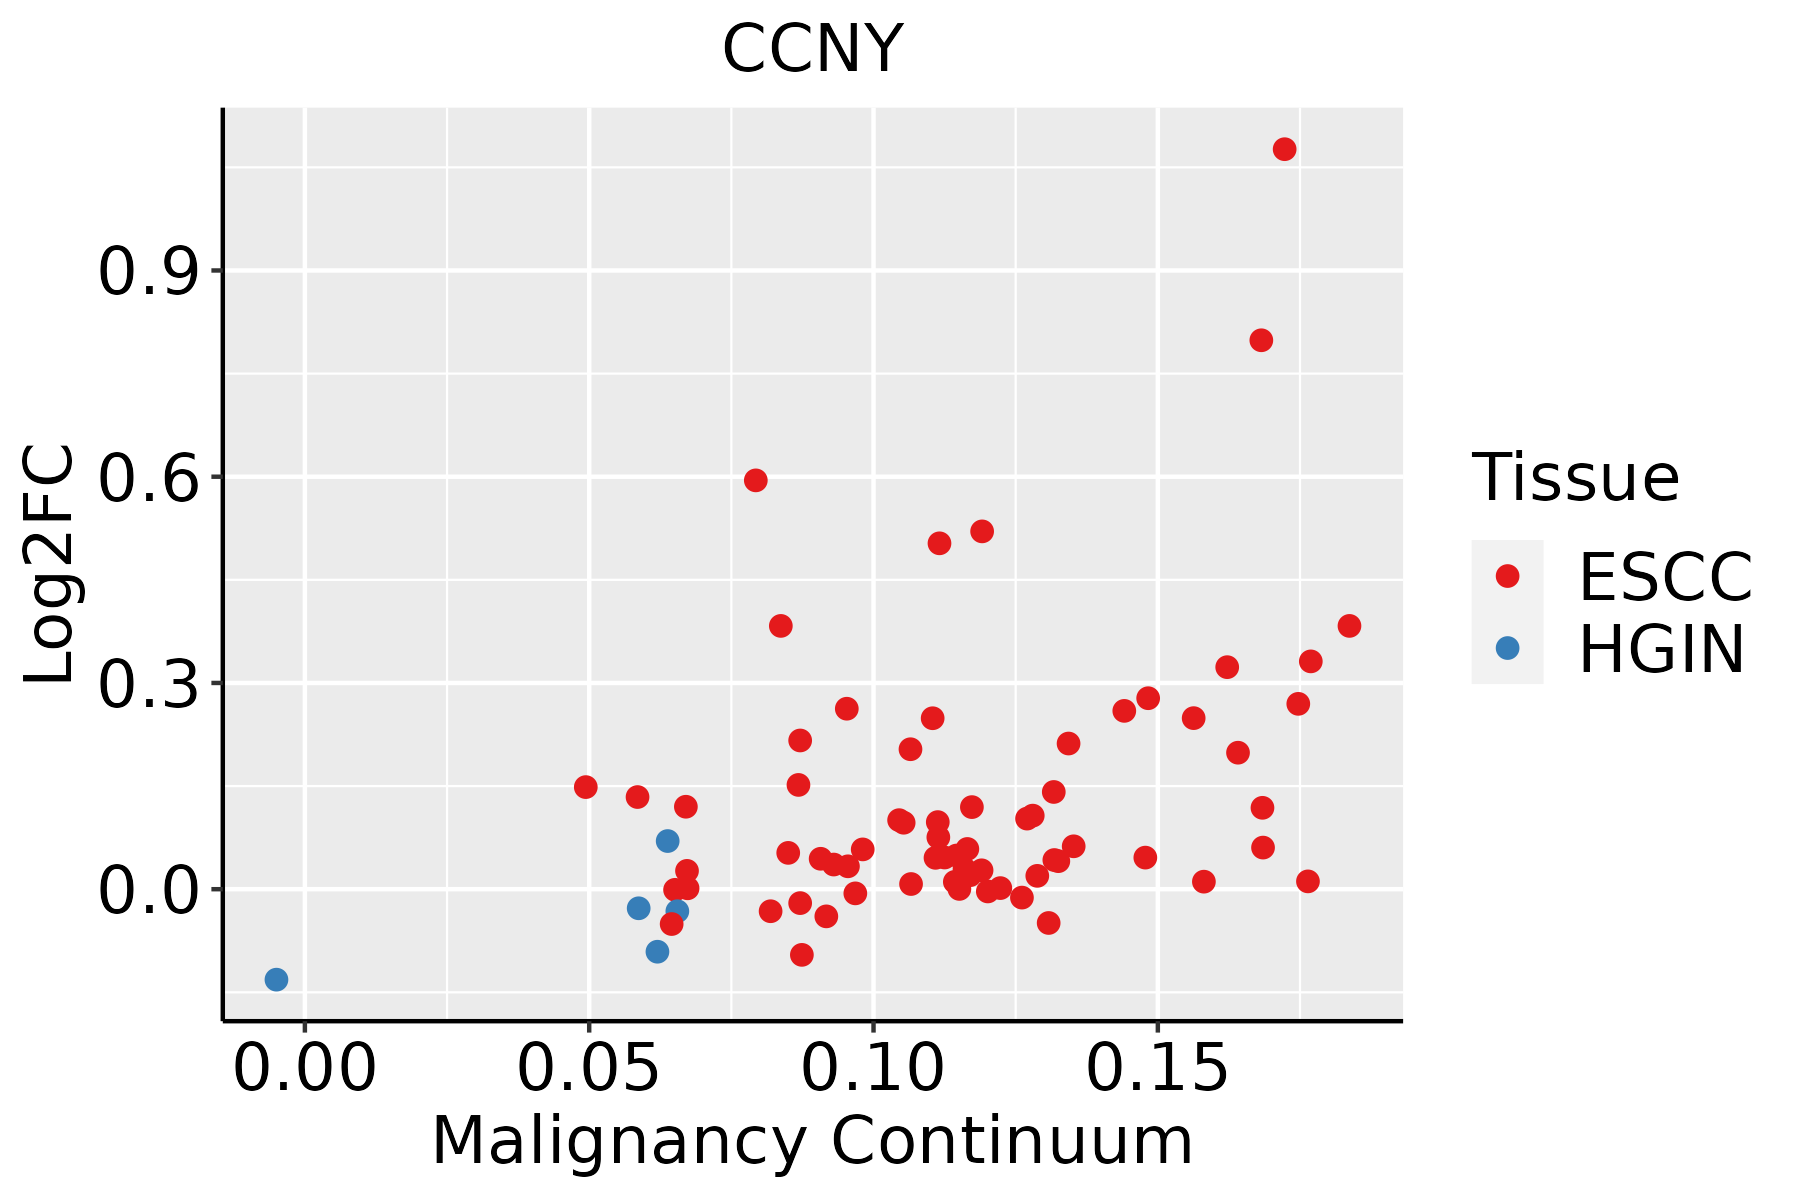 | ESCC: Esophageal squamous cell carcinoma |
| HGIN: High-grade intraepithelial neoplasias | ||
| LGIN: Low-grade intraepithelial neoplasias | ||
| Liver |  | HCC: Hepatocellular carcinoma |
| NAFLD: Non-alcoholic fatty liver disease | ||
| Lung |  | AAH: Atypical adenomatous hyperplasia |
| AIS: Adenocarcinoma in situ | ||
| IAC: Invasive lung adenocarcinoma | ||
| MIA: Minimally invasive adenocarcinoma | ||
| Oral Cavity |  | EOLP: Erosive Oral lichen planus |
| LP: leukoplakia | ||
| NEOLP: Non-erosive oral lichen planus | ||
| OSCC: Oral squamous cell carcinoma | ||
| Prostate | 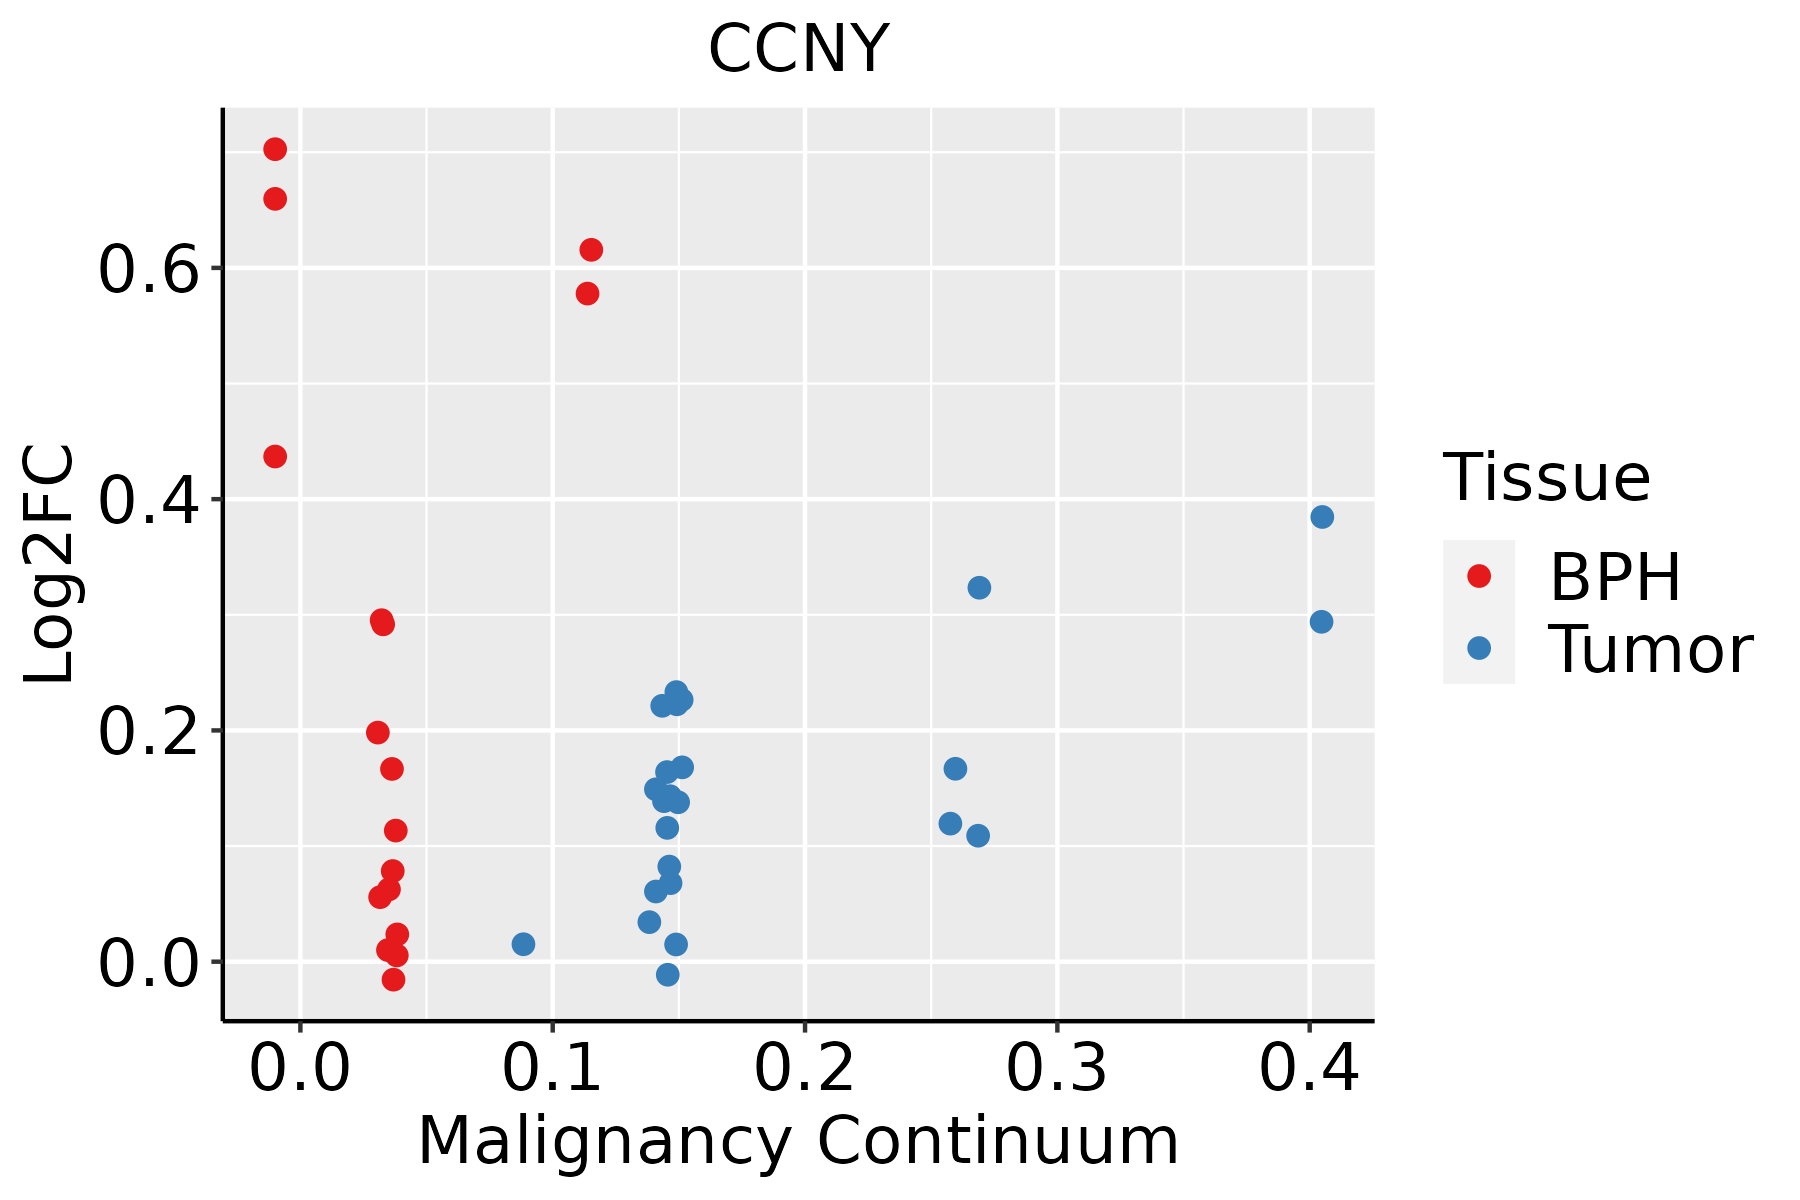 | BPH: Benign Prostatic Hyperplasia |
| Thyroid | 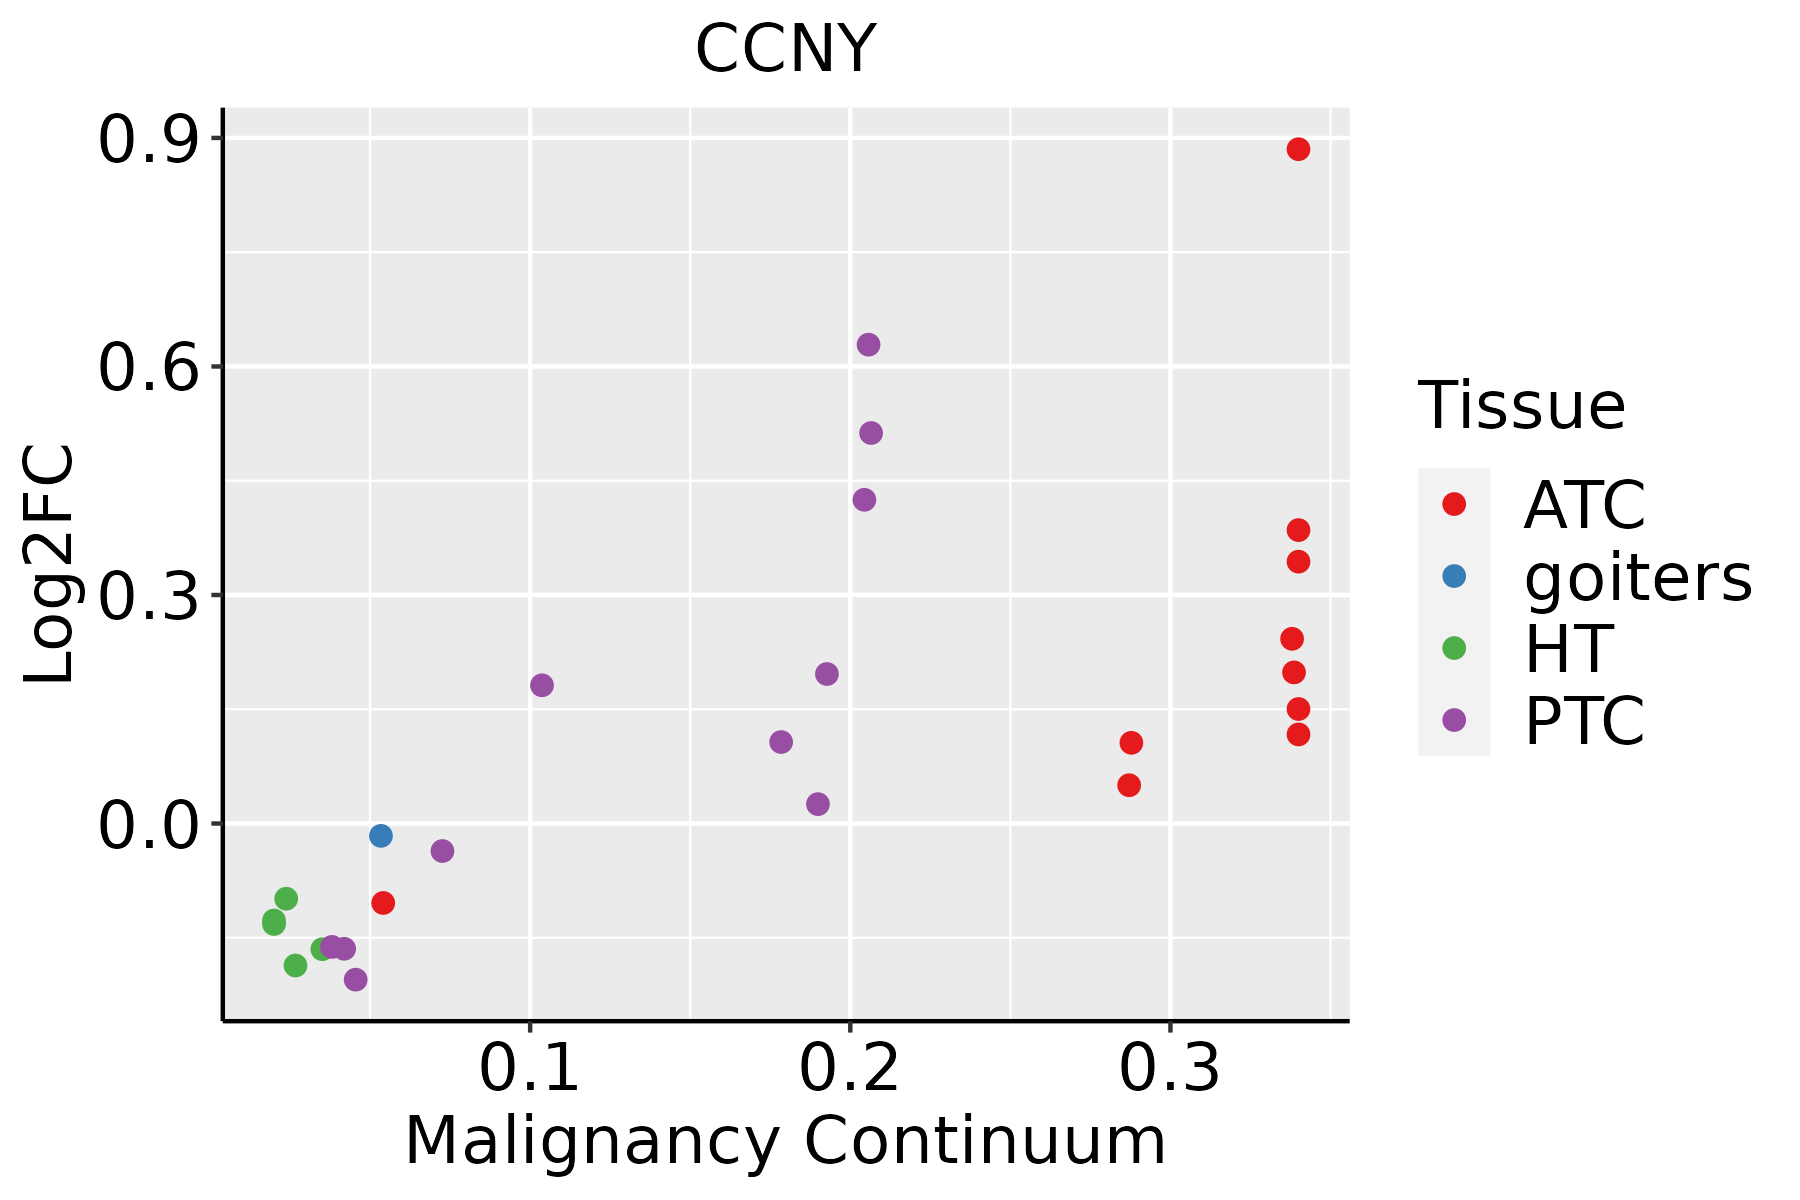 | ATC: Anaplastic thyroid cancer |
| HT: Hashimoto's thyroiditis | ||
| PTC: Papillary thyroid cancer |
| ∗log2FC in expression of this searched gene in stem-like cells from each diseased tissue sample relative to stem-like cells in normal samples in each tissue plotted against the malignancy continuum. Samples are colored based on if they are from different disease stage. |
Top |
Malignant transformation related pathway analysis |
| Find out the enriched GO biological processes and KEGG pathways involved in transition from healthy to precancer to cancer |
| Tissue | Disease Stage | Enriched GO biological Processes |
| Colorectum | AD |  |
| Colorectum | SER |  |
| Colorectum | MSS |  |
| Colorectum | MSI-H |  |
| Colorectum | FAP |  |
| ∗Top 15 enriched GO BP terms are showed in the bar plot of each disease state in each tissue. Each row represents a significant GO biological process which is colored according to the -log10(p.adjust). |
| Page: 1 2 3 4 5 6 7 8 9 |
| GO ID | Tissue | Disease Stage | Description | Gene Ratio | Bg Ratio | pvalue | p.adjust | Count |
| GO:00458604 | Colorectum | FAP | positive regulation of protein kinase activity | 77/2622 | 386/18723 | 7.31e-04 | 7.81e-03 | 77 |
| GO:00719022 | Colorectum | FAP | positive regulation of protein serine/threonine kinase activity | 45/2622 | 200/18723 | 7.36e-04 | 7.83e-03 | 45 |
| GO:00336744 | Colorectum | FAP | positive regulation of kinase activity | 89/2622 | 467/18723 | 1.33e-03 | 1.22e-02 | 89 |
| GO:00160554 | Colorectum | CRC | Wnt signaling pathway | 88/2078 | 444/18723 | 3.91e-08 | 5.28e-06 | 88 |
| GO:01987384 | Colorectum | CRC | cell-cell signaling by wnt | 88/2078 | 446/18723 | 4.85e-08 | 6.04e-06 | 88 |
| GO:00301114 | Colorectum | CRC | regulation of Wnt signaling pathway | 68/2078 | 328/18723 | 2.41e-07 | 2.27e-05 | 68 |
| GO:00608284 | Colorectum | CRC | regulation of canonical Wnt signaling pathway | 52/2078 | 253/18723 | 7.85e-06 | 2.85e-04 | 52 |
| GO:00600704 | Colorectum | CRC | canonical Wnt signaling pathway | 59/2078 | 303/18723 | 1.15e-05 | 3.74e-04 | 59 |
| GO:00719004 | Colorectum | CRC | regulation of protein serine/threonine kinase activity | 65/2078 | 359/18723 | 4.67e-05 | 1.10e-03 | 65 |
| GO:00458605 | Colorectum | CRC | positive regulation of protein kinase activity | 67/2078 | 386/18723 | 1.34e-04 | 2.55e-03 | 67 |
| GO:00336745 | Colorectum | CRC | positive regulation of kinase activity | 77/2078 | 467/18723 | 2.42e-04 | 4.00e-03 | 77 |
| GO:00719023 | Colorectum | CRC | positive regulation of protein serine/threonine kinase activity | 39/2078 | 200/18723 | 3.20e-04 | 4.95e-03 | 39 |
| GO:00457873 | Colorectum | CRC | positive regulation of cell cycle | 55/2078 | 313/18723 | 3.76e-04 | 5.57e-03 | 55 |
| GO:00301118 | Endometrium | AEH | regulation of Wnt signaling pathway | 71/2100 | 328/18723 | 3.31e-08 | 1.87e-06 | 71 |
| GO:00160558 | Endometrium | AEH | Wnt signaling pathway | 85/2100 | 444/18723 | 4.99e-07 | 1.97e-05 | 85 |
| GO:01987388 | Endometrium | AEH | cell-cell signaling by wnt | 85/2100 | 446/18723 | 6.07e-07 | 2.29e-05 | 85 |
| GO:00608288 | Endometrium | AEH | regulation of canonical Wnt signaling pathway | 54/2100 | 253/18723 | 2.22e-06 | 6.56e-05 | 54 |
| GO:00600708 | Endometrium | AEH | canonical Wnt signaling pathway | 58/2100 | 303/18723 | 3.12e-05 | 5.66e-04 | 58 |
| GO:003367414 | Endometrium | AEH | positive regulation of kinase activity | 78/2100 | 467/18723 | 2.03e-04 | 2.54e-03 | 78 |
| GO:00457877 | Endometrium | AEH | positive regulation of cell cycle | 56/2100 | 313/18723 | 2.73e-04 | 3.14e-03 | 56 |
| Page: 1 2 3 4 5 6 7 8 9 10 11 12 13 |
| Pathway ID | Tissue | Disease Stage | Description | Gene Ratio | Bg Ratio | pvalue | p.adjust | qvalue | Count |
| Page: 1 |
Top |
Cell-cell communication analysis |
| Identification of potential cell-cell interactions between two cell types and their ligand-receptor pairs for different disease states |
| Ligand | Receptor | LRpair | Pathway | Tissue | Disease Stage |
| Page: 1 |
Top |
Single-cell gene regulatory network inference analysis |
| Find out the significant the regulons (TFs) and the target genes of each regulon across cell types for different disease states |
| TF | Cell Type | Tissue | Disease Stage | Target Gene | RSS | Regulon Activity |
| ∗The dot plots of a searched regulon are shown for all cell subpopulations in each disease state of each tissue based on the regulon specific score inferred using pySCENIC and by calculating the average expression. |
| Page: 1 |
Top |
Somatic mutation of malignant transformation related genes |
| Annotation of somatic variants for genes involved in malignant transformation |
| Hugo Symbol | Variant Class | Variant Classification | dbSNP RS | HGVSc | HGVSp | HGVSp Short | SWISSPROT | BIOTYPE | SIFT | PolyPhen | Tumor Sample Barcode | Tissue | Histology | Sex | Age | Stage | Therapy Types | Drugs | Outcome |
| CCNY | SNV | Missense_Mutation | c.176N>G | p.Pro59Arg | p.P59R | Q8ND76 | protein_coding | deleterious(0) | probably_damaging(1) | TCGA-A8-A08R-01 | Breast | breast invasive carcinoma | Female | <65 | I/II | Unknown | Unknown | SD | |
| CCNY | SNV | Missense_Mutation | novel | c.728N>C | p.Asp243Ala | p.D243A | Q8ND76 | protein_coding | deleterious(0) | possibly_damaging(0.685) | TCGA-OL-A5RV-01 | Breast | breast invasive carcinoma | Female | <65 | III/IV | Chemotherapy | doxorubicin | CR |
| CCNY | SNV | Missense_Mutation | c.656C>T | p.Ala219Val | p.A219V | Q8ND76 | protein_coding | deleterious(0.01) | benign(0.104) | TCGA-2W-A8YY-01 | Cervix | cervical & endocervical cancer | Female | <65 | I/II | Chemotherapy | cisplatin | CR | |
| CCNY | SNV | Missense_Mutation | c.448N>T | p.His150Tyr | p.H150Y | Q8ND76 | protein_coding | tolerated(0.07) | probably_damaging(1) | TCGA-DS-A0VK-01 | Cervix | cervical & endocervical cancer | Female | <65 | I/II | Chemotherapy | carboplatin | PD | |
| CCNY | SNV | Missense_Mutation | c.362N>C | p.Lys121Thr | p.K121T | Q8ND76 | protein_coding | deleterious(0) | probably_damaging(0.964) | TCGA-AA-A00N-01 | Colorectum | colon adenocarcinoma | Male | >=65 | I/II | Unknown | Unknown | PD | |
| CCNY | SNV | Missense_Mutation | rs202203761 | c.370N>A | p.Ala124Thr | p.A124T | Q8ND76 | protein_coding | tolerated(1) | benign(0.013) | TCGA-AA-A00N-01 | Colorectum | colon adenocarcinoma | Male | >=65 | I/II | Unknown | Unknown | PD |
| CCNY | SNV | Missense_Mutation | c.571G>A | p.Val191Ile | p.V191I | Q8ND76 | protein_coding | tolerated(0.49) | probably_damaging(0.999) | TCGA-AZ-6598-01 | Colorectum | colon adenocarcinoma | Female | >=65 | I/II | Unknown | Unknown | SD | |
| CCNY | SNV | Missense_Mutation | c.751N>A | p.Glu251Lys | p.E251K | Q8ND76 | protein_coding | tolerated(0.09) | probably_damaging(1) | TCGA-NH-A5IV-01 | Colorectum | colon adenocarcinoma | Female | >=65 | I/II | Unknown | Unknown | SD | |
| CCNY | SNV | Missense_Mutation | novel | c.226N>A | p.Asp76Asn | p.D76N | Q8ND76 | protein_coding | deleterious(0.05) | probably_damaging(1) | TCGA-EI-6917-01 | Colorectum | rectum adenocarcinoma | Male | <65 | III/IV | Chemotherapy | 5fluorouracil+oxaciplatina+l-folinian | SD |
| CCNY | SNV | Missense_Mutation | rs756155029 | c.224N>T | p.Thr75Met | p.T75M | Q8ND76 | protein_coding | tolerated(0.32) | probably_damaging(0.931) | TCGA-A5-A0G2-01 | Endometrium | uterine corpus endometrioid carcinoma | Female | <65 | III/IV | Unknown | Unknown | SD |
| Page: 1 2 3 |
Top |
Related drugs of malignant transformation related genes |
| Identification of chemicals and drugs interact with genes involved in malignant transfromation |
| (DGIdb 4.0) |
| Entrez ID | Symbol | Category | Interaction Types | Drug Claim Name | Drug Name | PMIDs |
| Page: 1 |

Copyright 2023-Present -The University of Texas Health Science Center at Houston |