| Tissue | Expression Dynamics | Abbreviation |
| Breast | 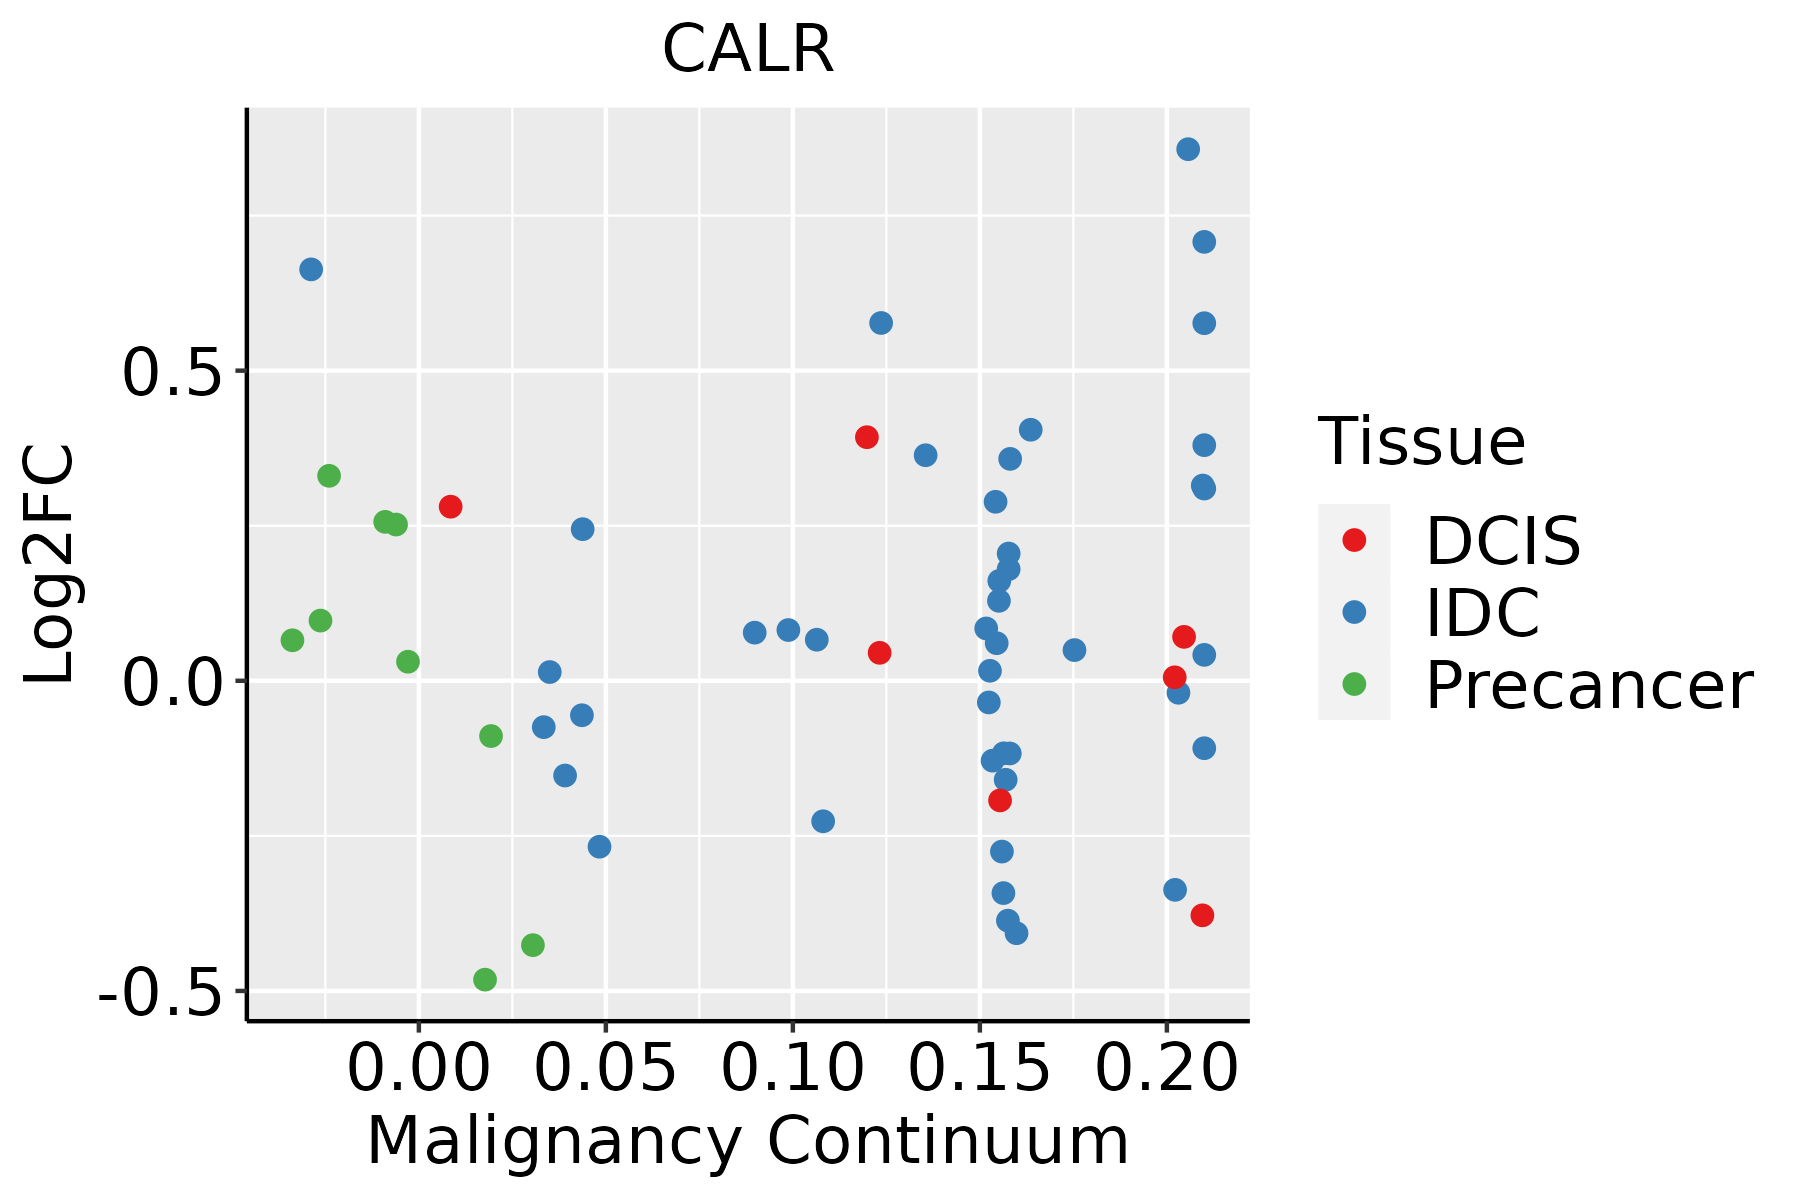 | IDC: Invasive ductal carcinoma |
| DCIS: Ductal carcinoma in situ |
| Precancer(BRCA1-mut): Precancerous lesion from BRCA1 mutation carriers |
| Cervix | 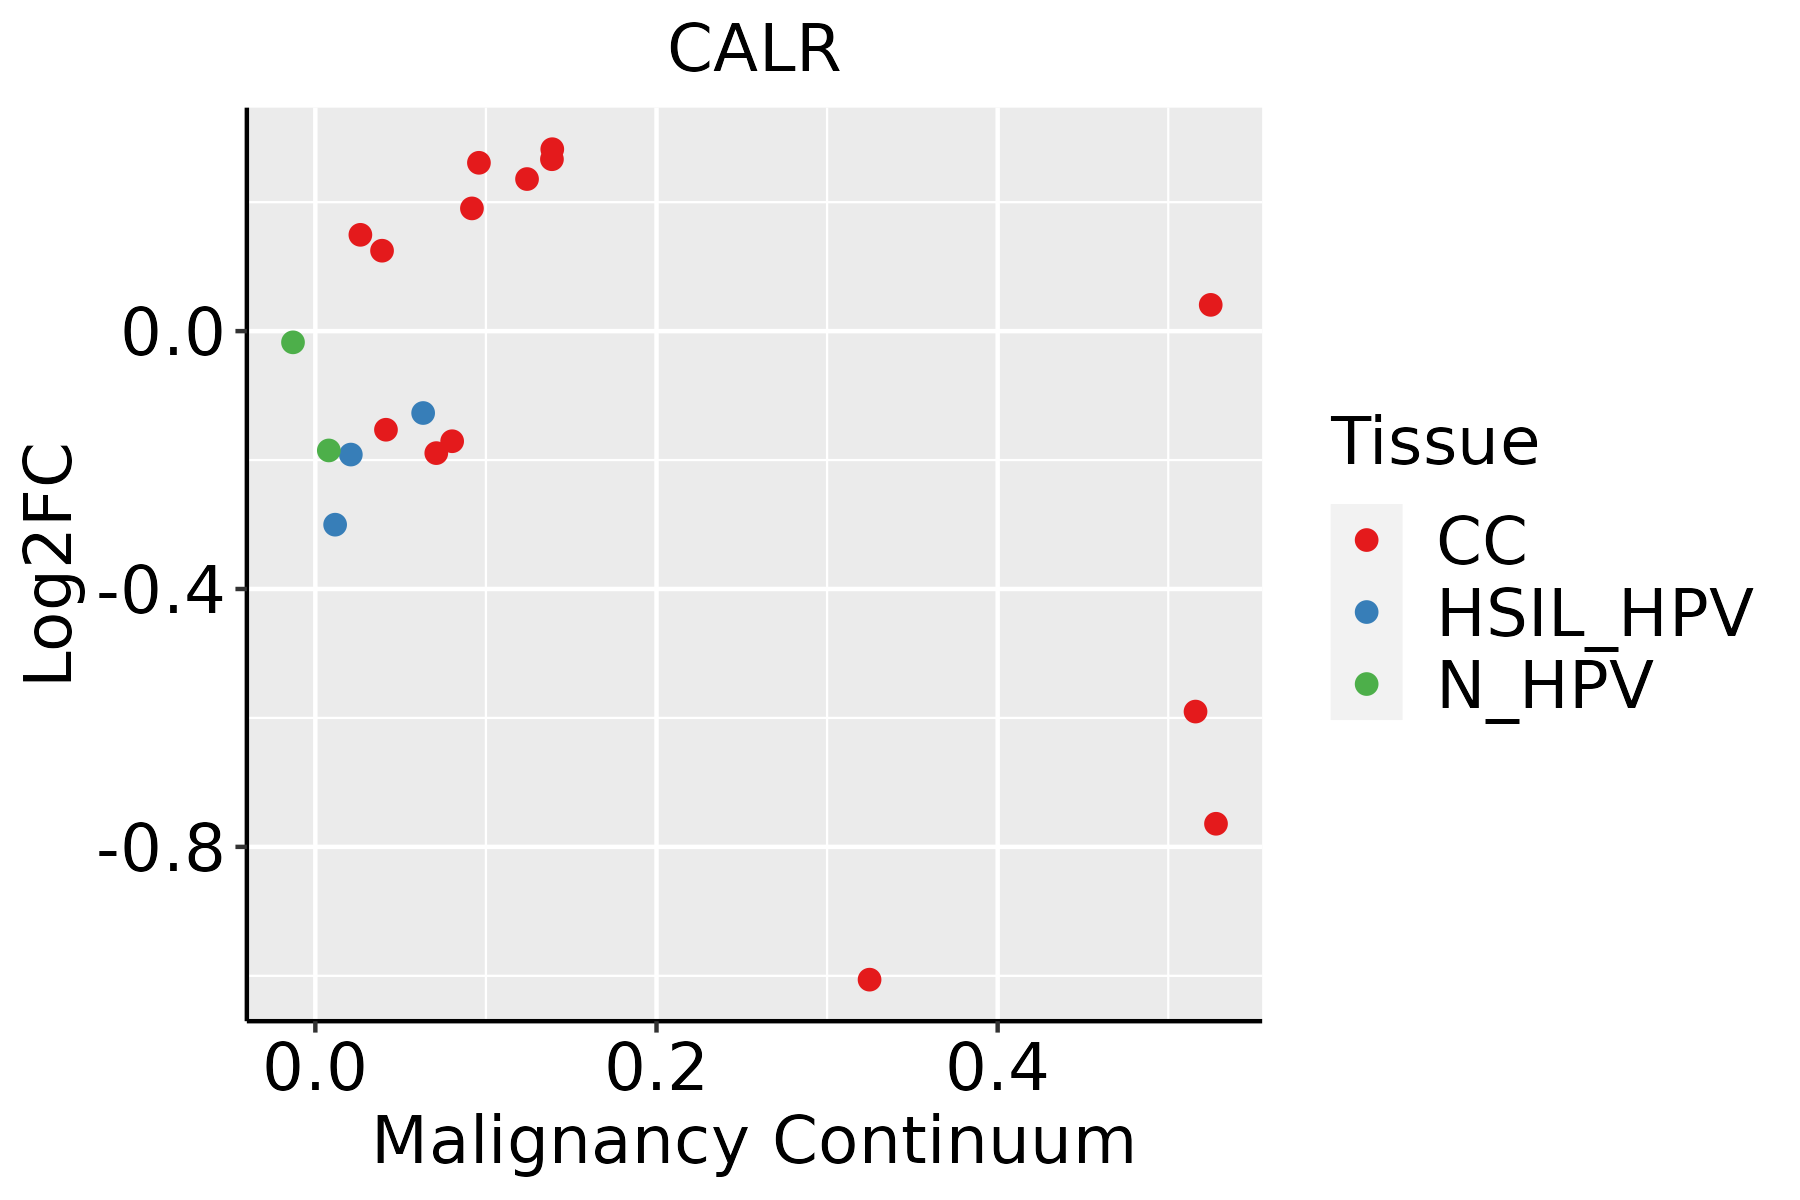 | CC: Cervix cancer |
| HSIL_HPV: HPV-infected high-grade squamous intraepithelial lesions |
| N_HPV: HPV-infected normal cervix |
| Colorectum (GSE201348) |  | FAP: Familial adenomatous polyposis |
| CRC: Colorectal cancer |
| Colorectum (HTA11) |  | AD: Adenomas |
| SER: Sessile serrated lesions |
| MSI-H: Microsatellite-high colorectal cancer |
| MSS: Microsatellite stable colorectal cancer |
| Endometrium |  | AEH: Atypical endometrial hyperplasia |
| EEC: Endometrioid Cancer |
| Esophagus |  | ESCC: Esophageal squamous cell carcinoma |
| HGIN: High-grade intraepithelial neoplasias |
| LGIN: Low-grade intraepithelial neoplasias |
| GC | 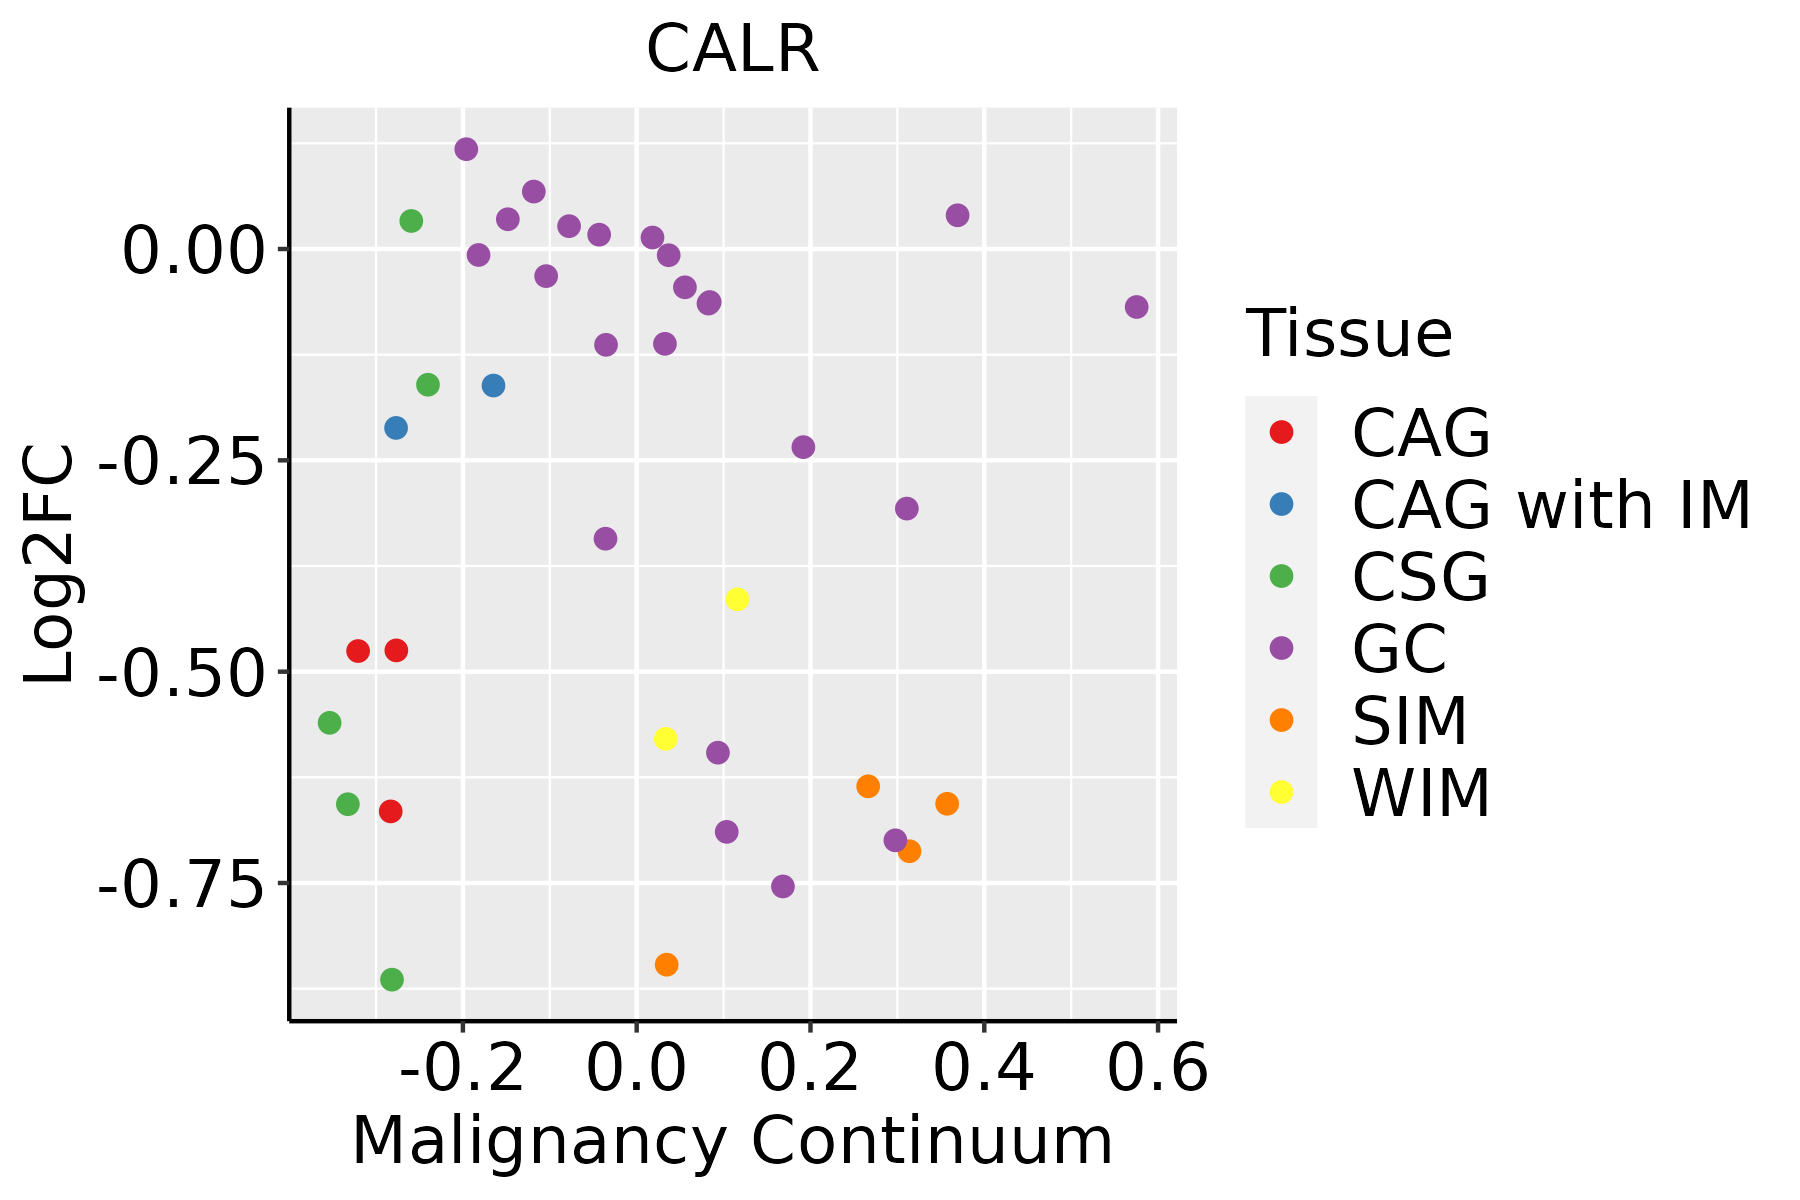 | CAG: Chronic atrophic gastritis |
| CAG with IM: Chronic atrophic gastritis with intestinal metaplasia |
| CSG: Chronic superficial gastritis |
| GC: Gastric cancer |
| SIM: Severe intestinal metaplasia |
| WIM: Wild intestinal metaplasia |
| Liver | 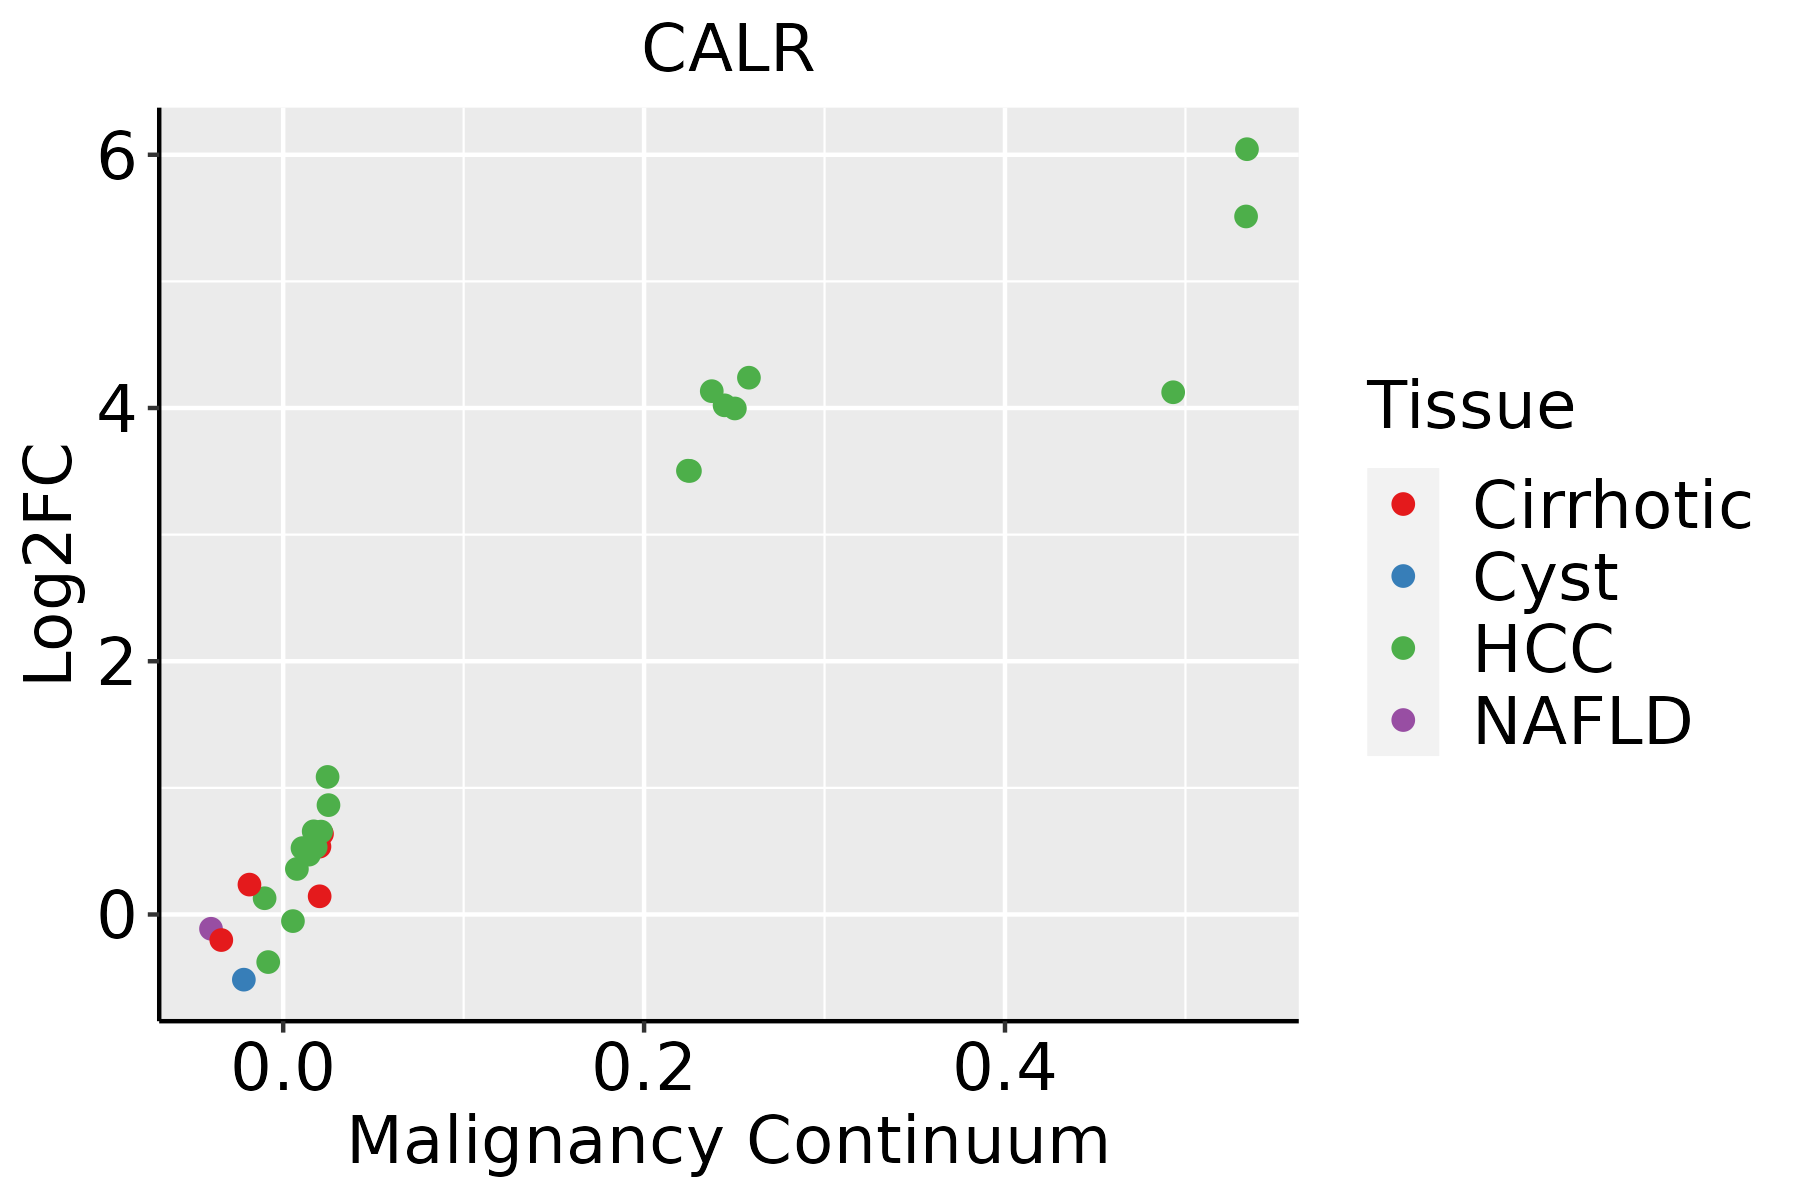 | HCC: Hepatocellular carcinoma |
| NAFLD: Non-alcoholic fatty liver disease |
| Oral Cavity |  | EOLP: Erosive Oral lichen planus |
| LP: leukoplakia |
| NEOLP: Non-erosive oral lichen planus |
| OSCC: Oral squamous cell carcinoma |
| Prostate |  | BPH: Benign Prostatic Hyperplasia |
| Skin |  | AK: Actinic keratosis |
| cSCC: Cutaneous squamous cell carcinoma |
| SCCIS:squamous cell carcinoma in situ |
| Thyroid | 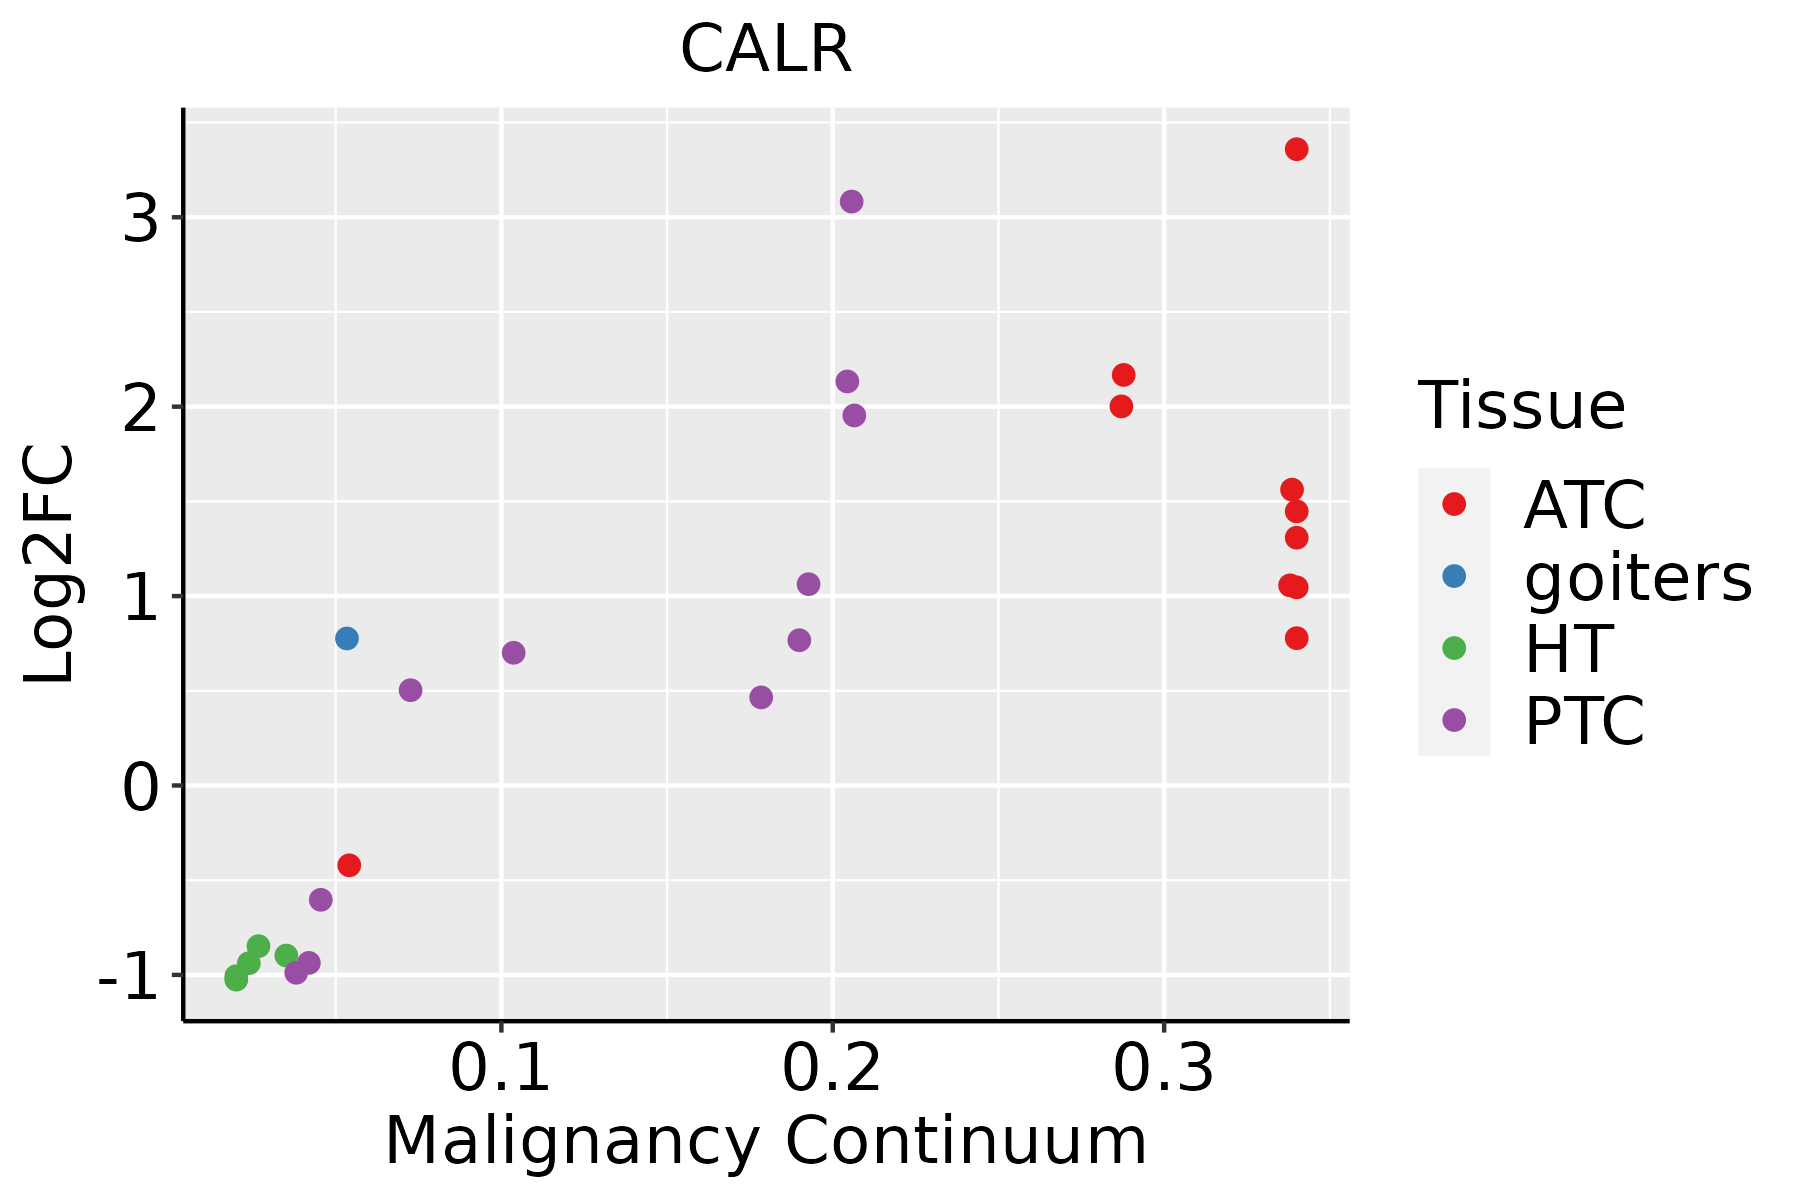 | ATC: Anaplastic thyroid cancer |
| HT: Hashimoto's thyroiditis |
| PTC: Papillary thyroid cancer |
| GO ID | Tissue | Disease Stage | Description | Gene Ratio | Bg Ratio | pvalue | p.adjust | Count |
| GO:00024749 | Breast | Precancer | antigen processing and presentation of peptide antigen via MHC class I | 7/1080 | 28/18723 | 8.46e-04 | 9.82e-03 | 7 |
| GO:00305187 | Breast | Precancer | intracellular steroid hormone receptor signaling pathway | 16/1080 | 116/18723 | 1.01e-03 | 1.13e-02 | 16 |
| GO:00716774 | Breast | Precancer | positive regulation of mononuclear cell migration | 11/1080 | 65/18723 | 1.13e-03 | 1.25e-02 | 11 |
| GO:00075694 | Breast | Precancer | cell aging | 17/1080 | 132/18723 | 1.55e-03 | 1.59e-02 | 17 |
| GO:19016549 | Breast | Precancer | response to ketone | 22/1080 | 194/18723 | 1.89e-03 | 1.84e-02 | 22 |
| GO:19000268 | Breast | Precancer | positive regulation of substrate adhesion-dependent cell spreading | 8/1080 | 41/18723 | 2.08e-03 | 1.97e-02 | 8 |
| GO:00026905 | Breast | Precancer | positive regulation of leukocyte chemotaxis | 13/1080 | 94/18723 | 2.83e-03 | 2.49e-02 | 13 |
| GO:00025017 | Breast | Precancer | peptide antigen assembly with MHC protein complex | 5/1080 | 18/18723 | 2.88e-03 | 2.49e-02 | 5 |
| GO:00305228 | Breast | Precancer | intracellular receptor signaling pathway | 27/1080 | 265/18723 | 2.99e-03 | 2.57e-02 | 27 |
| GO:00509212 | Breast | Precancer | positive regulation of chemotaxis | 17/1080 | 141/18723 | 3.15e-03 | 2.65e-02 | 17 |
| GO:00605374 | Breast | Precancer | muscle tissue development | 37/1080 | 403/18723 | 3.60e-03 | 2.98e-02 | 37 |
| GO:00023967 | Breast | Precancer | MHC protein complex assembly | 5/1080 | 19/18723 | 3.73e-03 | 3.04e-02 | 5 |
| GO:00108119 | Breast | Precancer | positive regulation of cell-substrate adhesion | 15/1080 | 123/18723 | 4.80e-03 | 3.64e-02 | 15 |
| GO:19000248 | Breast | Precancer | regulation of substrate adhesion-dependent cell spreading | 9/1080 | 57/18723 | 5.04e-03 | 3.80e-02 | 9 |
| GO:00509201 | Breast | Precancer | regulation of chemotaxis | 23/1080 | 223/18723 | 5.05e-03 | 3.80e-02 | 23 |
| GO:00147063 | Breast | Precancer | striated muscle tissue development | 35/1080 | 384/18723 | 5.10e-03 | 3.83e-02 | 35 |
| GO:00434018 | Breast | Precancer | steroid hormone mediated signaling pathway | 16/1080 | 136/18723 | 5.21e-03 | 3.88e-02 | 16 |
| GO:0072503 | Breast | Precancer | cellular divalent inorganic cation homeostasis | 42/1080 | 486/18723 | 5.91e-03 | 4.21e-02 | 42 |
| GO:00716754 | Breast | Precancer | regulation of mononuclear cell migration | 14/1080 | 115/18723 | 6.42e-03 | 4.48e-02 | 14 |
| GO:00516047 | Breast | Precancer | protein maturation | 28/1080 | 294/18723 | 6.45e-03 | 4.50e-02 | 28 |
| Pathway ID | Tissue | Disease Stage | Description | Gene Ratio | Bg Ratio | pvalue | p.adjust | qvalue | Count |
| hsa0414118 | Breast | Precancer | Protein processing in endoplasmic reticulum | 33/684 | 174/8465 | 2.78e-06 | 3.83e-05 | 2.94e-05 | 33 |
| hsa0461218 | Breast | Precancer | Antigen processing and presentation | 19/684 | 78/8465 | 9.61e-06 | 1.12e-04 | 8.62e-05 | 19 |
| hsa0516918 | Breast | Precancer | Epstein-Barr virus infection | 35/684 | 202/8465 | 1.15e-05 | 1.26e-04 | 9.64e-05 | 35 |
| hsa0414518 | Breast | Precancer | Phagosome | 27/684 | 152/8465 | 7.37e-05 | 6.85e-04 | 5.25e-04 | 27 |
| hsa0516618 | Breast | Precancer | Human T-cell leukemia virus 1 infection | 33/684 | 222/8465 | 4.29e-04 | 3.31e-03 | 2.53e-03 | 33 |
| hsa0516316 | Breast | Precancer | Human cytomegalovirus infection | 32/684 | 225/8465 | 1.13e-03 | 7.57e-03 | 5.80e-03 | 32 |
| hsa0414119 | Breast | Precancer | Protein processing in endoplasmic reticulum | 33/684 | 174/8465 | 2.78e-06 | 3.83e-05 | 2.94e-05 | 33 |
| hsa0461219 | Breast | Precancer | Antigen processing and presentation | 19/684 | 78/8465 | 9.61e-06 | 1.12e-04 | 8.62e-05 | 19 |
| hsa0516919 | Breast | Precancer | Epstein-Barr virus infection | 35/684 | 202/8465 | 1.15e-05 | 1.26e-04 | 9.64e-05 | 35 |
| hsa0414519 | Breast | Precancer | Phagosome | 27/684 | 152/8465 | 7.37e-05 | 6.85e-04 | 5.25e-04 | 27 |
| hsa0516619 | Breast | Precancer | Human T-cell leukemia virus 1 infection | 33/684 | 222/8465 | 4.29e-04 | 3.31e-03 | 2.53e-03 | 33 |
| hsa0516317 | Breast | Precancer | Human cytomegalovirus infection | 32/684 | 225/8465 | 1.13e-03 | 7.57e-03 | 5.80e-03 | 32 |
| hsa0414522 | Breast | IDC | Phagosome | 34/867 | 152/8465 | 8.00e-06 | 9.99e-05 | 7.48e-05 | 34 |
| hsa0516624 | Breast | IDC | Human T-cell leukemia virus 1 infection | 40/867 | 222/8465 | 2.52e-04 | 2.21e-03 | 1.66e-03 | 40 |
| hsa0516324 | Breast | IDC | Human cytomegalovirus infection | 39/867 | 225/8465 | 6.66e-04 | 5.41e-03 | 4.05e-03 | 39 |
| hsa0517014 | Breast | IDC | Human immunodeficiency virus 1 infection | 33/867 | 212/8465 | 9.28e-03 | 4.37e-02 | 3.27e-02 | 33 |
| hsa0414532 | Breast | IDC | Phagosome | 34/867 | 152/8465 | 8.00e-06 | 9.99e-05 | 7.48e-05 | 34 |
| hsa0516634 | Breast | IDC | Human T-cell leukemia virus 1 infection | 40/867 | 222/8465 | 2.52e-04 | 2.21e-03 | 1.66e-03 | 40 |
| hsa0516334 | Breast | IDC | Human cytomegalovirus infection | 39/867 | 225/8465 | 6.66e-04 | 5.41e-03 | 4.05e-03 | 39 |
| hsa0517015 | Breast | IDC | Human immunodeficiency virus 1 infection | 33/867 | 212/8465 | 9.28e-03 | 4.37e-02 | 3.27e-02 | 33 |
| Hugo Symbol | Variant Class | Variant Classification | dbSNP RS | HGVSc | HGVSp | HGVSp Short | SWISSPROT | BIOTYPE | SIFT | PolyPhen | Tumor Sample Barcode | Tissue | Histology | Sex | Age | Stage | Therapy Types | Drugs | Outcome |
| CALR | insertion | Nonsense_Mutation | novel | c.1193_1194insCCAGATTCAAGCGATTCTCCTGCCTCGGCCTCCTGAGTAGCT | p.Glu398delinsAspGlnIleGlnAlaIleLeuLeuProArgProProGluTerLeu | p.E398delinsDQIQAILLPRPPE*L | P27797 | protein_coding | | | TCGA-A2-A04Y-01 | Breast | breast invasive carcinoma | Female | <65 | I/II | Chemotherapy | cytoxan | SD |
| CALR | SNV | Missense_Mutation | | c.201N>C | p.Gln67His | p.Q67H | P27797 | protein_coding | deleterious(0.01) | benign(0.254) | TCGA-IR-A3LK-01 | Cervix | cervical & endocervical cancer | Female | >=65 | I/II | Chemotherapy | cisplatin | PD |
| CALR | SNV | Missense_Mutation | | c.1167N>T | p.Glu389Asp | p.E389D | P27797 | protein_coding | tolerated(0.51) | benign(0) | TCGA-MY-A5BE-01 | Cervix | cervical & endocervical cancer | Female | <65 | I/II | Unknown | Unknown | SD |
| CALR | SNV | Missense_Mutation | | c.298G>C | p.Glu100Gln | p.E100Q | P27797 | protein_coding | deleterious(0.01) | benign(0.373) | TCGA-Q1-A73O-01 | Cervix | cervical & endocervical cancer | Female | <65 | I/II | Chemotherapy | cisplatin | CR |
| CALR | insertion | In_Frame_Ins | novel | c.1114_1115insTTGTCA | p.Glu372delinsValValLys | p.E372delinsVVK | P27797 | protein_coding | | | TCGA-DS-A1OB-01 | Cervix | cervical & endocervical cancer | Female | <65 | I/II | Chemotherapy | carboplatin | PD |
| CALR | SNV | Missense_Mutation | novel | c.308T>C | p.Ile103Thr | p.I103T | P27797 | protein_coding | deleterious(0) | probably_damaging(0.984) | TCGA-AA-A00N-01 | Colorectum | colon adenocarcinoma | Male | >=65 | I/II | Unknown | Unknown | PD |
| CALR | SNV | Missense_Mutation | novel | c.193G>T | p.Gly65Cys | p.G65C | P27797 | protein_coding | deleterious(0.01) | probably_damaging(1) | TCGA-AA-A010-01 | Colorectum | colon adenocarcinoma | Female | <65 | I/II | Chemotherapy | folinic | CR |
| CALR | SNV | Missense_Mutation | | c.667N>A | p.Ala223Thr | p.A223T | P27797 | protein_coding | tolerated(0.38) | benign(0.228) | TCGA-CK-4951-01 | Colorectum | colon adenocarcinoma | Female | >=65 | I/II | Unknown | Unknown | PD |
| CALR | SNV | Missense_Mutation | rs746740154 | c.1231N>A | p.Gly411Ser | p.G411S | P27797 | protein_coding | tolerated_low_confidence(0.57) | benign(0.039) | TCGA-CM-6162-01 | Colorectum | colon adenocarcinoma | Female | <65 | III/IV | Chemotherapy | oxaliplatin | SD |
| CALR | deletion | Frame_Shift_Del | | c.791delC | p.Pro264GlnfsTer2 | p.P264Qfs*2 | P27797 | protein_coding | | | TCGA-D5-6927-01 | Colorectum | colon adenocarcinoma | Male | <65 | I/II | Unknown | Unknown | SD |
| Entrez ID | Symbol | Category | Interaction Types | Drug Claim Name | Drug Name | PMIDs |
| 811 | CALR | EXTERNAL SIDE OF PLASMA MEMBRANE, CELL SURFACE, CLINICALLY ACTIONABLE, NUCLEAR HORMONE RECEPTOR, DRUGGABLE GENOME | | RETINOIC ACID | | 9013706 |
| 811 | CALR | EXTERNAL SIDE OF PLASMA MEMBRANE, CELL SURFACE, CLINICALLY ACTIONABLE, NUCLEAR HORMONE RECEPTOR, DRUGGABLE GENOME | | OLTIPRAZ | OLTIPRAZ | 15961673 |
| 811 | CALR | EXTERNAL SIDE OF PLASMA MEMBRANE, CELL SURFACE, CLINICALLY ACTIONABLE, NUCLEAR HORMONE RECEPTOR, DRUGGABLE GENOME | | GENTAMICIN | GENTAMICIN | 15351734 |
| 811 | CALR | EXTERNAL SIDE OF PLASMA MEMBRANE, CELL SURFACE, CLINICALLY ACTIONABLE, NUCLEAR HORMONE RECEPTOR, DRUGGABLE GENOME | | GLUCOCORTICOID | | 8910610,8107808 |
| 811 | CALR | EXTERNAL SIDE OF PLASMA MEMBRANE, CELL SURFACE, CLINICALLY ACTIONABLE, NUCLEAR HORMONE RECEPTOR, DRUGGABLE GENOME | | ANTIANGIOGENIC | | 10498619 |
| 811 | CALR | EXTERNAL SIDE OF PLASMA MEMBRANE, CELL SURFACE, CLINICALLY ACTIONABLE, NUCLEAR HORMONE RECEPTOR, DRUGGABLE GENOME | | PEGINTERFERON ALFA-2A | | 26486786 |
| 811 | CALR | EXTERNAL SIDE OF PLASMA MEMBRANE, CELL SURFACE, CLINICALLY ACTIONABLE, NUCLEAR HORMONE RECEPTOR, DRUGGABLE GENOME | | Alpha 2 Interferon | | 26486786 |
| 811 | CALR | EXTERNAL SIDE OF PLASMA MEMBRANE, CELL SURFACE, CLINICALLY ACTIONABLE, NUCLEAR HORMONE RECEPTOR, DRUGGABLE GENOME | | VACCINIA VACCINE | | 15364449 |
| 811 | CALR | EXTERNAL SIDE OF PLASMA MEMBRANE, CELL SURFACE, CLINICALLY ACTIONABLE, NUCLEAR HORMONE RECEPTOR, DRUGGABLE GENOME | | RETINOID | | 9013706 |
| 811 | CALR | EXTERNAL SIDE OF PLASMA MEMBRANE, CELL SURFACE, CLINICALLY ACTIONABLE, NUCLEAR HORMONE RECEPTOR, DRUGGABLE GENOME | | N/A | | 26697989,25873496,26071474,26449662 |


