| Tissue | Expression Dynamics | Abbreviation |
| Breast | 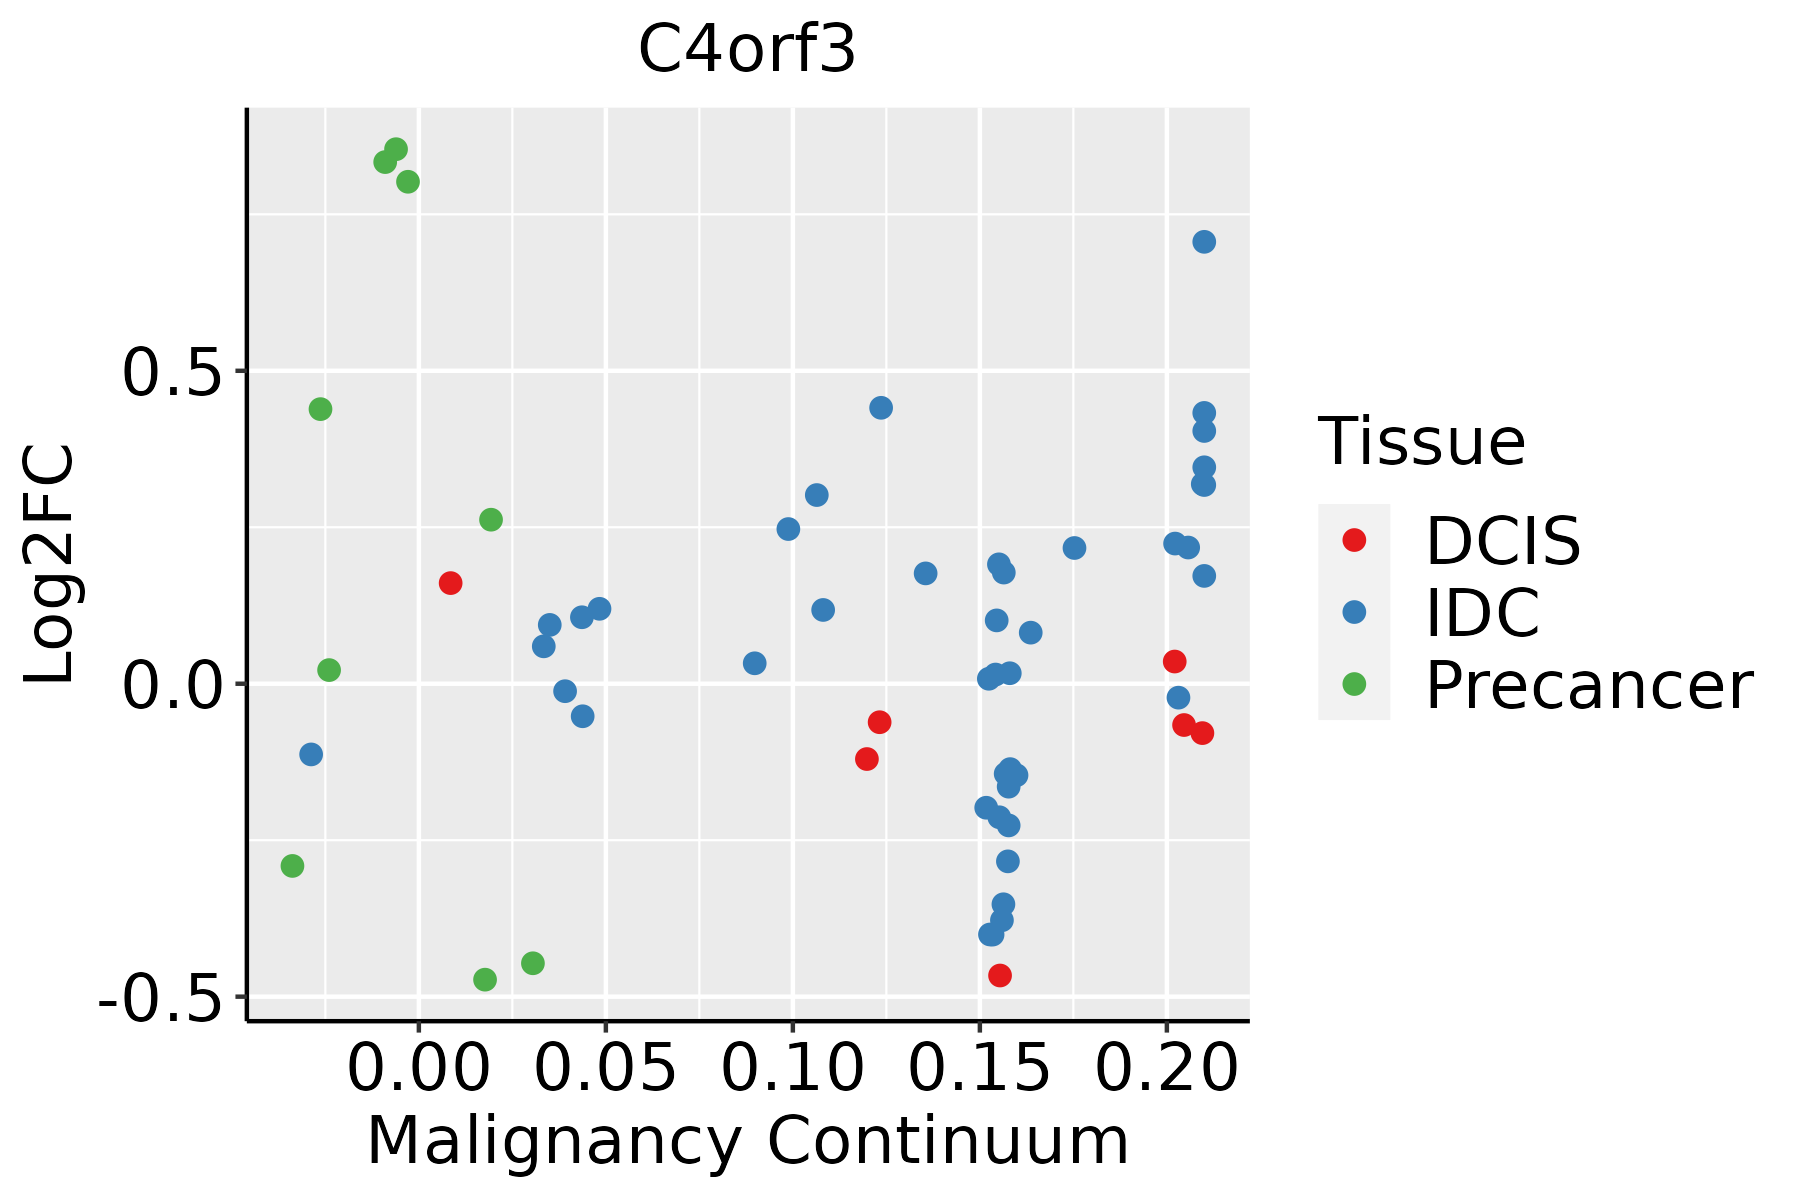 | IDC: Invasive ductal carcinoma |
| DCIS: Ductal carcinoma in situ |
| Precancer(BRCA1-mut): Precancerous lesion from BRCA1 mutation carriers |
| Cervix | 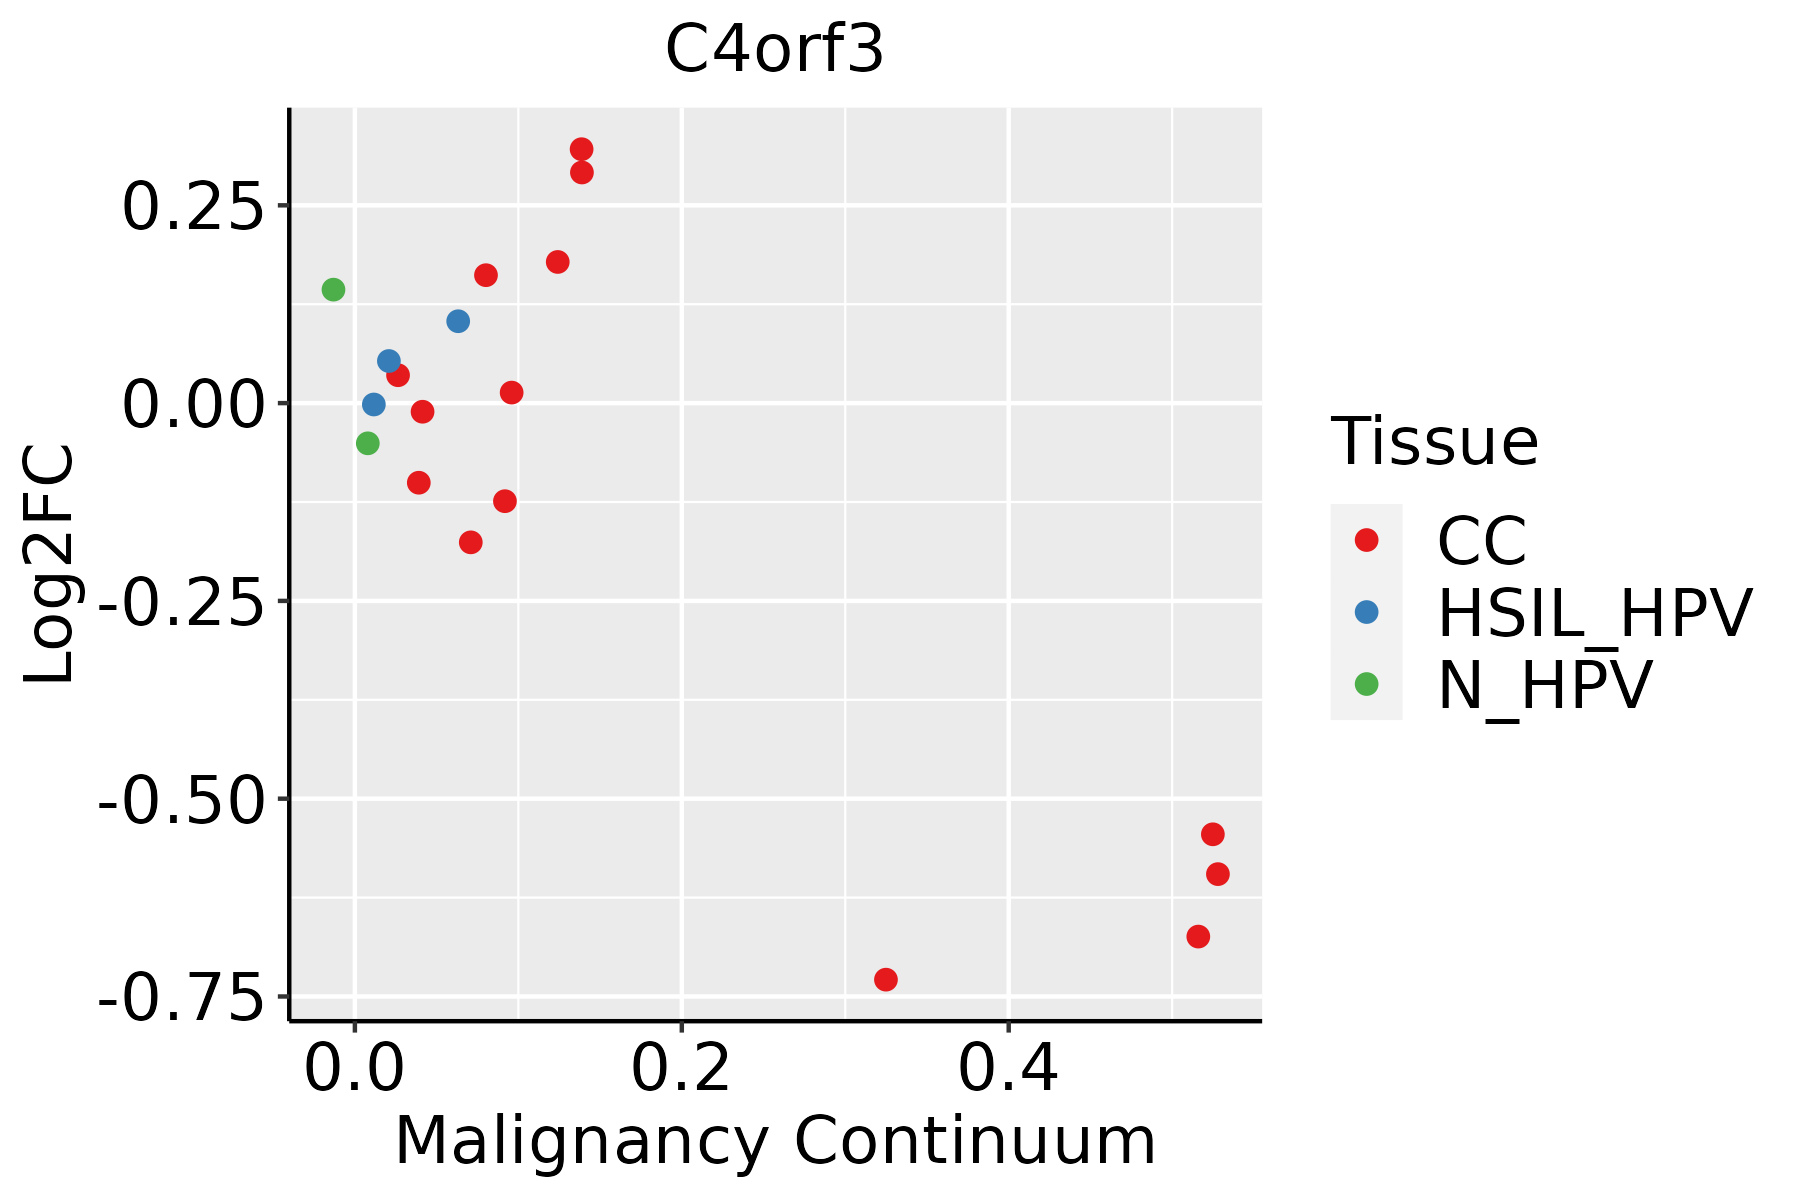 | CC: Cervix cancer |
| HSIL_HPV: HPV-infected high-grade squamous intraepithelial lesions |
| N_HPV: HPV-infected normal cervix |
| Colorectum (GSE201348) |  | FAP: Familial adenomatous polyposis |
| CRC: Colorectal cancer |
| Colorectum (HTA11) |  | AD: Adenomas |
| SER: Sessile serrated lesions |
| MSI-H: Microsatellite-high colorectal cancer |
| MSS: Microsatellite stable colorectal cancer |
| Endometrium |  | AEH: Atypical endometrial hyperplasia |
| EEC: Endometrioid Cancer |
| Esophagus |  | ESCC: Esophageal squamous cell carcinoma |
| HGIN: High-grade intraepithelial neoplasias |
| LGIN: Low-grade intraepithelial neoplasias |
| Liver | 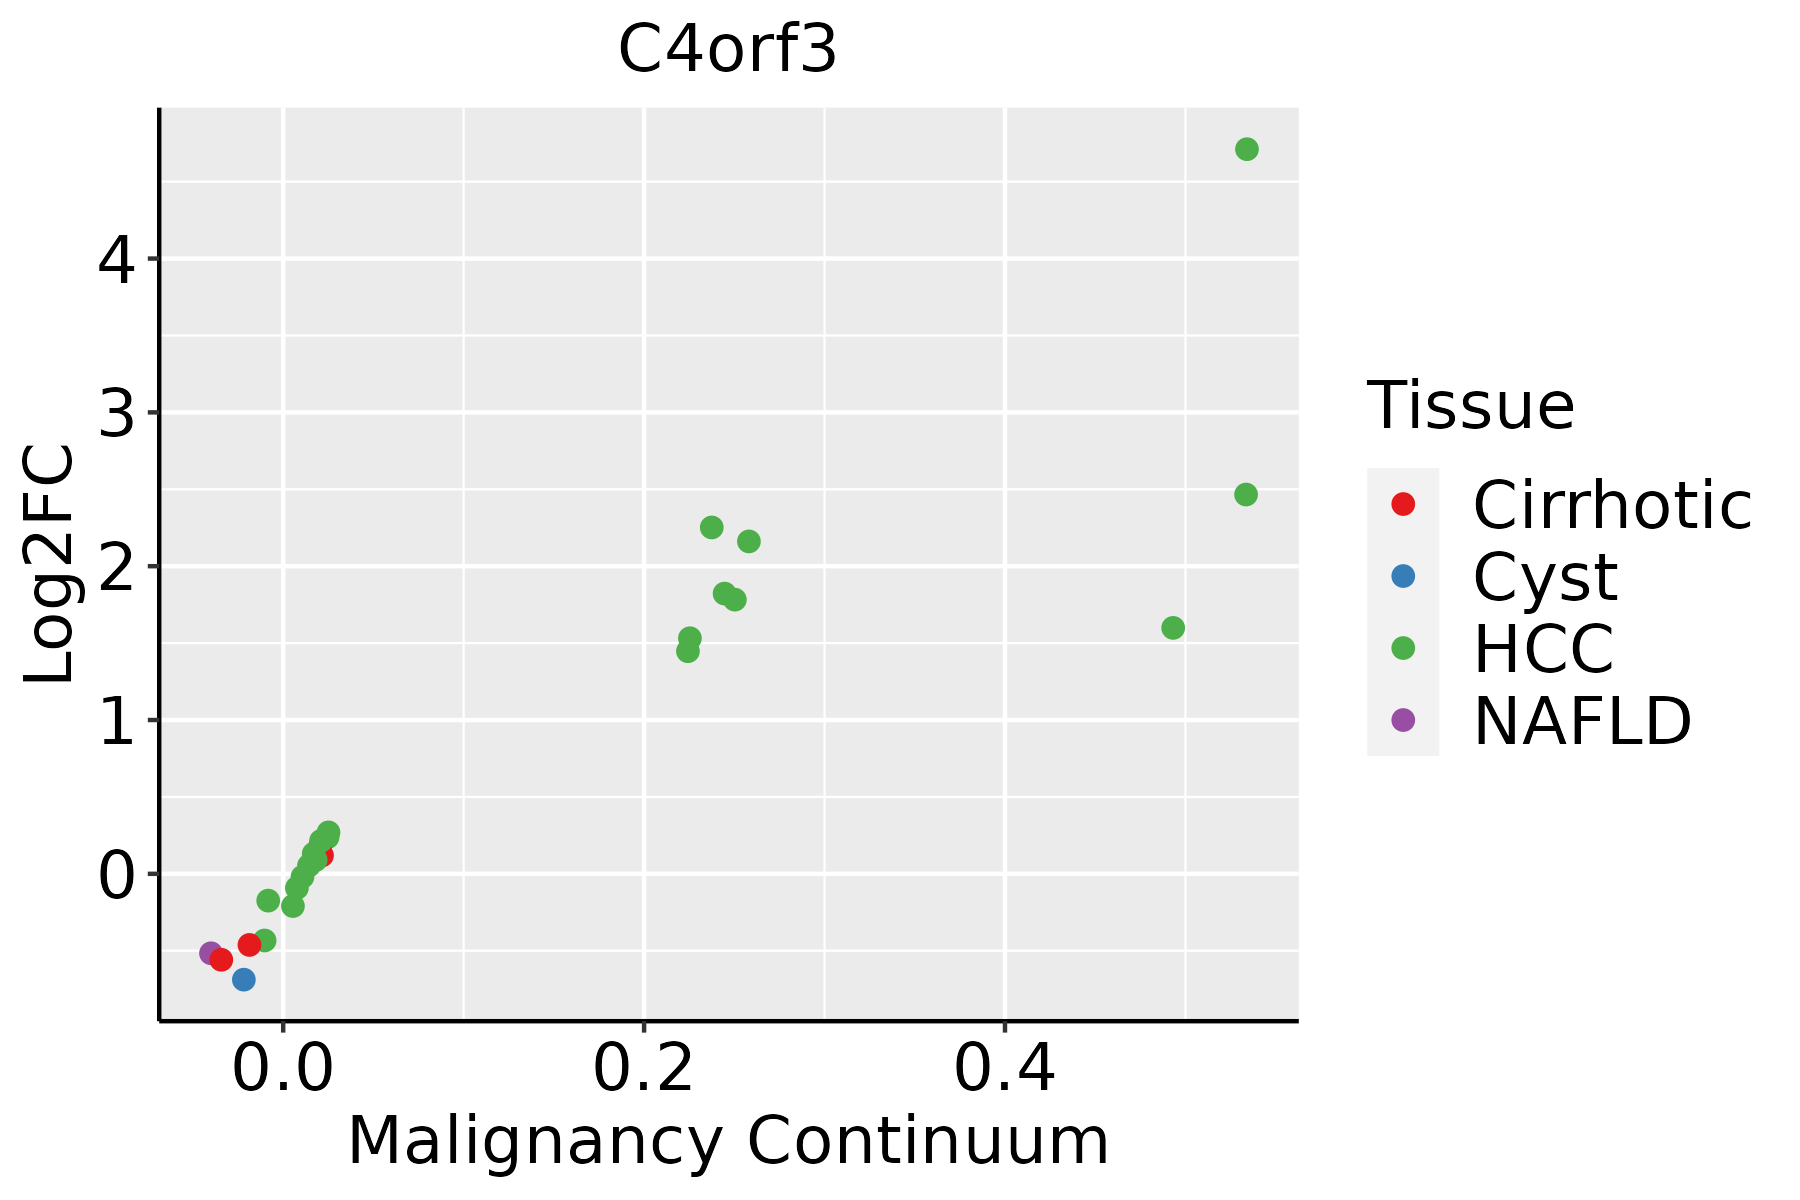 | HCC: Hepatocellular carcinoma |
| NAFLD: Non-alcoholic fatty liver disease |
| Oral Cavity | 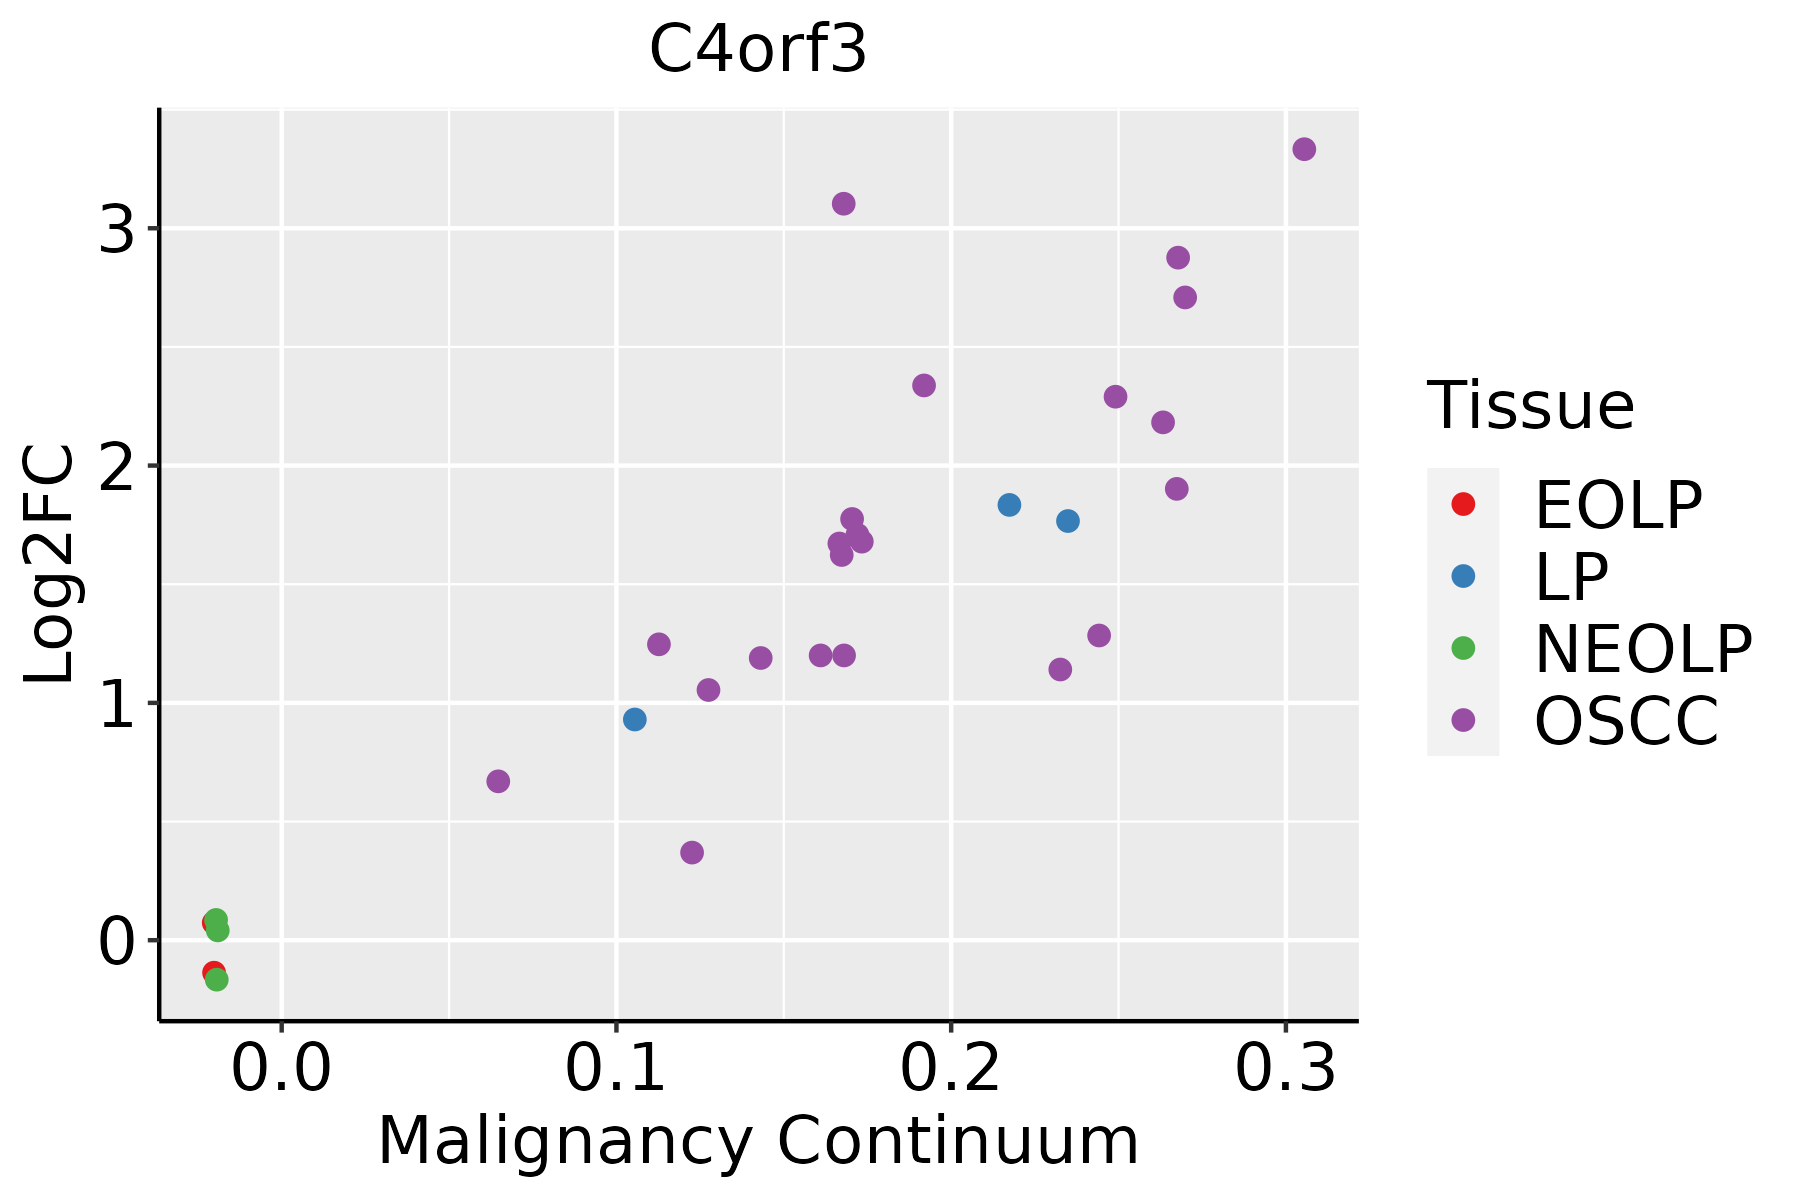 | EOLP: Erosive Oral lichen planus |
| LP: leukoplakia |
| NEOLP: Non-erosive oral lichen planus |
| OSCC: Oral squamous cell carcinoma |
| Prostate | 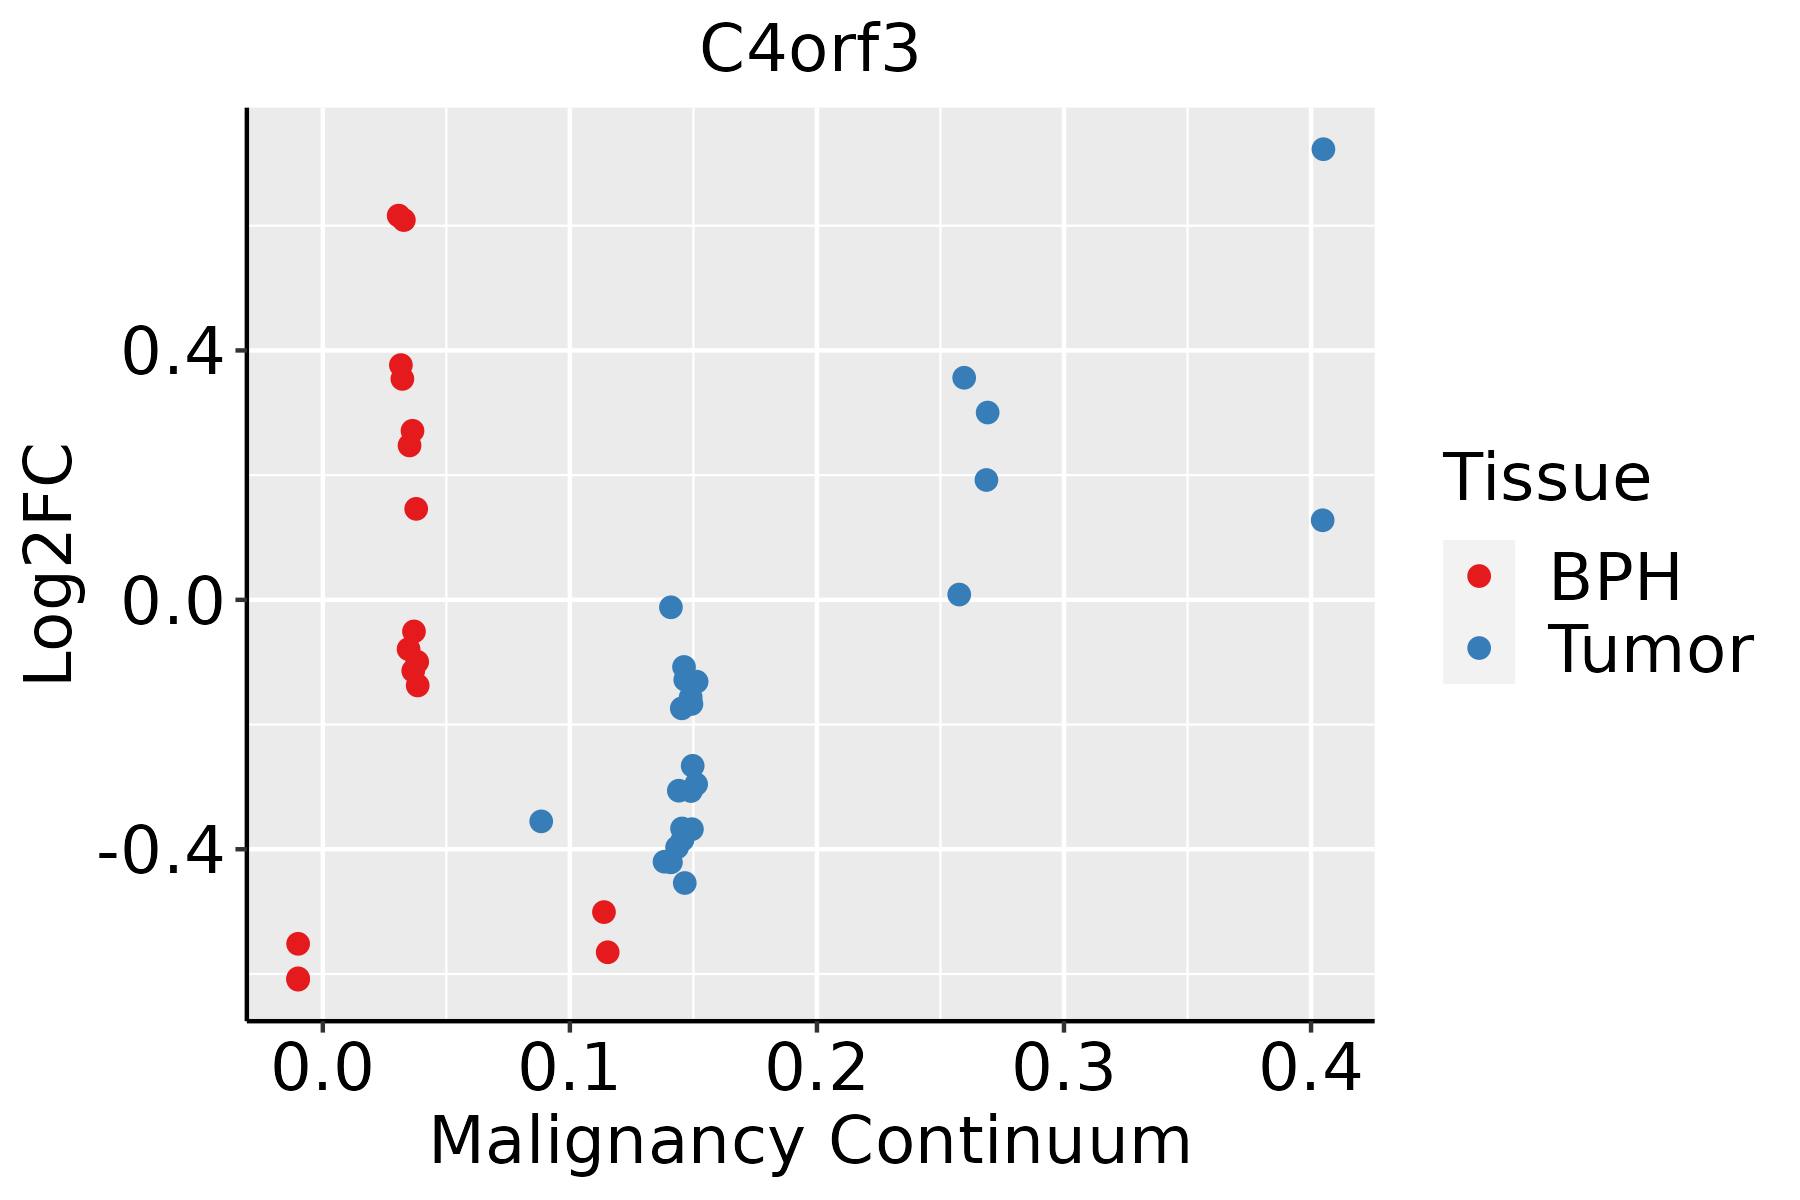 | BPH: Benign Prostatic Hyperplasia |
| Skin | 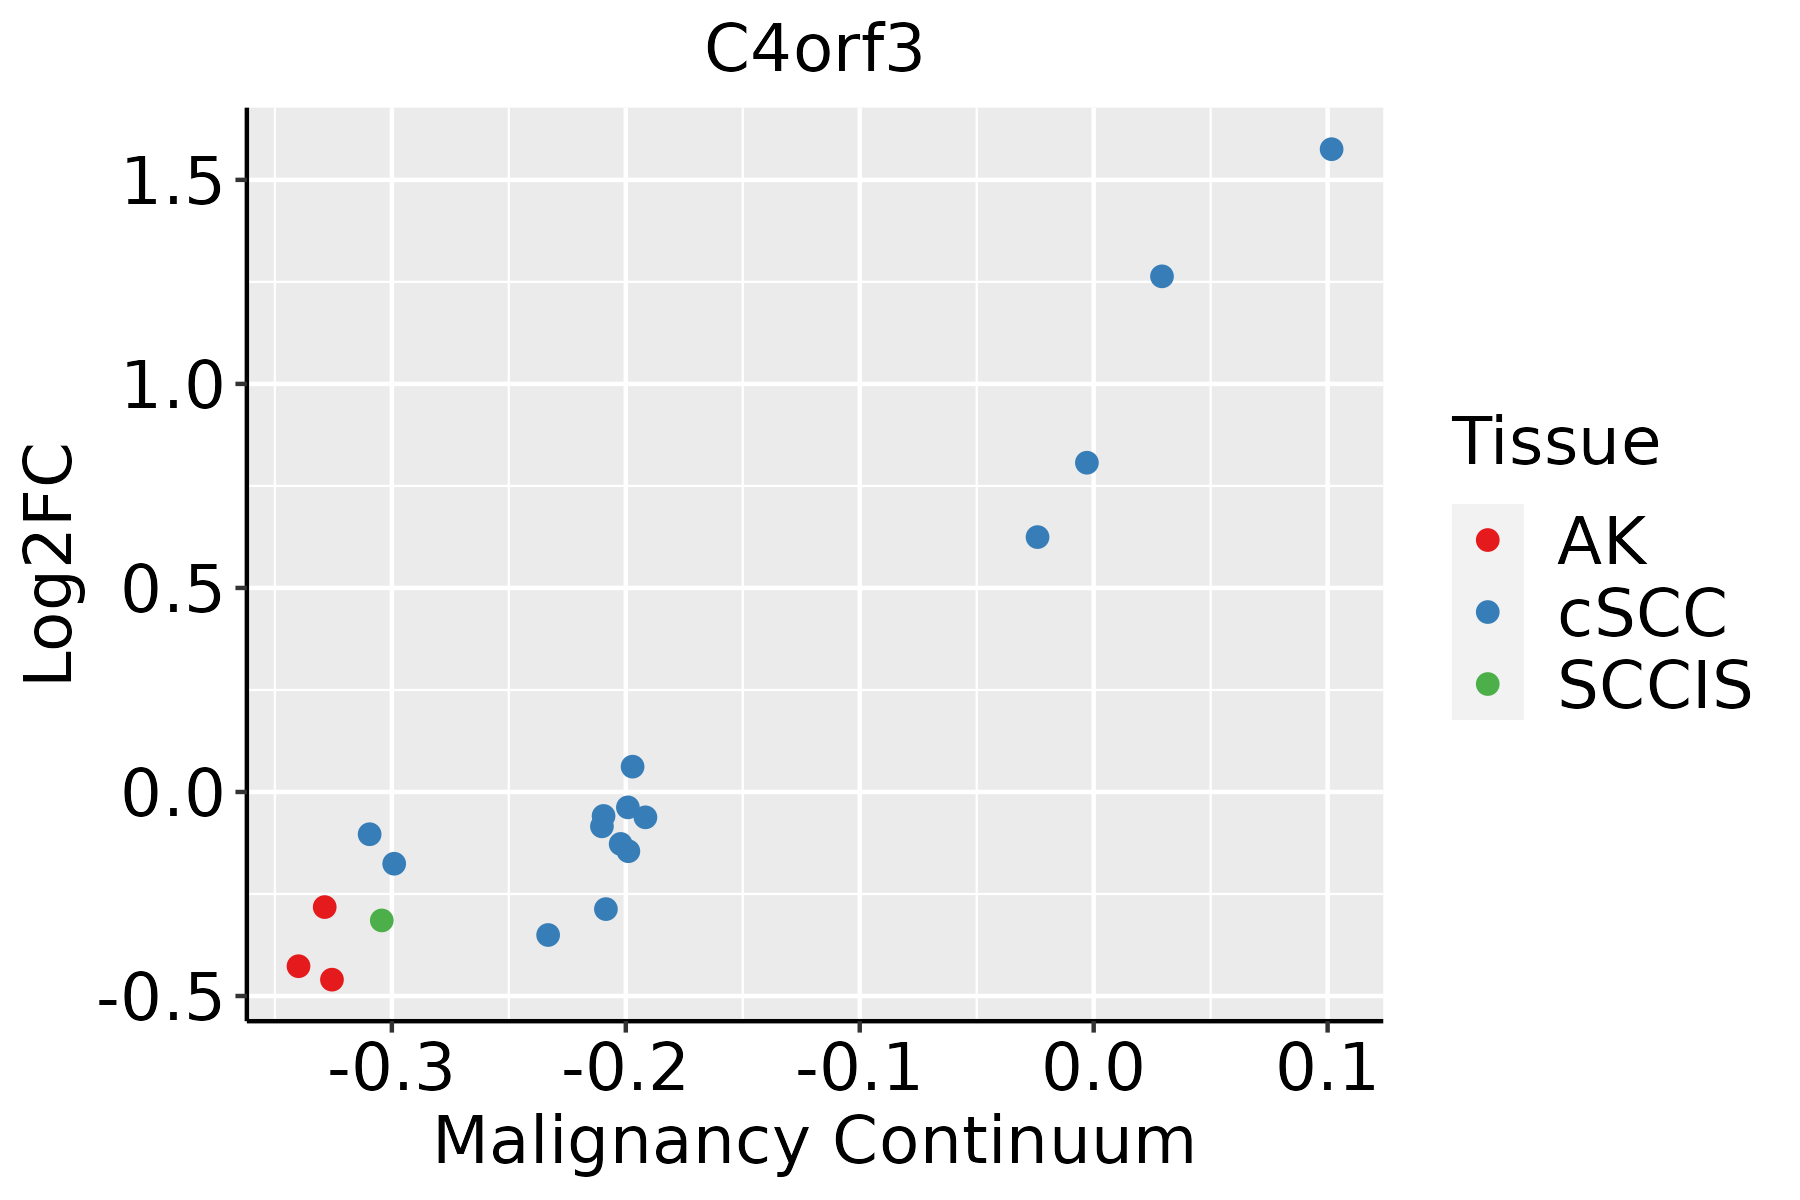 | AK: Actinic keratosis |
| cSCC: Cutaneous squamous cell carcinoma |
| SCCIS:squamous cell carcinoma in situ |
| Thyroid |  | ATC: Anaplastic thyroid cancer |
| HT: Hashimoto's thyroiditis |
| PTC: Papillary thyroid cancer |
| GO ID | Tissue | Disease Stage | Description | Gene Ratio | Bg Ratio | pvalue | p.adjust | Count |
| GO:1904063 | Endometrium | AEH | negative regulation of cation transmembrane transport | 20/2100 | 102/18723 | 8.88e-03 | 4.82e-02 | 20 |
| GO:19040623 | Endometrium | AEH | regulation of cation transmembrane transport | 55/2100 | 357/18723 | 9.18e-03 | 4.96e-02 | 55 |
| GO:005109817 | Endometrium | EEC | regulation of binding | 83/2168 | 363/18723 | 6.72e-10 | 6.61e-08 | 83 |
| GO:005110016 | Endometrium | EEC | negative regulation of binding | 35/2168 | 162/18723 | 1.85e-04 | 2.26e-03 | 35 |
| GO:005105111 | Endometrium | EEC | negative regulation of transport | 80/2168 | 470/18723 | 2.53e-04 | 2.93e-03 | 80 |
| GO:001095914 | Endometrium | EEC | regulation of metal ion transport | 70/2168 | 406/18723 | 4.12e-04 | 4.35e-03 | 70 |
| GO:00347661 | Endometrium | EEC | negative regulation of ion transmembrane transport | 22/2168 | 109/18723 | 6.39e-03 | 3.76e-02 | 22 |
| GO:005109825 | Esophagus | HGIN | regulation of binding | 78/2587 | 363/18723 | 3.73e-05 | 9.30e-04 | 78 |
| GO:005110020 | Esophagus | HGIN | negative regulation of binding | 35/2587 | 162/18723 | 4.32e-03 | 3.84e-02 | 35 |
| GO:0051098111 | Esophagus | ESCC | regulation of binding | 251/8552 | 363/18723 | 6.73e-20 | 8.46e-18 | 251 |
| GO:0051100111 | Esophagus | ESCC | negative regulation of binding | 109/8552 | 162/18723 | 2.10e-08 | 4.03e-07 | 109 |
| GO:005109812 | Liver | Cirrhotic | regulation of binding | 148/4634 | 363/18723 | 9.14e-12 | 5.97e-10 | 148 |
| GO:00511006 | Liver | Cirrhotic | negative regulation of binding | 63/4634 | 162/18723 | 4.54e-05 | 5.31e-04 | 63 |
| GO:00510514 | Liver | Cirrhotic | negative regulation of transport | 141/4634 | 470/18723 | 5.06e-03 | 2.62e-02 | 141 |
| GO:005109822 | Liver | HCC | regulation of binding | 225/7958 | 363/18723 | 3.78e-14 | 2.37e-12 | 225 |
| GO:005110012 | Liver | HCC | negative regulation of binding | 94/7958 | 162/18723 | 4.69e-05 | 4.50e-04 | 94 |
| GO:005109832 | Liver | Cyst | regulation of binding | 21/496 | 363/18723 | 7.29e-04 | 1.98e-02 | 21 |
| GO:00228983 | Liver | Cyst | regulation of transmembrane transporter activity | 17/496 | 278/18723 | 1.26e-03 | 3.10e-02 | 17 |
| GO:00324094 | Liver | Cyst | regulation of transporter activity | 18/496 | 310/18723 | 1.64e-03 | 3.78e-02 | 18 |
| GO:00324123 | Liver | Cyst | regulation of ion transmembrane transporter activity | 16/496 | 267/18723 | 2.12e-03 | 4.38e-02 | 16 |
| Hugo Symbol | Variant Class | Variant Classification | dbSNP RS | HGVSc | HGVSp | HGVSp Short | SWISSPROT | BIOTYPE | SIFT | PolyPhen | Tumor Sample Barcode | Tissue | Histology | Sex | Age | Stage | Therapy Types | Drugs | Outcome |
| C4orf3 | SNV | Missense_Mutation | novel | c.397G>A | p.Glu133Lys | p.E133K | Q8WVX3 | protein_coding | tolerated_low_confidence(0.06) | possibly_damaging(0.497) | TCGA-A7-A6VY-01 | Breast | breast invasive carcinoma | Female | <65 | I/II | Chemotherapy | cyclophosphamide | CR |
| C4orf3 | SNV | Missense_Mutation | | c.452N>C | p.Arg151Pro | p.R151P | Q8WVX3 | protein_coding | deleterious_low_confidence(0) | probably_damaging(0.935) | TCGA-AN-A0XW-01 | Breast | breast invasive carcinoma | Female | <65 | III/IV | Unknown | Unknown | SD |
| C4orf3 | SNV | Missense_Mutation | | c.353T>G | p.Leu118Arg | p.L118R | Q8WVX3 | protein_coding | deleterious_low_confidence(0) | benign(0.003) | TCGA-AR-A2LE-01 | Breast | breast invasive carcinoma | Female | >=65 | I/II | Hormone Therapy | tamoxiphen | PD |
| C4orf3 | SNV | Missense_Mutation | | c.383N>A | p.Arg128Gln | p.R128Q | Q8WVX3 | protein_coding | tolerated_low_confidence(0.05) | benign(0) | TCGA-EK-A3GK-01 | Cervix | cervical & endocervical cancer | Female | <65 | I/II | Unknown | Unknown | SD |
| C4orf3 | SNV | Missense_Mutation | | c.591T>G | p.Phe197Leu | p.F197L | Q8WVX3 | protein_coding | tolerated_low_confidence(0.27) | benign(0) | TCGA-AA-3510-01 | Colorectum | colon adenocarcinoma | Male | >=65 | I/II | Unknown | Unknown | SD |
| C4orf3 | SNV | Missense_Mutation | novel | c.349N>A | p.Glu117Lys | p.E117K | Q8WVX3 | protein_coding | tolerated_low_confidence(0.12) | possibly_damaging(0.497) | TCGA-AZ-4315-01 | Colorectum | colon adenocarcinoma | Male | <65 | I/II | Unknown | Unknown | SD |
| C4orf3 | insertion | Frame_Shift_Ins | rs760121305 | c.593_594insT | p.Leu198PhefsTer20 | p.L198Ffs*20 | Q8WVX3 | protein_coding | | | TCGA-A6-5661-01 | Colorectum | colon adenocarcinoma | Female | >=65 | I/II | Unknown | Unknown | SD |
| C4orf3 | SNV | Missense_Mutation | rs767655670 | c.560T>C | p.Phe187Ser | p.F187S | Q8WVX3 | protein_coding | deleterious_low_confidence(0) | possibly_damaging(0.466) | TCGA-A5-A0GP-01 | Endometrium | uterine corpus endometrioid carcinoma | Female | <65 | I/II | Unknown | Unknown | SD |
| C4orf3 | SNV | Missense_Mutation | novel | c.473G>T | p.Arg158Met | p.R158M | Q8WVX3 | protein_coding | deleterious_low_confidence(0) | benign(0.391) | TCGA-AP-A05O-01 | Endometrium | uterine corpus endometrioid carcinoma | Female | >=65 | I/II | Chemotherapy | carboplatin | PD |
| C4orf3 | SNV | Missense_Mutation | rs772979807 | c.88N>C | p.Tyr30His | p.Y30H | Q8WVX3 | protein_coding | | possibly_damaging(0.617) | TCGA-AX-A0J0-01 | Endometrium | uterine corpus endometrioid carcinoma | Female | <65 | I/II | Unknown | Unknown | SD |


