Schematic overview of the cellular and molecular mechanisms involved in the cancer progression, including the proposed cellular and molecular mechanisms in cancer cells trajectory. AT1: alveolar type 1 cells; AT2: alveolar type 2 cells; AAH: atypical adenomatous hyperplasia; AIS: adenocarcinoma in situ; MIA: minimally invasive adenocarcinoma; IA: invasive adenocarcinoma; EMT: epithelial-mesenchymal transition

Home

Download

Statistics

Help

Contact

Center for Computational Systems Medicine
leaf

Gene summary

leaf

Malignant transformation analysis

leaf

Malignant transformation related pathway analysis

leaf

Cell-cell communication analysis

leaf

Single-cell gene regulatory network inference analysis

leaf

Somatic mutation of malignant transformation related genes

leaf

Related drugs of malignant transformation related genes

Gene: C20orf27

Gene summary for C20ORF27

check button Gene summary.

Gene informationSpeciesHuman
Gene symbol

C20orf27

Gene ID

54976

Gene namechromosome 20 open reading frame 27
Gene AliasC20orf27
Cytomap20p13
Gene Typeprotein-coding
GO ID

GO:0007154

UniProtAcc

Q9GZN8


Top

Malignant transformation analysis

check button Identification of the aberrant gene expression in precancerous and cancerous lesions by comparing the gene expression of stem-like cells in diseased tissues with normal stem cells
check button Malignant transformation involving gene list.
Entrez IDSymbolReplicatesSpeciesOrganTissueAdj P-valueLog2FCMalignancy
54976C20orf27AEH-subject1HumanEndometriumAEH5.29e-31-5.18e-01-0.3059
54976C20orf27AEH-subject2HumanEndometriumAEH2.82e-19-4.57e-01-0.2525
54976C20orf27AEH-subject3HumanEndometriumAEH1.20e-20-4.74e-01-0.2576
54976C20orf27AEH-subject4HumanEndometriumAEH3.12e-18-4.89e-01-0.2657
54976C20orf27AEH-subject5HumanEndometriumAEH3.30e-19-4.71e-01-0.2953
54976C20orf27EEC-subject1HumanEndometriumEEC2.79e-23-4.84e-01-0.2682
54976C20orf27EEC-subject2HumanEndometriumEEC3.21e-25-5.05e-01-0.2607
54976C20orf27EEC-subject3HumanEndometriumEEC3.81e-38-4.79e-01-0.2525
54976C20orf27EEC-subject4HumanEndometriumEEC5.12e-16-4.25e-01-0.2571
54976C20orf27EEC-subject5HumanEndometriumEEC4.99e-19-4.59e-01-0.249
54976C20orf27GSM5276934HumanEndometriumEEC2.02e-10-3.26e-01-0.0913
54976C20orf27GSM5276935HumanEndometriumEEC1.28e-11-4.07e-01-0.123
54976C20orf27GSM5276937HumanEndometriumEEC6.50e-16-4.45e-01-0.0897
54976C20orf27GSM6177620_NYU_UCEC1_lib1_lib1HumanEndometriumEEC6.61e-25-4.49e-01-0.1869
54976C20orf27GSM6177620_NYU_UCEC1_lib2_lib2HumanEndometriumEEC2.57e-20-5.08e-01-0.1875
54976C20orf27GSM6177620_NYU_UCEC1_lib3_lib3HumanEndometriumEEC9.09e-24-4.16e-01-0.1883
54976C20orf27GSM6177621_NYU_UCEC2_lib1_lib1HumanEndometriumEEC1.24e-26-4.01e-01-0.1934
54976C20orf27GSM6177622_NYU_UCEC3_lib1_lib1HumanEndometriumEEC1.89e-29-5.01e-01-0.1917
54976C20orf27GSM6177622_NYU_UCEC3_lib2_lib2HumanEndometriumEEC2.01e-38-4.40e-01-0.1916
54976C20orf27GSM6177623_NYU_UCEC3_VisHumanEndometriumEEC3.54e-04-2.49e-01-0.1269
Page: 1 2 3 4 5 6 7 

check button Transcriptomic changes along malignancy continuum.
TissueExpression DynamicsAbbreviation
EndometriumThe image shows the transcriptomic changes along malignancy continuum.log2FC in expression of this searched gene in stem-like cells from each diseased tissue sample relative to stem-like cells in normal samples in each tissue plotted against the malignancy continuum. Samples are colored based on if they are from different disease stage.
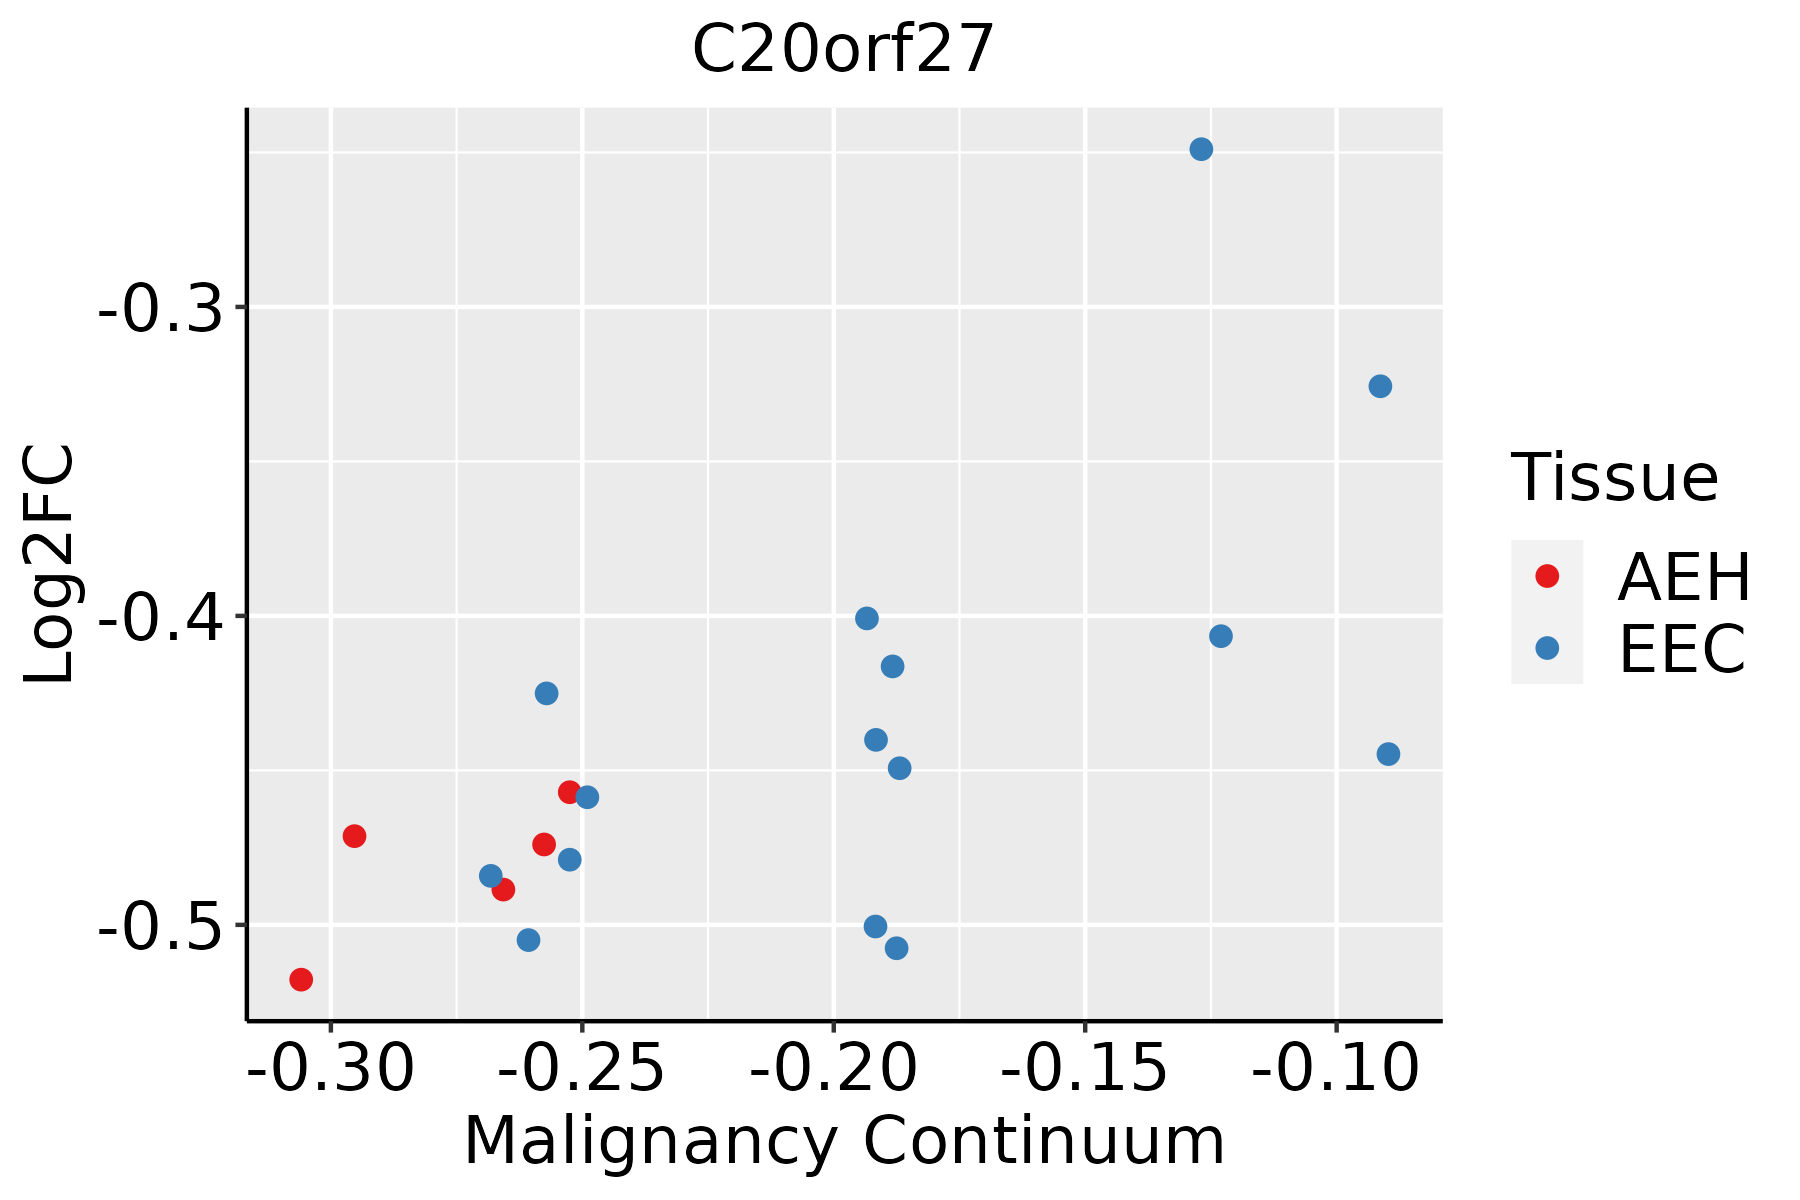
AEH: Atypical endometrial hyperplasia
EEC: Endometrioid Cancer
EsophagusThe image shows the transcriptomic changes along malignancy continuum.log2FC in expression of this searched gene in stem-like cells from each diseased tissue sample relative to stem-like cells in normal samples in each tissue plotted against the malignancy continuum. Samples are colored based on if they are from different disease stage.ESCC: Esophageal squamous cell carcinoma
HGIN: High-grade intraepithelial neoplasias
LGIN: Low-grade intraepithelial neoplasias
LiverThe image shows the transcriptomic changes along malignancy continuum.log2FC in expression of this searched gene in stem-like cells from each diseased tissue sample relative to stem-like cells in normal samples in each tissue plotted against the malignancy continuum. Samples are colored based on if they are from different disease stage.
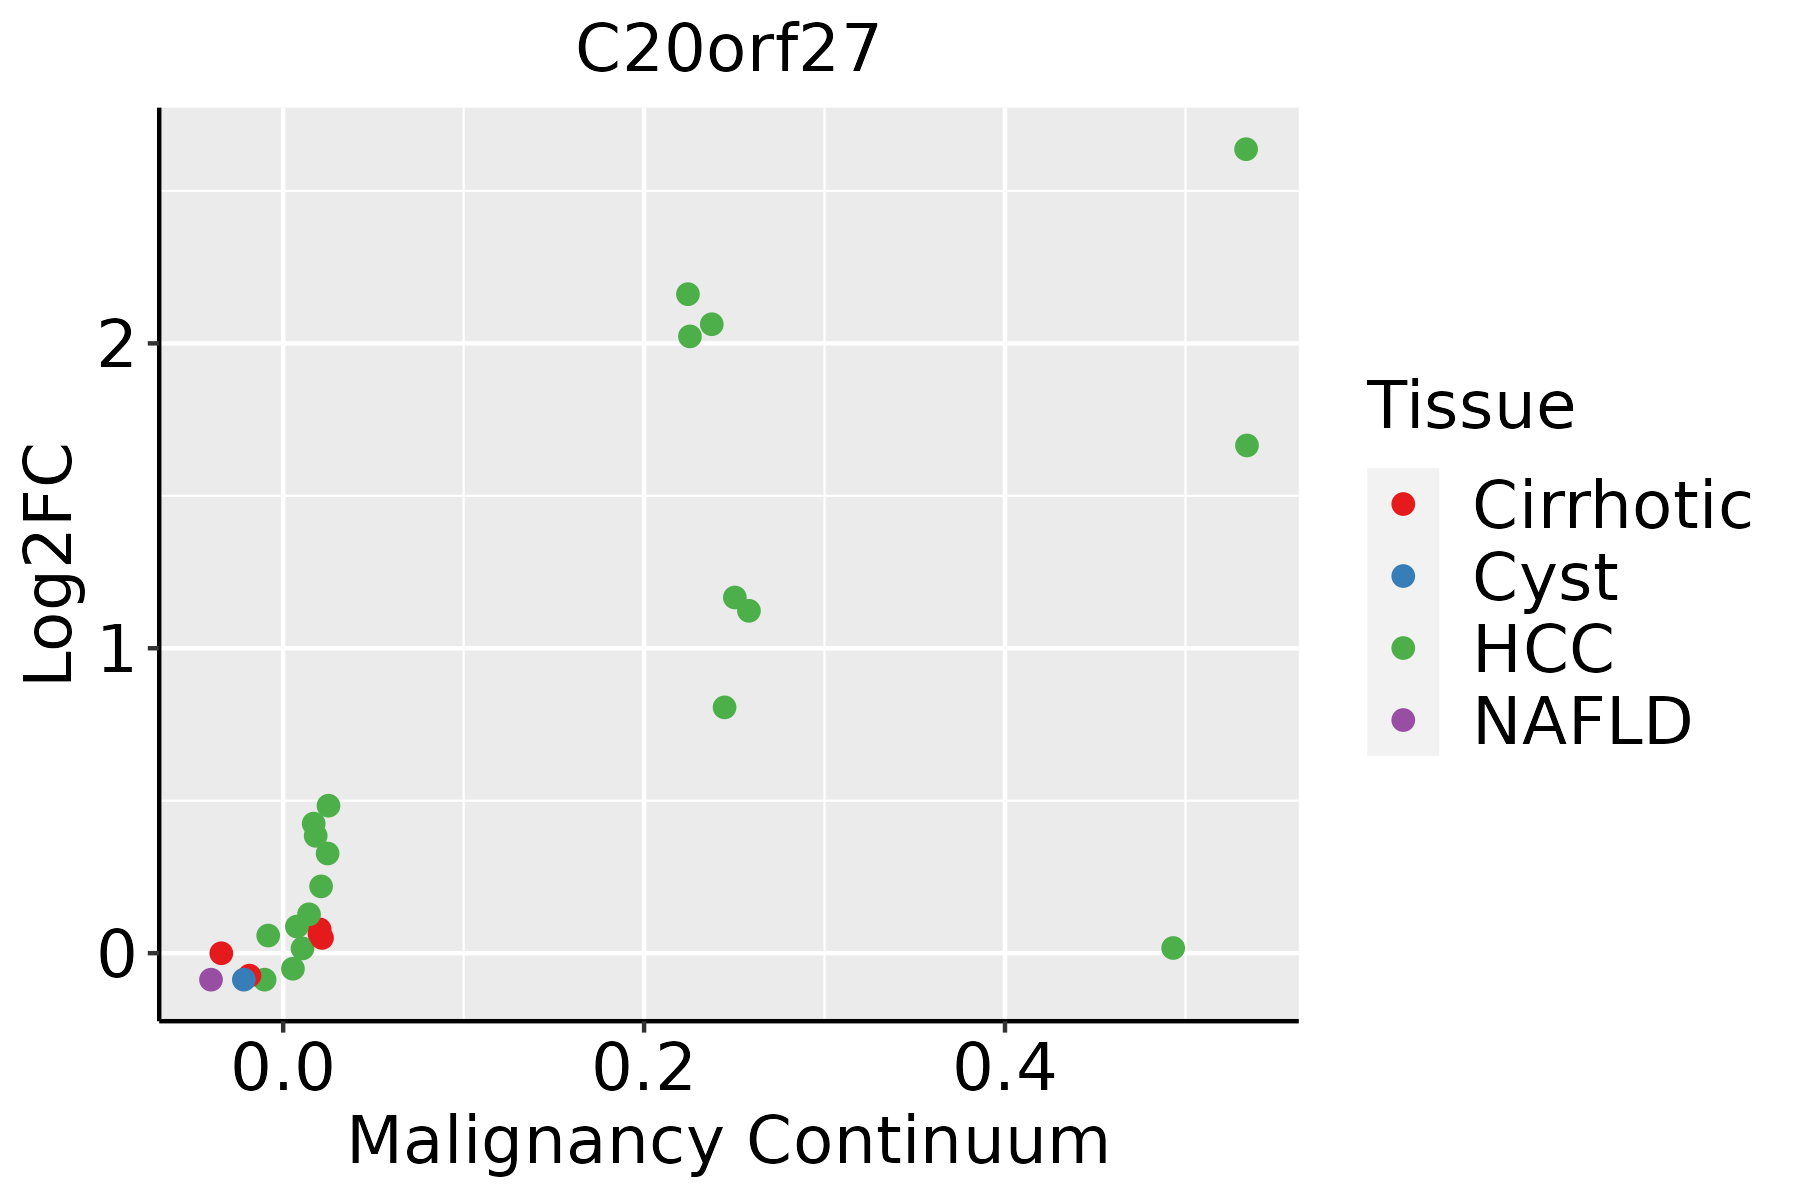
HCC: Hepatocellular carcinoma
NAFLD: Non-alcoholic fatty liver disease
Oral CavityThe image shows the transcriptomic changes along malignancy continuum.log2FC in expression of this searched gene in stem-like cells from each diseased tissue sample relative to stem-like cells in normal samples in each tissue plotted against the malignancy continuum. Samples are colored based on if they are from different disease stage.EOLP: Erosive Oral lichen planus
LP: leukoplakia
NEOLP: Non-erosive oral lichen planus
OSCC: Oral squamous cell carcinoma
SkinThe image shows the transcriptomic changes along malignancy continuum.log2FC in expression of this searched gene in stem-like cells from each diseased tissue sample relative to stem-like cells in normal samples in each tissue plotted against the malignancy continuum. Samples are colored based on if they are from different disease stage.
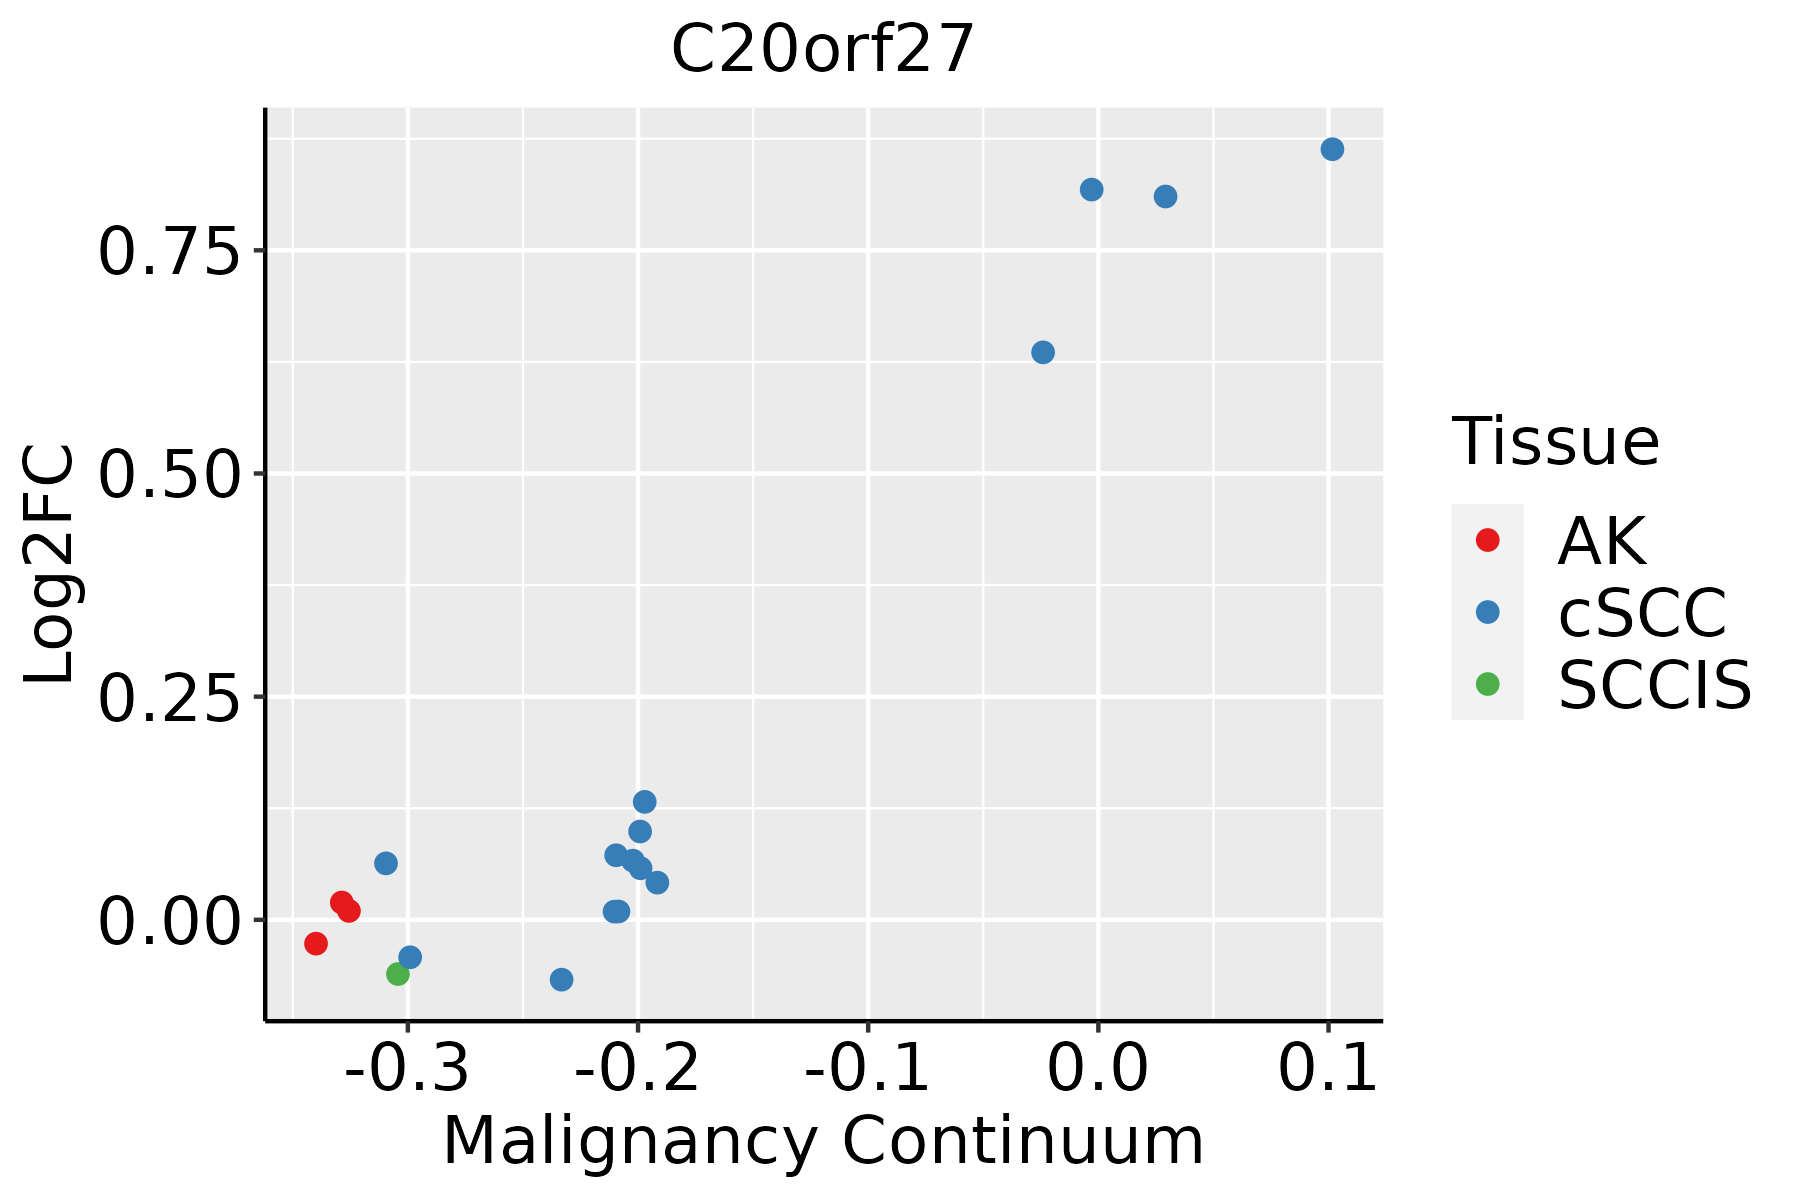
AK: Actinic keratosis
cSCC: Cutaneous squamous cell carcinoma
SCCIS:squamous cell carcinoma in situ
ThyroidThe image shows the transcriptomic changes along malignancy continuum.log2FC in expression of this searched gene in stem-like cells from each diseased tissue sample relative to stem-like cells in normal samples in each tissue plotted against the malignancy continuum. Samples are colored based on if they are from different disease stage.ATC: Anaplastic thyroid cancer
HT: Hashimoto's thyroiditis
PTC: Papillary thyroid cancer
∗log2FC in expression of this searched gene in stem-like cells from each diseased tissue sample relative to stem-like cells in normal samples in each tissue plotted against the malignancy continuum. Samples are colored based on if they are from different disease stage.

Top

Malignant transformation related pathway analysis

check buttonFind out the enriched GO biological processes and KEGG pathways involved in transition from healthy to precancer to cancer
check button Figure of enriched GO biological processes.
TissueDisease StageEnriched GO biological Processes
ColorectumADGO analysis - Figure of enriched GO biological processes: Top 15 enriched GO BP terms are showed in the bar plot of each disease state in each tissue. Each row represents a significant GO biological process which is colored according to the -log10(p.adjust).
ColorectumSERGO analysis - Figure of enriched GO biological processes: Top 15 enriched GO BP terms are showed in the bar plot of each disease state in each tissue. Each row represents a significant GO biological process which is colored according to the -log10(p.adjust).
ColorectumMSSGO analysis - Figure of enriched GO biological processes: Top 15 enriched GO BP terms are showed in the bar plot of each disease state in each tissue. Each row represents a significant GO biological process which is colored according to the -log10(p.adjust).
ColorectumMSI-HGO analysis - Figure of enriched GO biological processes: Top 15 enriched GO BP terms are showed in the bar plot of each disease state in each tissue. Each row represents a significant GO biological process which is colored according to the -log10(p.adjust).
ColorectumFAPGO analysis - Figure of enriched GO biological processes: Top 15 enriched GO BP terms are showed in the bar plot of each disease state in each tissue. Each row represents a significant GO biological process which is colored according to the -log10(p.adjust).
∗Top 15 enriched GO BP terms are showed in the bar plot of each disease state in each tissue. Each row represents a significant GO biological process which is colored according to the -log10(p.adjust).
Page: 1 2 3 4 5 6 7 8 9 

check button Enriched GO biological processes.
GO IDTissueDisease StageDescriptionGene RatioBg Ratiopvaluep.adjustCount
GO:19038446Oral cavityOSCCregulation of cellular response to transforming growth factor beta stimulus72/7305131/187231.51e-041.06e-0372
GO:00305114Oral cavityOSCCpositive regulation of transforming growth factor beta receptor signaling pathway23/730532/187231.67e-041.14e-0323
GO:19038464Oral cavityOSCCpositive regulation of cellular response to transforming growth factor beta stimulus23/730532/187231.67e-041.14e-0323
GO:19012246Oral cavityOSCCpositive regulation of NIK/NF-kappaB signaling40/730569/187231.08e-035.56e-0340
GO:19012224Oral cavityOSCCregulation of NIK/NF-kappaB signaling59/7305112/187232.25e-031.00e-0259
GO:00071789Oral cavityOSCCtransmembrane receptor protein serine/threonine kinase signaling pathway165/7305355/187232.31e-031.02e-02165
GO:190122212Oral cavityLPregulation of NIK/NF-kappaB signaling44/4623112/187234.38e-044.19e-0344
GO:190122413Oral cavityLPpositive regulation of NIK/NF-kappaB signaling29/462369/187231.15e-039.40e-0329
GO:003806112Oral cavityLPNIK/NF-kappaB signaling52/4623143/187231.20e-039.66e-0352
GO:007155917SkincSCCresponse to transforming growth factor beta95/4864256/187235.21e-055.31e-0495
GO:007156025SkincSCCcellular response to transforming growth factor beta stimulus92/4864250/187239.65e-058.99e-0492
GO:19012248SkincSCCpositive regulation of NIK/NF-kappaB signaling30/486469/187231.19e-037.75e-0330
GO:000717917SkincSCCtransforming growth factor beta receptor signaling pathway69/4864198/187233.39e-031.84e-0269
GO:00380616SkincSCCNIK/NF-kappaB signaling52/4864143/187233.83e-032.05e-0252
GO:19012225SkincSCCregulation of NIK/NF-kappaB signaling42/4864112/187234.71e-032.40e-0242
GO:007155919ThyroidPTCresponse to transforming growth factor beta131/5968256/187239.20e-113.17e-09131
GO:007156019ThyroidPTCcellular response to transforming growth factor beta stimulus126/5968250/187237.34e-102.19e-08126
GO:000717919ThyroidPTCtransforming growth factor beta receptor signaling pathway104/5968198/187231.20e-093.47e-08104
GO:001701515ThyroidPTCregulation of transforming growth factor beta receptor signaling pathway69/5968128/187231.92e-073.51e-0669
GO:190384415ThyroidPTCregulation of cellular response to transforming growth factor beta stimulus70/5968131/187232.47e-074.31e-0670
Page: 1 2 3 4 5 

check button Enriched KEGG pathways.
Pathway IDTissueDisease StageDescriptionGene RatioBg Ratiopvaluep.adjustqvalueCount
Page: 1 

Top

Cell-cell communication analysis

check buttonIdentification of potential cell-cell interactions between two cell types and their ligand-receptor pairs for different disease states
LigandReceptorLRpairPathwayTissueDisease Stage
Page: 1 

Top

Single-cell gene regulatory network inference analysis

check buttonFind out the significant the regulons (TFs) and the target genes of each regulon across cell types for different disease states
TFCell TypeTissueDisease StageTarget GeneRSSRegulon Activity
∗The dot plots of a searched regulon are shown for all cell subpopulations in each disease state of each tissue based on the regulon specific score inferred using pySCENIC and by calculating the average expression.
Page: 1 

Top

Somatic mutation of malignant transformation related genes

check buttonAnnotation of somatic variants for genes involved in malignant transformation
Hugo SymbolVariant ClassVariant ClassificationdbSNP RSHGVScHGVSpHGVSp ShortSWISSPROTBIOTYPESIFTPolyPhenTumor Sample BarcodeTissueHistologySexAgeStageTherapy TypesDrugsOutcome
C20orf27insertionNonsense_Mutationnovelc.165_166insACCTGAGTTTCTTTTCTCTCAAGTGGAGACAATp.Val55_His56insThrTerValSerPheLeuSerSerGlyAspAsnp.V55_H56insT*VSFLSSGDNQ9GZN8protein_codingTCGA-AO-A0JB-01Breastbreast invasive carcinomaFemale<65III/IVChemotherapycyclophosphamideSD
C20orf27deletionFrame_Shift_Delnovelc.78delNp.Arg27GlyfsTer57p.R27Gfs*57Q9GZN8protein_codingTCGA-D8-A27V-01Breastbreast invasive carcinomaFemale<65I/IIHormone TherapytamoxiphenSD
C20orf27SNVMissense_Mutationc.283N>Gp.Leu95Valp.L95VQ9GZN8protein_codingtolerated(0.15)benign(0.391)TCGA-JW-A5VL-01Cervixcervical & endocervical cancerFemale<65I/IIUnknownUnknownSD
C20orf27SNVMissense_Mutationrs746348018c.155A>Cp.His52Prop.H52PQ9GZN8protein_codingtolerated(0.38)benign(0)TCGA-AA-3851-01Colorectumcolon adenocarcinomaMale>=65I/IIUnknownUnknownSD
C20orf27SNVMissense_Mutationnovelc.212N>Gp.Glu71Glyp.E71GQ9GZN8protein_codingdeleterious(0.02)possibly_damaging(0.744)TCGA-DM-A1DA-01Colorectumcolon adenocarcinomaFemale>=65III/IVUnknownUnknownSD
C20orf27SNVMissense_Mutationnovelc.374N>Cp.Glu125Alap.E125AQ9GZN8protein_codingdeleterious(0.01)benign(0.219)TCGA-AX-A0J0-01Endometriumuterine corpus endometrioid carcinomaFemale<65I/IIUnknownUnknownSD
C20orf27SNVMissense_Mutationrs746711207c.491N>Ap.Arg164Hisp.R164HQ9GZN8protein_codingdeleterious(0)probably_damaging(0.982)TCGA-AX-A0J1-01Endometriumuterine corpus endometrioid carcinomaFemale>=65I/IIUnknownUnknownSD
C20orf27SNVMissense_Mutationrs752711158c.122N>Ap.Arg41Hisp.R41HQ9GZN8protein_codingtolerated(0.06)possibly_damaging(0.528)TCGA-B5-A11E-01Endometriumuterine corpus endometrioid carcinomaFemale<65I/IIUnknownUnknownSD
C20orf27SNVMissense_Mutationnovelc.514N>Gp.Thr172Alap.T172AQ9GZN8protein_codingdeleterious(0)possibly_damaging(0.719)TCGA-DF-A2KN-01Endometriumuterine corpus endometrioid carcinomaFemaleUnknownI/IIUnknownUnknownSD
C20orf27SNVMissense_Mutationnovelc.542N>Ap.Cys181Tyrp.C181YQ9GZN8protein_codingdeleterious(0)probably_damaging(0.987)TCGA-EO-A22U-01Endometriumuterine corpus endometrioid carcinomaFemale>=65I/IIUnknownUnknownSD
Page: 1 2 3 

Top

Related drugs of malignant transformation related genes

check buttonIdentification of chemicals and drugs interact with genes involved in malignant transfromation
(DGIdb 4.0)
Entrez IDSymbolCategoryInteraction TypesDrug Claim NameDrug NamePMIDs
Page: 1