| Tissue | Expression Dynamics | Abbreviation |
| Colorectum (GSE201348) |  | FAP: Familial adenomatous polyposis |
| CRC: Colorectal cancer |
| Colorectum (HTA11) |  | AD: Adenomas |
| SER: Sessile serrated lesions |
| MSI-H: Microsatellite-high colorectal cancer |
| MSS: Microsatellite stable colorectal cancer |
| Esophagus |  | ESCC: Esophageal squamous cell carcinoma |
| HGIN: High-grade intraepithelial neoplasias |
| LGIN: Low-grade intraepithelial neoplasias |
| Liver |  | HCC: Hepatocellular carcinoma |
| NAFLD: Non-alcoholic fatty liver disease |
| Oral Cavity | 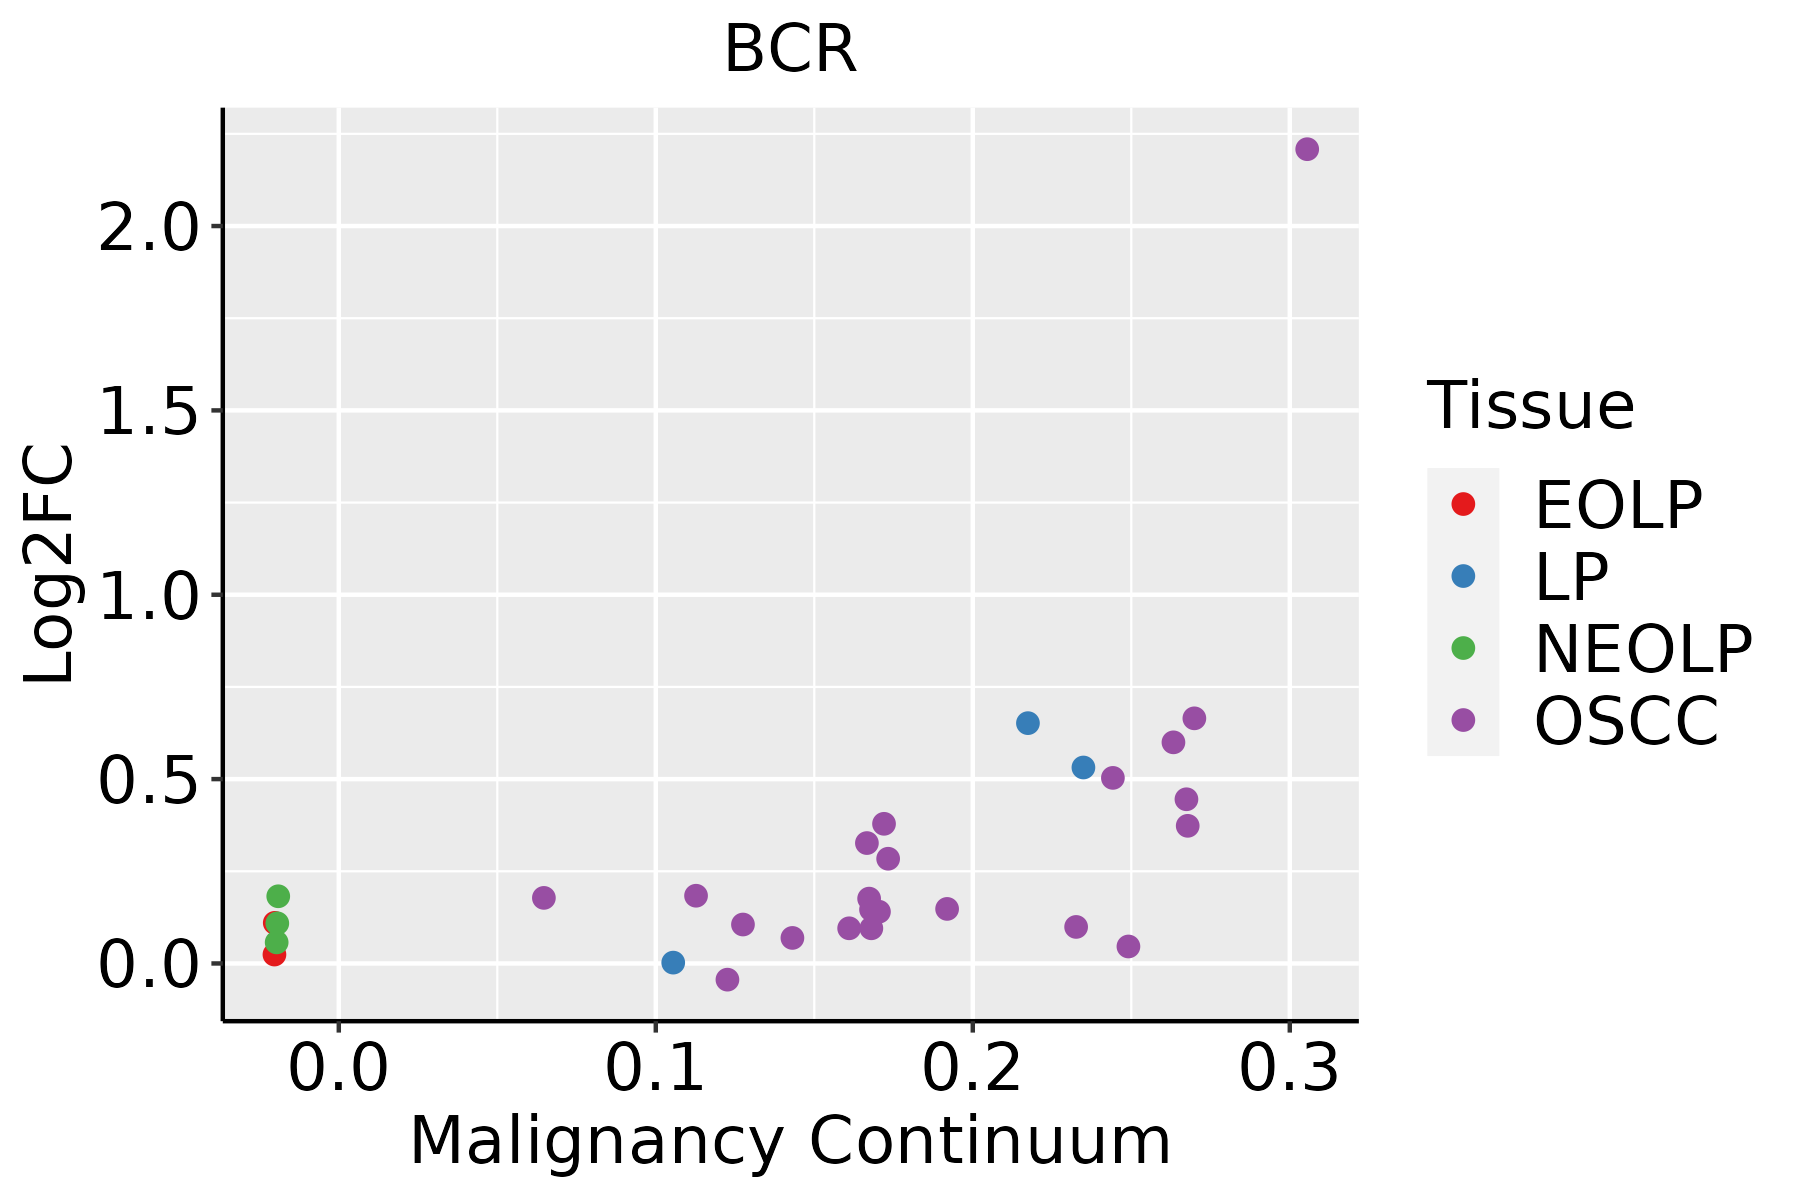 | EOLP: Erosive Oral lichen planus |
| LP: leukoplakia |
| NEOLP: Non-erosive oral lichen planus |
| OSCC: Oral squamous cell carcinoma |
| Thyroid | 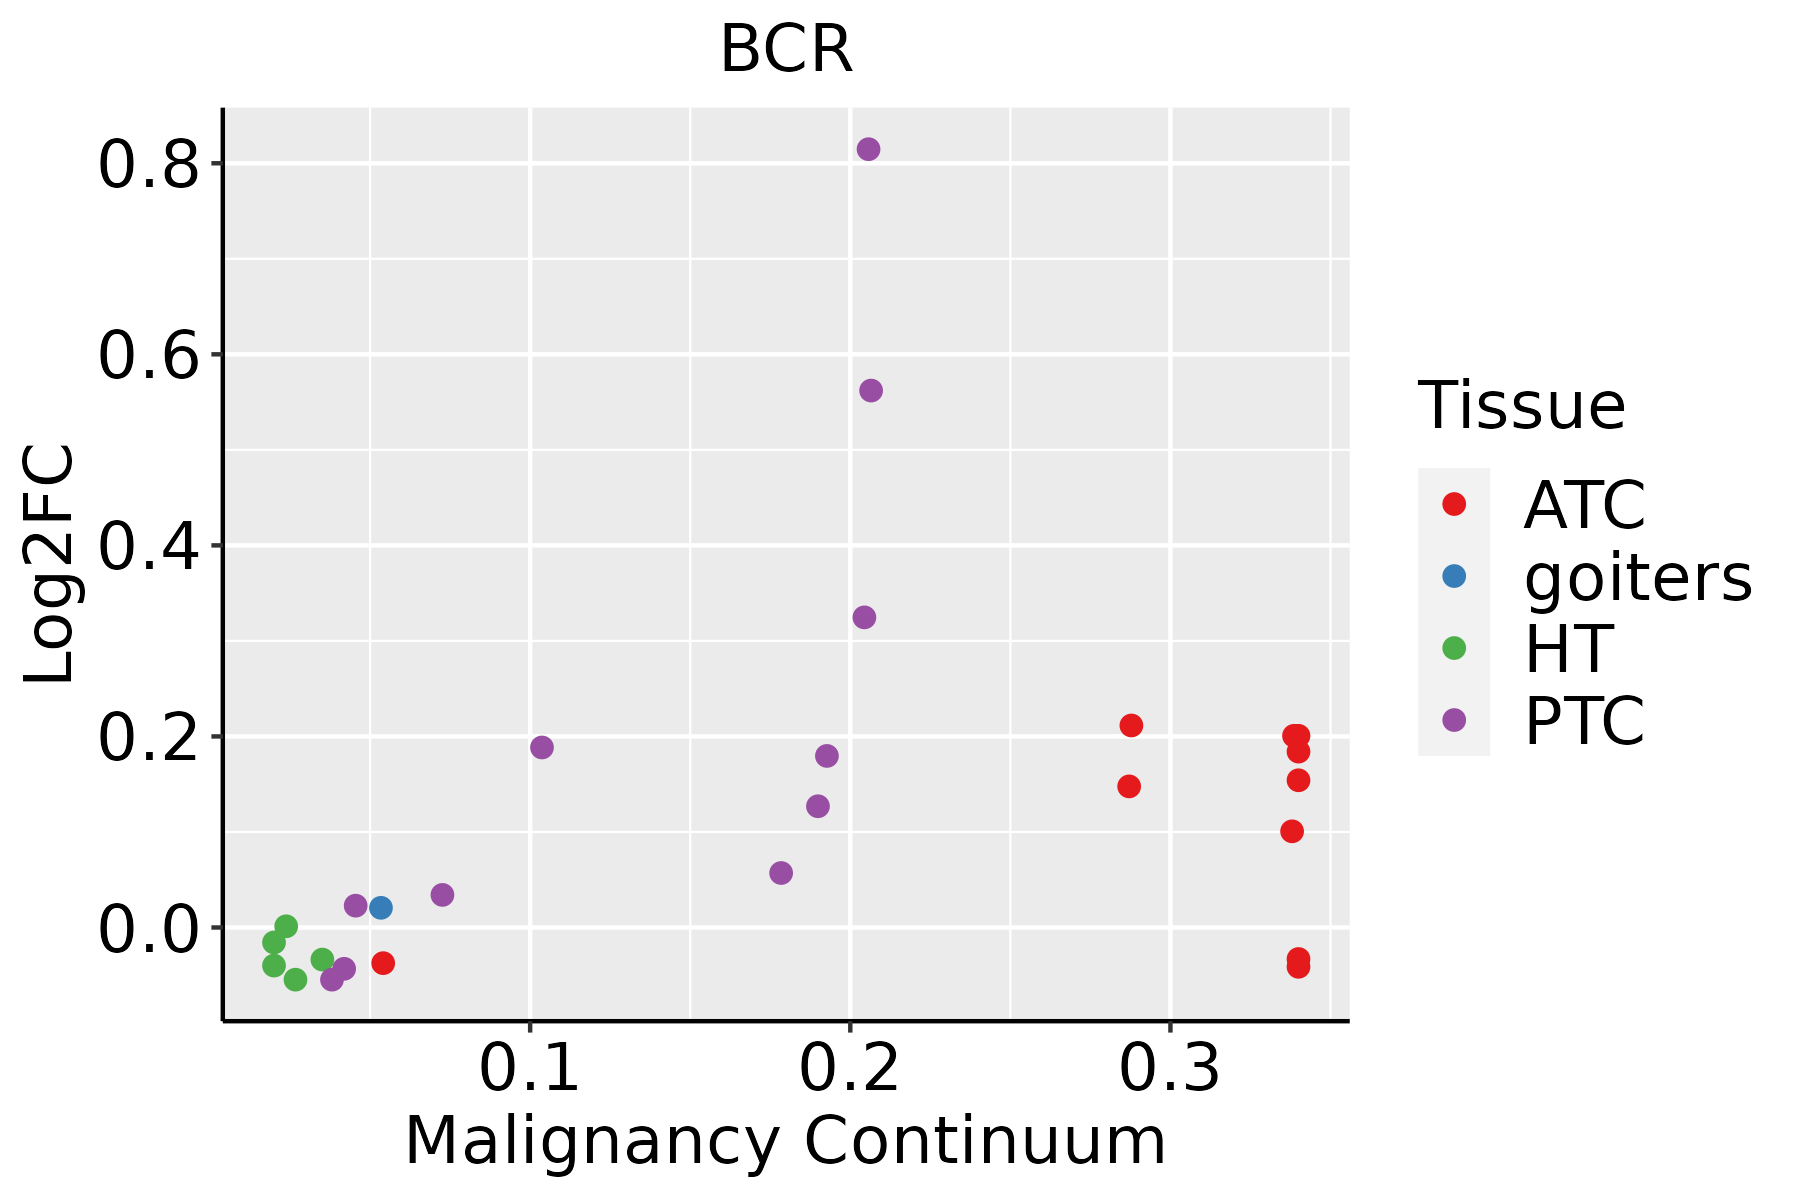 | ATC: Anaplastic thyroid cancer |
| HT: Hashimoto's thyroiditis |
| PTC: Papillary thyroid cancer |
| GO ID | Tissue | Disease Stage | Description | Gene Ratio | Bg Ratio | pvalue | p.adjust | Count |
| GO:0090630 | Colorectum | FAP | activation of GTPase activity | 27/2622 | 115/18723 | 4.23e-03 | 2.90e-02 | 27 |
| GO:00099132 | Colorectum | FAP | epidermal cell differentiation | 42/2622 | 202/18723 | 5.08e-03 | 3.37e-02 | 42 |
| GO:00510563 | Colorectum | CRC | regulation of small GTPase mediated signal transduction | 69/2078 | 302/18723 | 3.34e-09 | 9.08e-07 | 69 |
| GO:00315894 | Colorectum | CRC | cell-substrate adhesion | 78/2078 | 363/18723 | 6.22e-09 | 1.49e-06 | 78 |
| GO:00343294 | Colorectum | CRC | cell junction assembly | 83/2078 | 420/18723 | 1.08e-07 | 1.29e-05 | 83 |
| GO:00072653 | Colorectum | CRC | Ras protein signal transduction | 70/2078 | 337/18723 | 1.49e-07 | 1.66e-05 | 70 |
| GO:00070444 | Colorectum | CRC | cell-substrate junction assembly | 29/2078 | 95/18723 | 2.34e-07 | 2.27e-05 | 29 |
| GO:01501154 | Colorectum | CRC | cell-substrate junction organization | 30/2078 | 101/18723 | 2.85e-07 | 2.54e-05 | 30 |
| GO:00430874 | Colorectum | CRC | regulation of GTPase activity | 69/2078 | 348/18723 | 1.11e-06 | 6.69e-05 | 69 |
| GO:00480414 | Colorectum | CRC | focal adhesion assembly | 26/2078 | 87/18723 | 1.52e-06 | 8.15e-05 | 26 |
| GO:00465782 | Colorectum | CRC | regulation of Ras protein signal transduction | 43/2078 | 189/18723 | 3.26e-06 | 1.47e-04 | 43 |
| GO:00071604 | Colorectum | CRC | cell-matrix adhesion | 50/2078 | 233/18723 | 3.28e-06 | 1.47e-04 | 50 |
| GO:00435473 | Colorectum | CRC | positive regulation of GTPase activity | 49/2078 | 255/18723 | 8.67e-05 | 1.77e-03 | 49 |
| GO:00085442 | Colorectum | CRC | epidermis development | 57/2078 | 324/18723 | 2.88e-04 | 4.59e-03 | 57 |
| GO:00467774 | Colorectum | CRC | protein autophosphorylation | 42/2078 | 227/18723 | 6.08e-04 | 8.10e-03 | 42 |
| GO:00435881 | Colorectum | CRC | skin development | 47/2078 | 263/18723 | 6.63e-04 | 8.74e-03 | 47 |
| GO:00072662 | Colorectum | CRC | Rho protein signal transduction | 28/2078 | 137/18723 | 9.97e-04 | 1.19e-02 | 28 |
| GO:0050804 | Colorectum | CRC | modulation of chemical synaptic transmission | 70/2078 | 439/18723 | 1.15e-03 | 1.33e-02 | 70 |
| GO:0099177 | Colorectum | CRC | regulation of trans-synaptic signaling | 70/2078 | 440/18723 | 1.23e-03 | 1.38e-02 | 70 |
| GO:00099133 | Colorectum | CRC | epidermal cell differentiation | 37/2078 | 202/18723 | 1.50e-03 | 1.59e-02 | 37 |
| Hugo Symbol | Variant Class | Variant Classification | dbSNP RS | HGVSc | HGVSp | HGVSp Short | SWISSPROT | BIOTYPE | SIFT | PolyPhen | Tumor Sample Barcode | Tissue | Histology | Sex | Age | Stage | Therapy Types | Drugs | Outcome |
| BCR | SNV | Missense_Mutation | | c.900G>C | p.Gln300His | p.Q300H | P11274 | protein_coding | tolerated_low_confidence(0.47) | benign(0.275) | TCGA-AN-A0FT-01 | Breast | breast invasive carcinoma | Female | <65 | I/II | Unknown | Unknown | SD |
| BCR | SNV | Missense_Mutation | | c.2311N>C | p.Glu771Gln | p.E771Q | P11274 | protein_coding | deleterious(0.04) | possibly_damaging(0.688) | TCGA-BH-A209-01 | Breast | breast invasive carcinoma | Female | >=65 | I/II | Unknown | Unknown | SD |
| BCR | SNV | Missense_Mutation | novel | c.3671N>C | p.Asn1224Thr | p.N1224T | P11274 | protein_coding | tolerated(0.15) | benign(0.001) | TCGA-D8-A1JU-01 | Breast | breast invasive carcinoma | Female | <65 | I/II | Hormone Therapy | tamoxiphen | SD |
| BCR | SNV | Missense_Mutation | | c.2710N>A | p.Asp904Asn | p.D904N | P11274 | protein_coding | deleterious(0.03) | benign(0.41) | TCGA-GM-A2D9-01 | Breast | breast invasive carcinoma | Female | >=65 | I/II | Hormone Therapy | arimidex | SD |
| BCR | insertion | In_Frame_Ins | novel | c.2067_2068insTTAGTACCAGGAATTAATCTCAGCTCCTTCCCA | p.Asn689_Glu690insLeuValProGlyIleAsnLeuSerSerPhePro | p.N689_E690insLVPGINLSSFP | P11274 | protein_coding | | | TCGA-B6-A0IE-01 | Breast | breast invasive carcinoma | Female | <65 | III/IV | Unknown | Unknown | PD |
| BCR | deletion | Frame_Shift_Del | novel | c.2203delC | p.Leu735PhefsTer53 | p.L735Ffs*53 | P11274 | protein_coding | | | TCGA-D8-A27V-01 | Breast | breast invasive carcinoma | Female | <65 | I/II | Hormone Therapy | tamoxiphen | SD |
| BCR | SNV | Missense_Mutation | rs775101020 | c.1607N>T | p.Pro536Leu | p.P536L | P11274 | protein_coding | deleterious(0) | probably_damaging(0.999) | TCGA-2W-A8YY-01 | Cervix | cervical & endocervical cancer | Female | <65 | I/II | Chemotherapy | cisplatin | CR |
| BCR | SNV | Missense_Mutation | novel | c.3656N>A | p.Ser1219Asn | p.S1219N | P11274 | protein_coding | deleterious(0.03) | benign(0.104) | TCGA-2W-A8YY-01 | Cervix | cervical & endocervical cancer | Female | <65 | I/II | Chemotherapy | cisplatin | CR |
| BCR | SNV | Missense_Mutation | | c.1816N>C | p.Glu606Gln | p.E606Q | P11274 | protein_coding | tolerated(0.1) | benign(0.217) | TCGA-C5-A1BQ-01 | Cervix | cervical & endocervical cancer | Female | >=65 | III/IV | Chemotherapy | cisplatin | CR |
| BCR | SNV | Missense_Mutation | | c.1816N>C | p.Glu606Gln | p.E606Q | P11274 | protein_coding | tolerated(0.1) | benign(0.217) | TCGA-C5-A3HL-01 | Cervix | cervical & endocervical cancer | Female | >=65 | I/II | Unknown | Unknown | SD |
| Entrez ID | Symbol | Category | Interaction Types | Drug Claim Name | Drug Name | PMIDs |
| 613 | BCR | TUMOR SUPPRESSOR, SERINE THREONINE KINASE, TYROSINE KINASE, CLINICALLY ACTIONABLE, KINASE, ENZYME, DRUGGABLE GENOME | | ponatinib | PONATINIB | |
| 613 | BCR | TUMOR SUPPRESSOR, SERINE THREONINE KINASE, TYROSINE KINASE, CLINICALLY ACTIONABLE, KINASE, ENZYME, DRUGGABLE GENOME | | Nilotinib | NILOTINIB | |
| 613 | BCR | TUMOR SUPPRESSOR, SERINE THREONINE KINASE, TYROSINE KINASE, CLINICALLY ACTIONABLE, KINASE, ENZYME, DRUGGABLE GENOME | | Ponatinib | PONATINIB | |
| 613 | BCR | TUMOR SUPPRESSOR, SERINE THREONINE KINASE, TYROSINE KINASE, CLINICALLY ACTIONABLE, KINASE, ENZYME, DRUGGABLE GENOME | | nilotinib | NILOTINIB | |
| 613 | BCR | TUMOR SUPPRESSOR, SERINE THREONINE KINASE, TYROSINE KINASE, CLINICALLY ACTIONABLE, KINASE, ENZYME, DRUGGABLE GENOME | | IMATINIB | IMATINIB | 22148584,24681986 |
| 613 | BCR | TUMOR SUPPRESSOR, SERINE THREONINE KINASE, TYROSINE KINASE, CLINICALLY ACTIONABLE, KINASE, ENZYME, DRUGGABLE GENOME | | Imatinib | IMATINIB | |
| 613 | BCR | TUMOR SUPPRESSOR, SERINE THREONINE KINASE, TYROSINE KINASE, CLINICALLY ACTIONABLE, KINASE, ENZYME, DRUGGABLE GENOME | | busulfan | BUSULFAN | |
| 613 | BCR | TUMOR SUPPRESSOR, SERINE THREONINE KINASE, TYROSINE KINASE, CLINICALLY ACTIONABLE, KINASE, ENZYME, DRUGGABLE GENOME | | Bosutinib | BOSUTINIB | |
| 613 | BCR | TUMOR SUPPRESSOR, SERINE THREONINE KINASE, TYROSINE KINASE, CLINICALLY ACTIONABLE, KINASE, ENZYME, DRUGGABLE GENOME | | GNF-2 | CHEMBL483847 | 16415863 |
| 613 | BCR | TUMOR SUPPRESSOR, SERINE THREONINE KINASE, TYROSINE KINASE, CLINICALLY ACTIONABLE, KINASE, ENZYME, DRUGGABLE GENOME | | vincristine | VINCRISTINE | |


