
|
|||||
|
 | |
| |
| |
| |
| |
| |
|
Gene: BCL2L13 |
Gene summary for BCL2L13 |
| Gene information | Species | Human | Gene symbol | BCL2L13 | Gene ID | 23786 |
| Gene name | BCL2 like 13 | |
| Gene Alias | BCL-RAMBO | |
| Cytomap | 22q11.21 | |
| Gene Type | protein-coding | GO ID | GO:0006508 | UniProtAcc | A0A087WX97 |
Top |
Malignant transformation analysis |
| Identification of the aberrant gene expression in precancerous and cancerous lesions by comparing the gene expression of stem-like cells in diseased tissues with normal stem cells |
| Entrez ID | Symbol | Replicates | Species | Organ | Tissue | Adj P-value | Log2FC | Malignancy |
| 23786 | BCL2L13 | HTA11_3410_2000001011 | Human | Colorectum | AD | 1.55e-03 | -1.42e-01 | 0.0155 |
| 23786 | BCL2L13 | HTA11_347_2000001011 | Human | Colorectum | AD | 5.77e-06 | 5.08e-01 | -0.1954 |
| 23786 | BCL2L13 | F007 | Human | Colorectum | FAP | 4.37e-04 | -3.54e-01 | 0.1176 |
| 23786 | BCL2L13 | A001-C-207 | Human | Colorectum | FAP | 2.71e-03 | -2.93e-01 | 0.1278 |
| 23786 | BCL2L13 | A015-C-203 | Human | Colorectum | FAP | 4.47e-18 | -3.77e-01 | -0.1294 |
| 23786 | BCL2L13 | A015-C-204 | Human | Colorectum | FAP | 1.68e-06 | -3.65e-01 | -0.0228 |
| 23786 | BCL2L13 | A014-C-040 | Human | Colorectum | FAP | 1.16e-04 | -5.12e-01 | -0.1184 |
| 23786 | BCL2L13 | A002-C-201 | Human | Colorectum | FAP | 1.48e-14 | -4.10e-01 | 0.0324 |
| 23786 | BCL2L13 | A001-C-119 | Human | Colorectum | FAP | 6.75e-05 | -2.97e-01 | -0.1557 |
| 23786 | BCL2L13 | A001-C-108 | Human | Colorectum | FAP | 4.63e-10 | -2.81e-01 | -0.0272 |
| 23786 | BCL2L13 | A002-C-205 | Human | Colorectum | FAP | 3.63e-13 | -2.36e-01 | -0.1236 |
| 23786 | BCL2L13 | A015-C-006 | Human | Colorectum | FAP | 5.62e-12 | -4.34e-01 | -0.0994 |
| 23786 | BCL2L13 | A015-C-106 | Human | Colorectum | FAP | 1.35e-08 | -2.48e-01 | -0.0511 |
| 23786 | BCL2L13 | A002-C-114 | Human | Colorectum | FAP | 3.08e-13 | -3.80e-01 | -0.1561 |
| 23786 | BCL2L13 | A015-C-104 | Human | Colorectum | FAP | 4.69e-16 | -2.22e-01 | -0.1899 |
| 23786 | BCL2L13 | A001-C-014 | Human | Colorectum | FAP | 1.25e-10 | -3.07e-01 | 0.0135 |
| 23786 | BCL2L13 | A002-C-016 | Human | Colorectum | FAP | 1.12e-15 | -3.68e-01 | 0.0521 |
| 23786 | BCL2L13 | A015-C-002 | Human | Colorectum | FAP | 9.24e-09 | -3.25e-01 | -0.0763 |
| 23786 | BCL2L13 | A001-C-203 | Human | Colorectum | FAP | 2.45e-05 | -2.14e-01 | -0.0481 |
| 23786 | BCL2L13 | A002-C-116 | Human | Colorectum | FAP | 4.27e-17 | -3.21e-01 | -0.0452 |
| Page: 1 2 3 4 5 6 7 |
| Tissue | Expression Dynamics | Abbreviation |
| Colorectum (GSE201348) |  | FAP: Familial adenomatous polyposis |
| CRC: Colorectal cancer | ||
| Colorectum (HTA11) |  | AD: Adenomas |
| SER: Sessile serrated lesions | ||
| MSI-H: Microsatellite-high colorectal cancer | ||
| MSS: Microsatellite stable colorectal cancer | ||
| Esophagus | 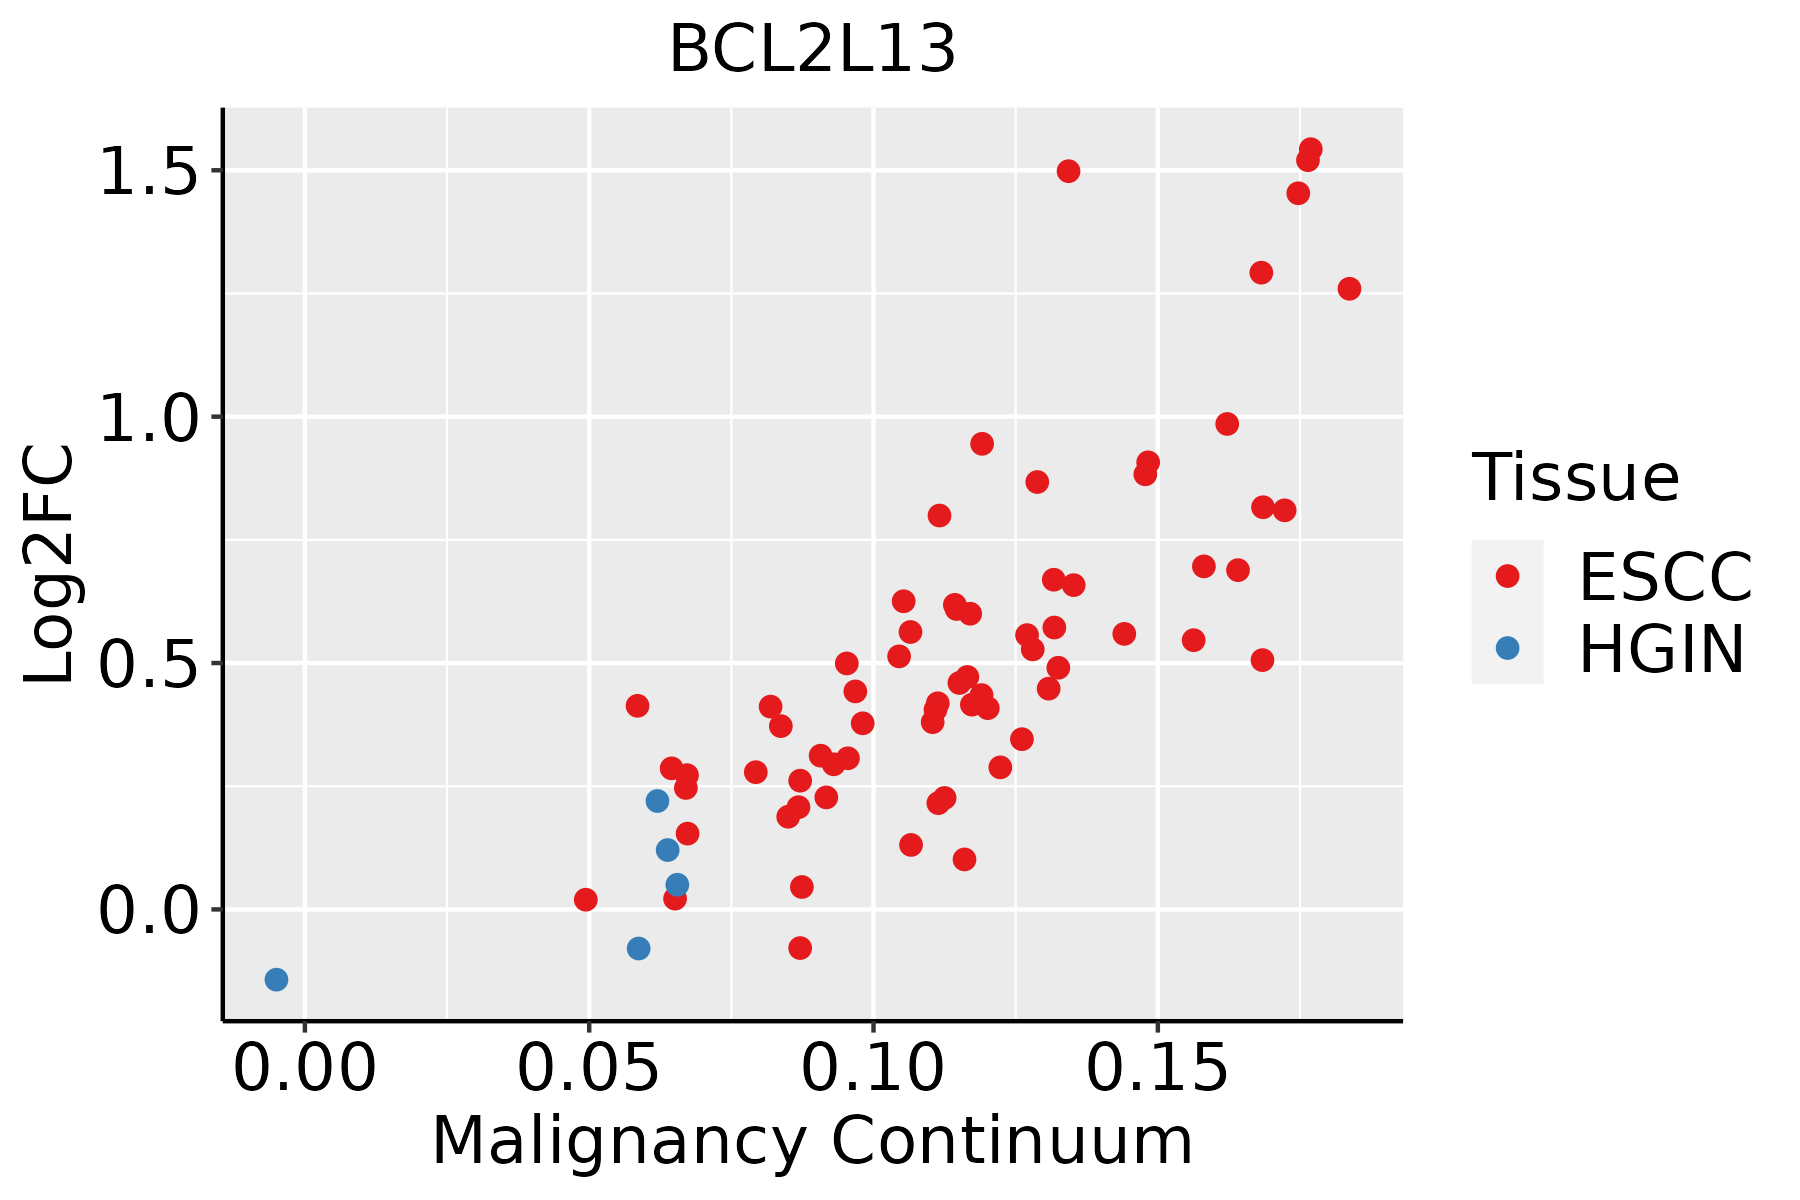 | ESCC: Esophageal squamous cell carcinoma |
| HGIN: High-grade intraepithelial neoplasias | ||
| LGIN: Low-grade intraepithelial neoplasias | ||
| Liver | 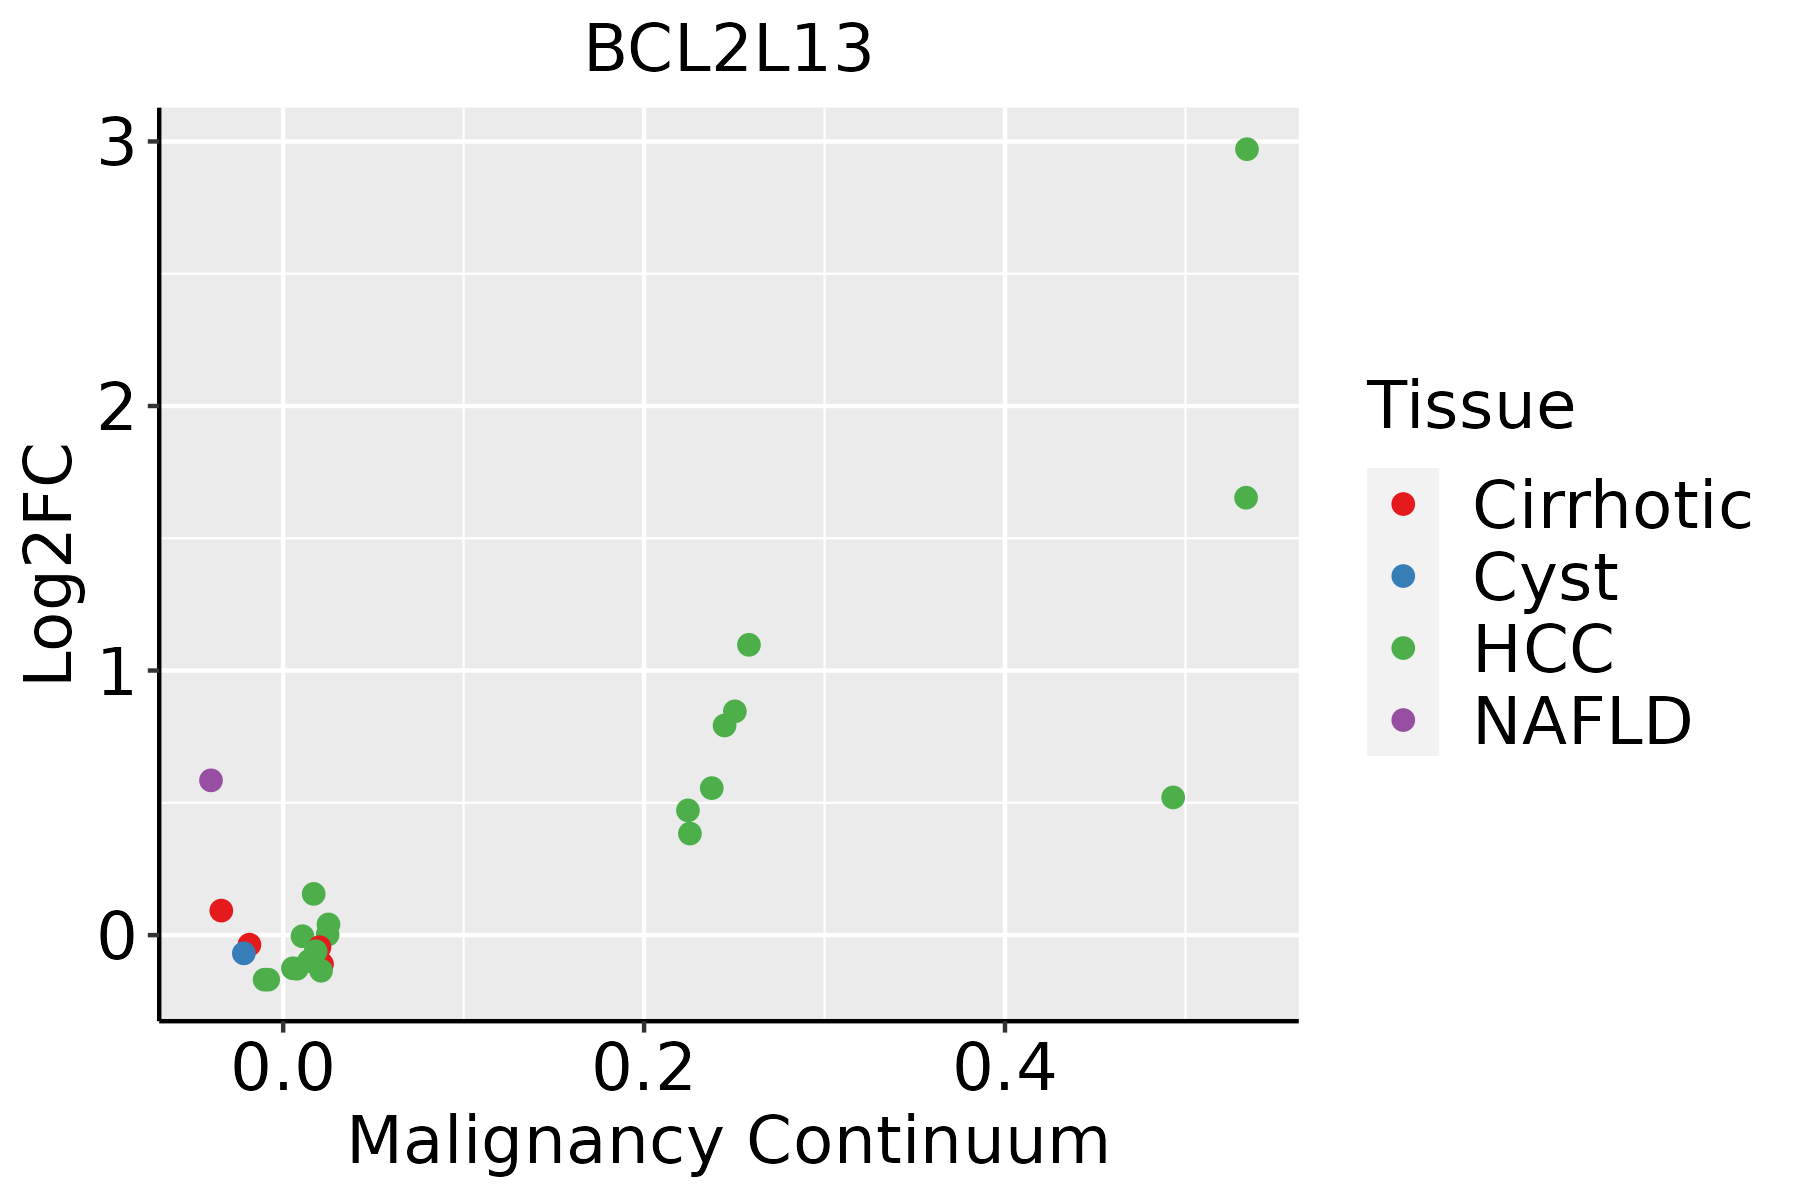 | HCC: Hepatocellular carcinoma |
| NAFLD: Non-alcoholic fatty liver disease | ||
| Oral Cavity |  | EOLP: Erosive Oral lichen planus |
| LP: leukoplakia | ||
| NEOLP: Non-erosive oral lichen planus | ||
| OSCC: Oral squamous cell carcinoma | ||
| Skin | 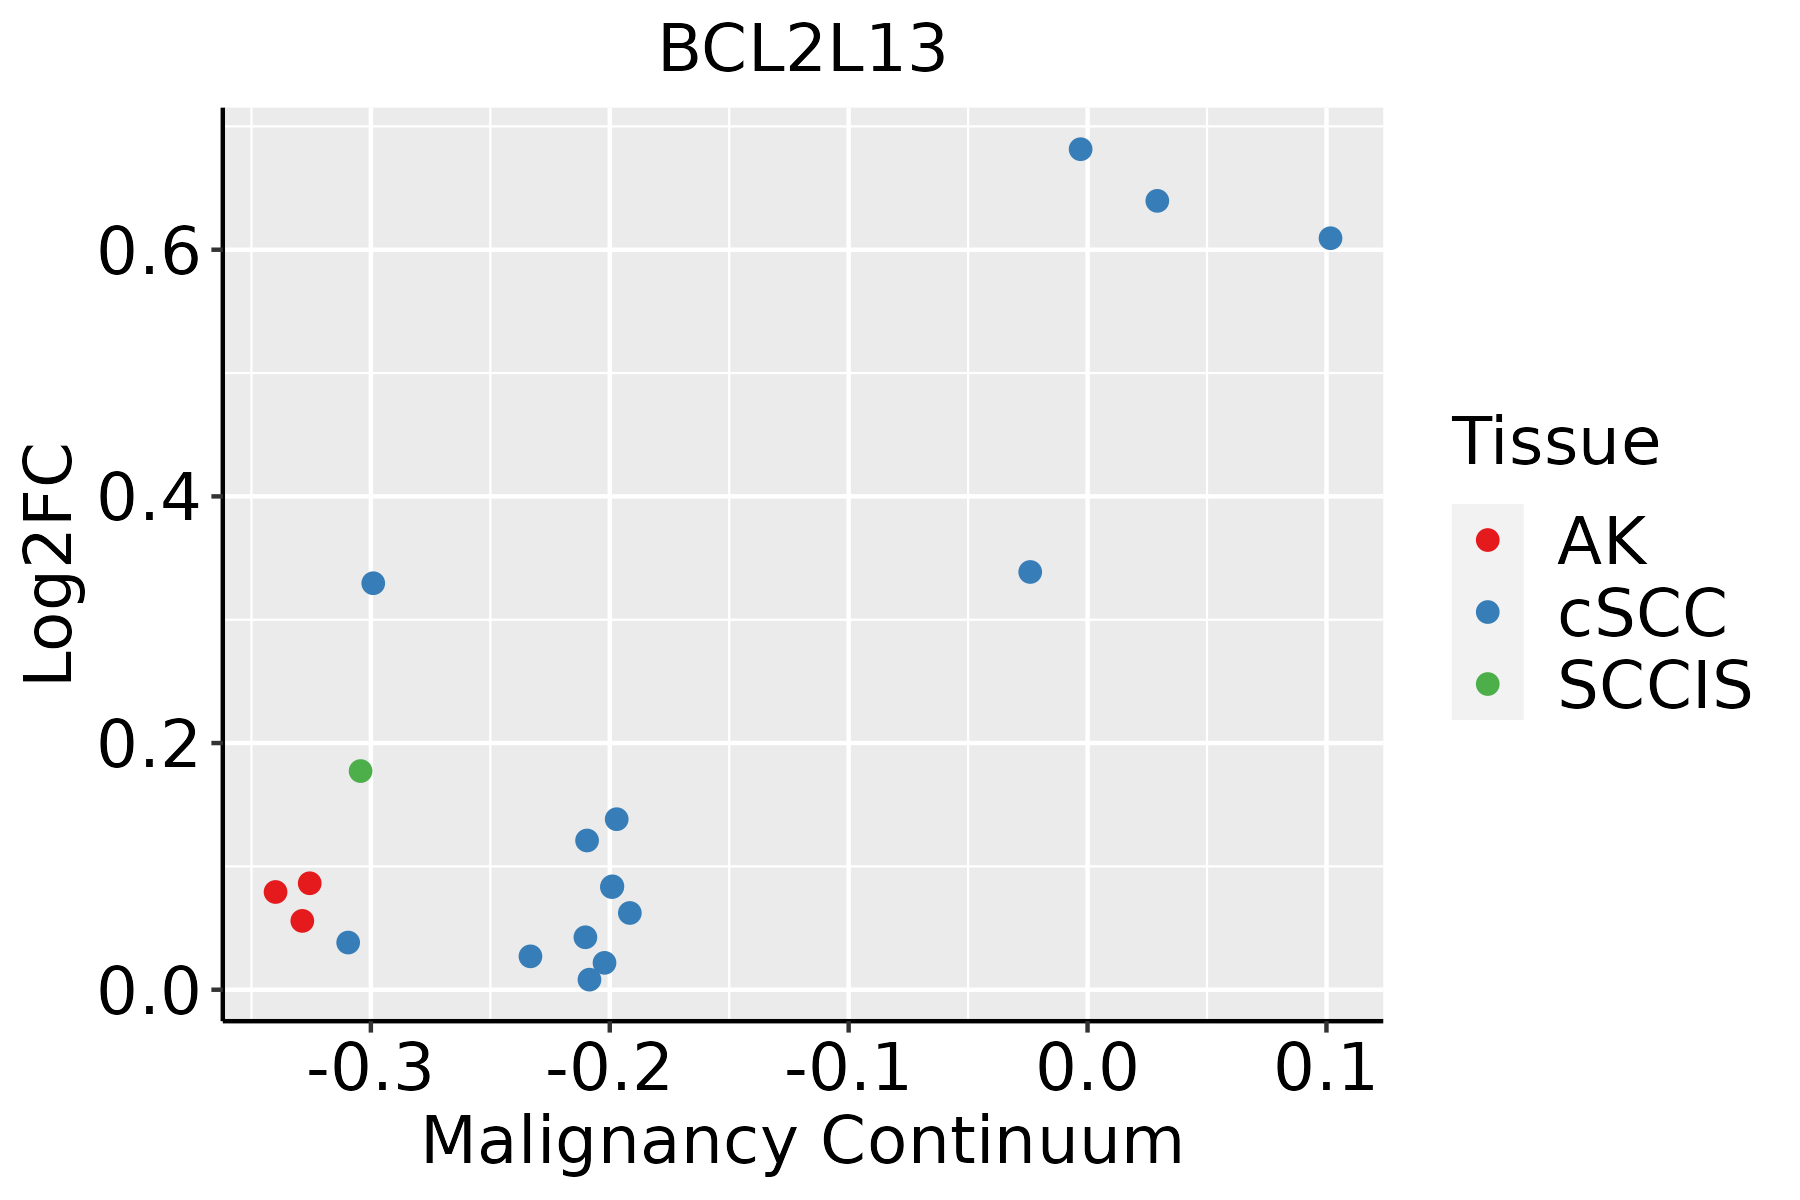 | AK: Actinic keratosis |
| cSCC: Cutaneous squamous cell carcinoma | ||
| SCCIS:squamous cell carcinoma in situ |
| ∗log2FC in expression of this searched gene in stem-like cells from each diseased tissue sample relative to stem-like cells in normal samples in each tissue plotted against the malignancy continuum. Samples are colored based on if they are from different disease stage. |
Top |
Malignant transformation related pathway analysis |
| Find out the enriched GO biological processes and KEGG pathways involved in transition from healthy to precancer to cancer |
| Tissue | Disease Stage | Enriched GO biological Processes |
| Colorectum | AD |  |
| Colorectum | SER |  |
| Colorectum | MSS |  |
| Colorectum | MSI-H |  |
| Colorectum | FAP |  |
| ∗Top 15 enriched GO BP terms are showed in the bar plot of each disease state in each tissue. Each row represents a significant GO biological process which is colored according to the -log10(p.adjust). |
| Page: 1 2 3 4 5 6 7 8 9 |
| GO ID | Tissue | Disease Stage | Description | Gene Ratio | Bg Ratio | pvalue | p.adjust | Count |
| GO:004586222 | Liver | HCC | positive regulation of proteolysis | 232/7958 | 372/18723 | 5.66e-15 | 3.98e-13 | 232 |
| GO:004328112 | Liver | HCC | regulation of cysteine-type endopeptidase activity involved in apoptotic process | 125/7958 | 209/18723 | 3.12e-07 | 5.42e-06 | 125 |
| GO:200011612 | Liver | HCC | regulation of cysteine-type endopeptidase activity | 137/7958 | 235/18723 | 6.91e-07 | 1.08e-05 | 137 |
| GO:005254722 | Liver | HCC | regulation of peptidase activity | 247/7958 | 461/18723 | 8.28e-07 | 1.27e-05 | 247 |
| GO:005254822 | Liver | HCC | regulation of endopeptidase activity | 230/7958 | 432/18723 | 3.58e-06 | 4.68e-05 | 230 |
| GO:001095212 | Liver | HCC | positive regulation of peptidase activity | 110/7958 | 197/18723 | 1.04e-04 | 8.98e-04 | 110 |
| GO:001095012 | Liver | HCC | positive regulation of endopeptidase activity | 96/7958 | 179/18723 | 1.68e-03 | 8.79e-03 | 96 |
| GO:004328012 | Liver | HCC | positive regulation of cysteine-type endopeptidase activity involved in apoptotic process | 70/7958 | 129/18723 | 4.58e-03 | 1.97e-02 | 70 |
| GO:200105612 | Liver | HCC | positive regulation of cysteine-type endopeptidase activity | 79/7958 | 148/18723 | 4.82e-03 | 2.03e-02 | 79 |
| GO:004586220 | Oral cavity | OSCC | positive regulation of proteolysis | 236/7305 | 372/18723 | 6.53e-22 | 1.38e-19 | 236 |
| GO:200011620 | Oral cavity | OSCC | regulation of cysteine-type endopeptidase activity | 152/7305 | 235/18723 | 1.14e-15 | 8.13e-14 | 152 |
| GO:004328120 | Oral cavity | OSCC | regulation of cysteine-type endopeptidase activity involved in apoptotic process | 137/7305 | 209/18723 | 5.94e-15 | 3.80e-13 | 137 |
| GO:005254720 | Oral cavity | OSCC | regulation of peptidase activity | 255/7305 | 461/18723 | 5.78e-13 | 2.75e-11 | 255 |
| GO:001095220 | Oral cavity | OSCC | positive regulation of peptidase activity | 123/7305 | 197/18723 | 2.12e-11 | 7.21e-10 | 123 |
| GO:005254820 | Oral cavity | OSCC | regulation of endopeptidase activity | 235/7305 | 432/18723 | 4.35e-11 | 1.40e-09 | 235 |
| GO:001095019 | Oral cavity | OSCC | positive regulation of endopeptidase activity | 107/7305 | 179/18723 | 1.38e-08 | 2.78e-07 | 107 |
| GO:200105618 | Oral cavity | OSCC | positive regulation of cysteine-type endopeptidase activity | 88/7305 | 148/18723 | 3.59e-07 | 5.40e-06 | 88 |
| GO:004328018 | Oral cavity | OSCC | positive regulation of cysteine-type endopeptidase activity involved in apoptotic process | 78/7305 | 129/18723 | 6.35e-07 | 9.03e-06 | 78 |
| GO:00069196 | Oral cavity | OSCC | activation of cysteine-type endopeptidase activity involved in apoptotic process | 47/7305 | 78/18723 | 1.16e-04 | 8.42e-04 | 47 |
| GO:0045862110 | Oral cavity | LP | positive regulation of proteolysis | 165/4623 | 372/18723 | 5.40e-17 | 8.46e-15 | 165 |
| Page: 1 2 3 4 |
| Pathway ID | Tissue | Disease Stage | Description | Gene Ratio | Bg Ratio | pvalue | p.adjust | qvalue | Count |
| hsa04137 | Colorectum | AD | Mitophagy - animal | 29/2092 | 72/8465 | 2.49e-03 | 1.35e-02 | 8.59e-03 | 29 |
| hsa041371 | Colorectum | AD | Mitophagy - animal | 29/2092 | 72/8465 | 2.49e-03 | 1.35e-02 | 8.59e-03 | 29 |
| hsa041378 | Colorectum | FAP | Mitophagy - animal | 20/1404 | 72/8465 | 1.14e-02 | 3.92e-02 | 2.38e-02 | 20 |
| hsa041379 | Colorectum | FAP | Mitophagy - animal | 20/1404 | 72/8465 | 1.14e-02 | 3.92e-02 | 2.38e-02 | 20 |
| hsa0413710 | Colorectum | CRC | Mitophagy - animal | 17/1091 | 72/8465 | 8.74e-03 | 4.00e-02 | 2.71e-02 | 17 |
| hsa0413711 | Colorectum | CRC | Mitophagy - animal | 17/1091 | 72/8465 | 8.74e-03 | 4.00e-02 | 2.71e-02 | 17 |
| hsa04137210 | Esophagus | ESCC | Mitophagy - animal | 54/4205 | 72/8465 | 9.33e-06 | 4.96e-05 | 2.54e-05 | 54 |
| hsa0513428 | Esophagus | ESCC | Legionellosis | 42/4205 | 57/8465 | 1.83e-04 | 6.90e-04 | 3.53e-04 | 42 |
| hsa0413738 | Esophagus | ESCC | Mitophagy - animal | 54/4205 | 72/8465 | 9.33e-06 | 4.96e-05 | 2.54e-05 | 54 |
| hsa0513436 | Esophagus | ESCC | Legionellosis | 42/4205 | 57/8465 | 1.83e-04 | 6.90e-04 | 3.53e-04 | 42 |
| hsa0413712 | Liver | NAFLD | Mitophagy - animal | 18/1043 | 72/8465 | 2.27e-03 | 2.46e-02 | 1.99e-02 | 18 |
| hsa0413713 | Liver | NAFLD | Mitophagy - animal | 18/1043 | 72/8465 | 2.27e-03 | 2.46e-02 | 1.99e-02 | 18 |
| hsa0413721 | Liver | Cirrhotic | Mitophagy - animal | 39/2530 | 72/8465 | 1.38e-05 | 1.24e-04 | 7.64e-05 | 39 |
| hsa0513412 | Liver | Cirrhotic | Legionellosis | 28/2530 | 57/8465 | 1.71e-03 | 8.01e-03 | 4.94e-03 | 28 |
| hsa0413731 | Liver | Cirrhotic | Mitophagy - animal | 39/2530 | 72/8465 | 1.38e-05 | 1.24e-04 | 7.64e-05 | 39 |
| hsa0513413 | Liver | Cirrhotic | Legionellosis | 28/2530 | 57/8465 | 1.71e-03 | 8.01e-03 | 4.94e-03 | 28 |
| hsa0413741 | Liver | HCC | Mitophagy - animal | 53/4020 | 72/8465 | 5.49e-06 | 4.59e-05 | 2.56e-05 | 53 |
| hsa0413751 | Liver | HCC | Mitophagy - animal | 53/4020 | 72/8465 | 5.49e-06 | 4.59e-05 | 2.56e-05 | 53 |
| hsa0413728 | Oral cavity | OSCC | Mitophagy - animal | 58/3704 | 72/8465 | 1.48e-10 | 2.07e-09 | 1.05e-09 | 58 |
| hsa0513425 | Oral cavity | OSCC | Legionellosis | 42/3704 | 57/8465 | 4.18e-06 | 2.15e-05 | 1.10e-05 | 42 |
| Page: 1 2 |
Top |
Cell-cell communication analysis |
| Identification of potential cell-cell interactions between two cell types and their ligand-receptor pairs for different disease states |
| Ligand | Receptor | LRpair | Pathway | Tissue | Disease Stage |
| Page: 1 |
Top |
Single-cell gene regulatory network inference analysis |
| Find out the significant the regulons (TFs) and the target genes of each regulon across cell types for different disease states |
| TF | Cell Type | Tissue | Disease Stage | Target Gene | RSS | Regulon Activity |
| ∗The dot plots of a searched regulon are shown for all cell subpopulations in each disease state of each tissue based on the regulon specific score inferred using pySCENIC and by calculating the average expression. |
| Page: 1 |
Top |
Somatic mutation of malignant transformation related genes |
| Annotation of somatic variants for genes involved in malignant transformation |
| Hugo Symbol | Variant Class | Variant Classification | dbSNP RS | HGVSc | HGVSp | HGVSp Short | SWISSPROT | BIOTYPE | SIFT | PolyPhen | Tumor Sample Barcode | Tissue | Histology | Sex | Age | Stage | Therapy Types | Drugs | Outcome |
| BCL2L13 | SNV | Missense_Mutation | rs770528843 | c.581N>A | p.Arg194His | p.R194H | protein_coding | deleterious(0.02) | probably_damaging(0.919) | TCGA-A2-A0YT-01 | Breast | breast invasive carcinoma | Female | <65 | III/IV | Hormone Therapy | arimidex | SD | |
| BCL2L13 | SNV | Missense_Mutation | rs746105939 | c.523A>G | p.Asn175Asp | p.N175D | protein_coding | deleterious(0.03) | benign(0.044) | TCGA-A2-A1FW-01 | Breast | breast invasive carcinoma | Female | <65 | III/IV | Chemotherapy | cytoxan | SD | |
| BCL2L13 | SNV | Missense_Mutation | c.1153N>C | p.Asp385His | p.D385H | protein_coding | tolerated_low_confidence(0.09) | benign(0.011) | TCGA-AC-A23H-01 | Breast | breast invasive carcinoma | Female | >=65 | I/II | Unknown | Unknown | PD | ||
| BCL2L13 | SNV | Missense_Mutation | novel | c.256N>A | p.Glu86Lys | p.E86K | protein_coding | deleterious(0.04) | probably_damaging(0.96) | TCGA-AC-A5XS-01 | Breast | breast invasive carcinoma | Female | >=65 | I/II | Hormone Therapy | femara | SD | |
| BCL2L13 | SNV | Missense_Mutation | rs746105939 | c.523N>G | p.Asn175Asp | p.N175D | protein_coding | deleterious(0.03) | benign(0.044) | TCGA-BH-A1F2-01 | Breast | breast invasive carcinoma | Female | <65 | III/IV | Unknown | Unknown | SD | |
| BCL2L13 | SNV | Missense_Mutation | novel | c.467C>T | p.Thr156Ile | p.T156I | protein_coding | deleterious(0.02) | probably_damaging(0.974) | TCGA-VS-A8QC-01 | Cervix | cervical & endocervical cancer | Female | <65 | I/II | Chemotherapy | paclitaxel | PD | |
| BCL2L13 | SNV | Missense_Mutation | rs568678964 | c.291N>C | p.Glu97Asp | p.E97D | protein_coding | deleterious(0.03) | probably_damaging(0.956) | TCGA-AA-A00N-01 | Colorectum | colon adenocarcinoma | Male | >=65 | I/II | Unknown | Unknown | PD | |
| BCL2L13 | SNV | Missense_Mutation | c.694T>C | p.Ser232Pro | p.S232P | protein_coding | tolerated(0.15) | benign(0.061) | TCGA-AM-5821-01 | Colorectum | colon adenocarcinoma | Female | >=65 | I/II | Unknown | Unknown | SD | ||
| BCL2L13 | SNV | Missense_Mutation | rs559607869 | c.1064N>T | p.Ala355Val | p.A355V | protein_coding | deleterious_low_confidence(0.02) | possibly_damaging(0.491) | TCGA-CM-6171-01 | Colorectum | colon adenocarcinoma | Female | >=65 | I/II | Unknown | Unknown | SD | |
| BCL2L13 | SNV | Missense_Mutation | rs749474060 | c.641C>T | p.Ser214Leu | p.S214L | protein_coding | tolerated(0.09) | benign(0.294) | TCGA-AG-A002-01 | Colorectum | rectum adenocarcinoma | Male | <65 | I/II | Unknown | Unknown | SD |
| Page: 1 2 3 4 |
Top |
Related drugs of malignant transformation related genes |
| Identification of chemicals and drugs interact with genes involved in malignant transfromation |
| (DGIdb 4.0) |
| Entrez ID | Symbol | Category | Interaction Types | Drug Claim Name | Drug Name | PMIDs |
| Page: 1 |

Copyright 2023-Present -The University of Texas Health Science Center at Houston |