
|
|||||
|
 | |
| |
| |
| |
| |
| |
|
Gene: ATP1B3 |
Gene summary for ATP1B3 |
| Gene information | Species | Human | Gene symbol | ATP1B3 | Gene ID | 483 |
| Gene name | ATPase Na+/K+ transporting subunit beta 3 | |
| Gene Alias | ATPB-3 | |
| Cytomap | 3q23 | |
| Gene Type | protein-coding | GO ID | GO:0002028 | UniProtAcc | P54709 |
Top |
Malignant transformation analysis |
| Identification of the aberrant gene expression in precancerous and cancerous lesions by comparing the gene expression of stem-like cells in diseased tissues with normal stem cells |
| Entrez ID | Symbol | Replicates | Species | Organ | Tissue | Adj P-value | Log2FC | Malignancy |
| 483 | ATP1B3 | GSM4909281 | Human | Breast | IDC | 9.76e-06 | 3.17e-01 | 0.21 |
| 483 | ATP1B3 | GSM4909282 | Human | Breast | IDC | 2.32e-62 | 9.05e-01 | -0.0288 |
| 483 | ATP1B3 | GSM4909285 | Human | Breast | IDC | 9.31e-21 | 5.12e-01 | 0.21 |
| 483 | ATP1B3 | GSM4909294 | Human | Breast | IDC | 2.44e-07 | -3.54e-01 | 0.2022 |
| 483 | ATP1B3 | GSM4909296 | Human | Breast | IDC | 1.90e-11 | -3.31e-01 | 0.1524 |
| 483 | ATP1B3 | GSM4909297 | Human | Breast | IDC | 2.72e-09 | -2.61e-01 | 0.1517 |
| 483 | ATP1B3 | GSM4909298 | Human | Breast | IDC | 6.46e-04 | -3.05e-01 | 0.1551 |
| 483 | ATP1B3 | GSM4909301 | Human | Breast | IDC | 9.27e-04 | -2.95e-01 | 0.1577 |
| 483 | ATP1B3 | GSM4909302 | Human | Breast | IDC | 1.45e-06 | -3.45e-01 | 0.1545 |
| 483 | ATP1B3 | GSM4909311 | Human | Breast | IDC | 1.78e-21 | -4.38e-01 | 0.1534 |
| 483 | ATP1B3 | GSM4909312 | Human | Breast | IDC | 3.66e-13 | -3.51e-01 | 0.1552 |
| 483 | ATP1B3 | GSM4909313 | Human | Breast | IDC | 2.99e-05 | -2.98e-01 | 0.0391 |
| 483 | ATP1B3 | GSM4909319 | Human | Breast | IDC | 2.12e-25 | -2.83e-01 | 0.1563 |
| 483 | ATP1B3 | GSM4909320 | Human | Breast | IDC | 1.08e-03 | -3.81e-01 | 0.1575 |
| 483 | ATP1B3 | GSM4909321 | Human | Breast | IDC | 2.05e-14 | -3.50e-01 | 0.1559 |
| 483 | ATP1B3 | brca1 | Human | Breast | Precancer | 6.08e-29 | 6.53e-01 | -0.0338 |
| 483 | ATP1B3 | brca2 | Human | Breast | Precancer | 5.64e-07 | 2.99e-01 | -0.024 |
| 483 | ATP1B3 | NCCBC14 | Human | Breast | DCIS | 2.46e-07 | -2.38e-01 | 0.2021 |
| 483 | ATP1B3 | NCCBC5 | Human | Breast | DCIS | 2.15e-07 | -1.47e-01 | 0.2046 |
| 483 | ATP1B3 | P1 | Human | Breast | IDC | 3.38e-09 | -3.81e-01 | 0.1527 |
| Page: 1 2 3 4 5 6 7 8 9 10 11 12 13 |
| Tissue | Expression Dynamics | Abbreviation |
| Breast | 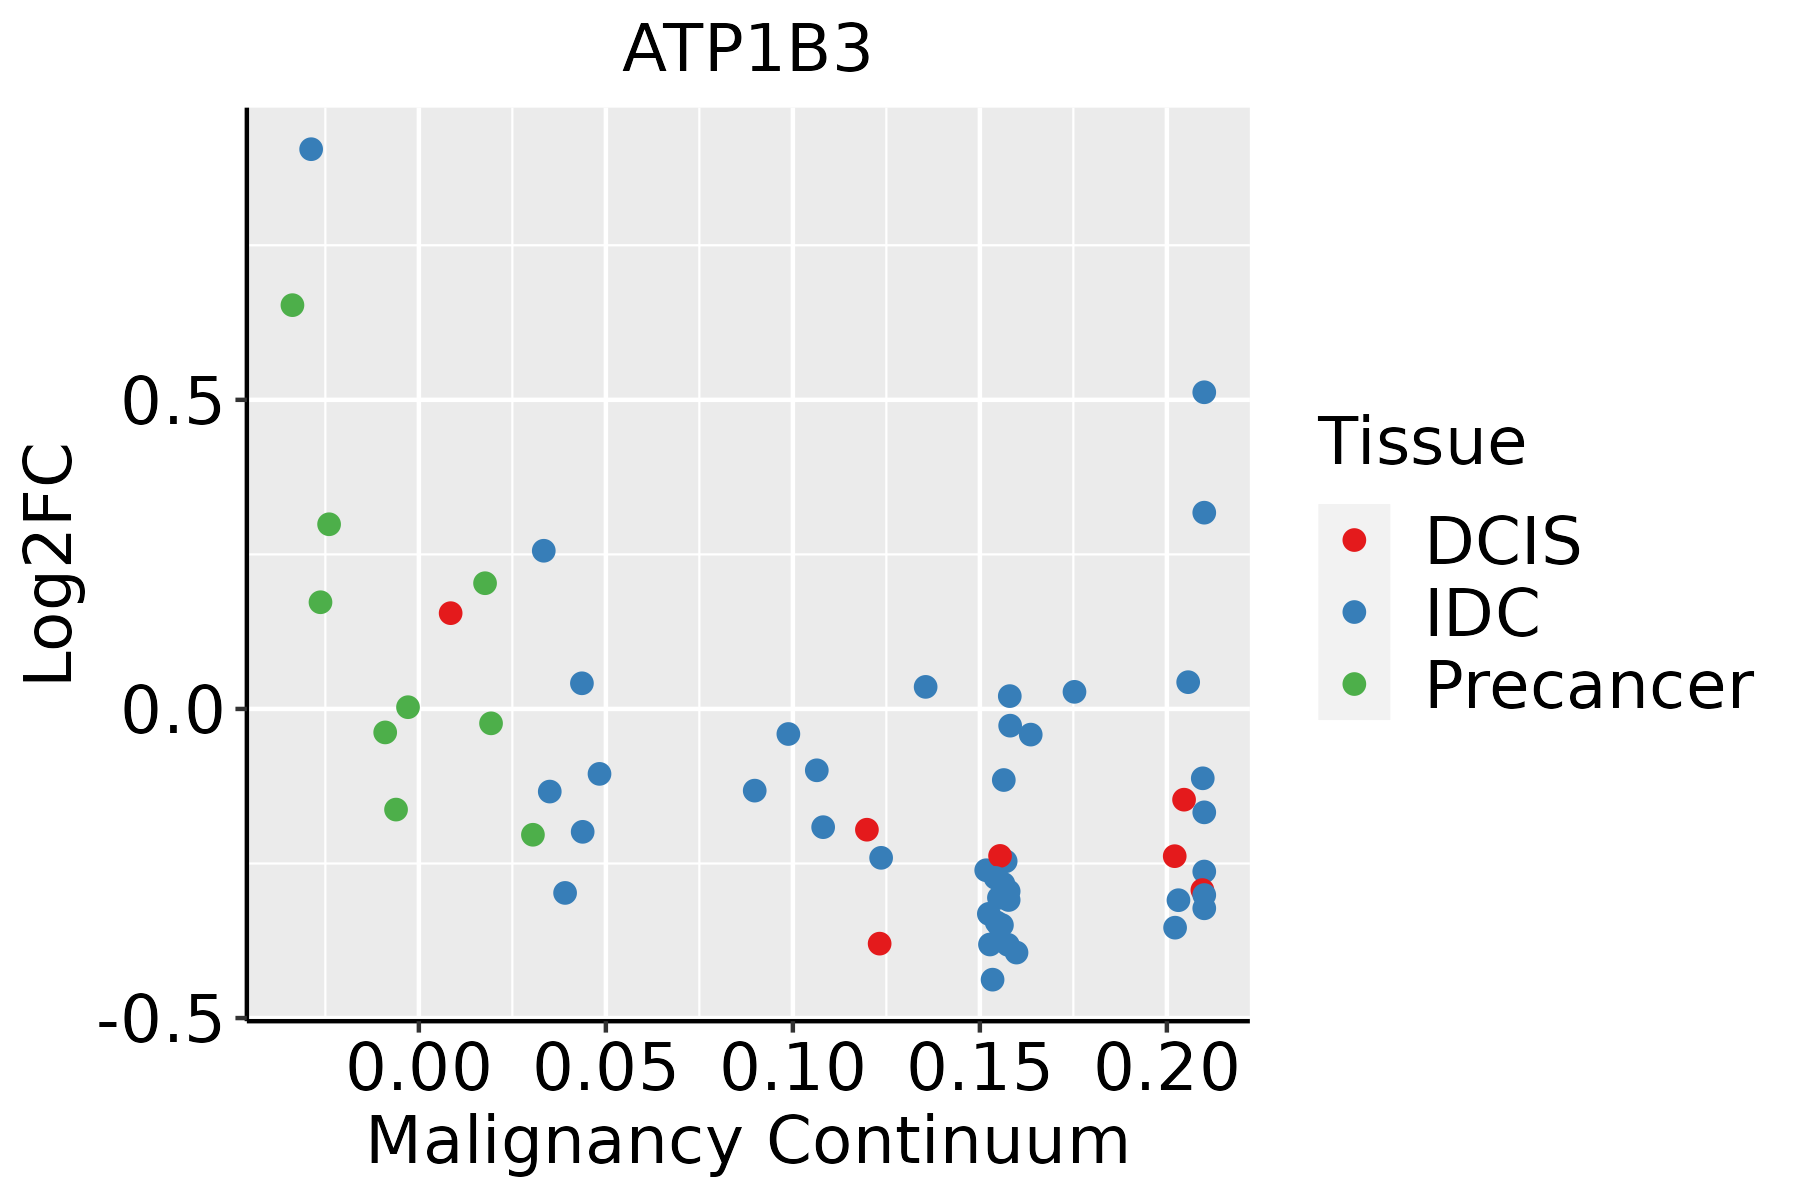 | IDC: Invasive ductal carcinoma |
| DCIS: Ductal carcinoma in situ | ||
| Precancer(BRCA1-mut): Precancerous lesion from BRCA1 mutation carriers | ||
| Cervix | 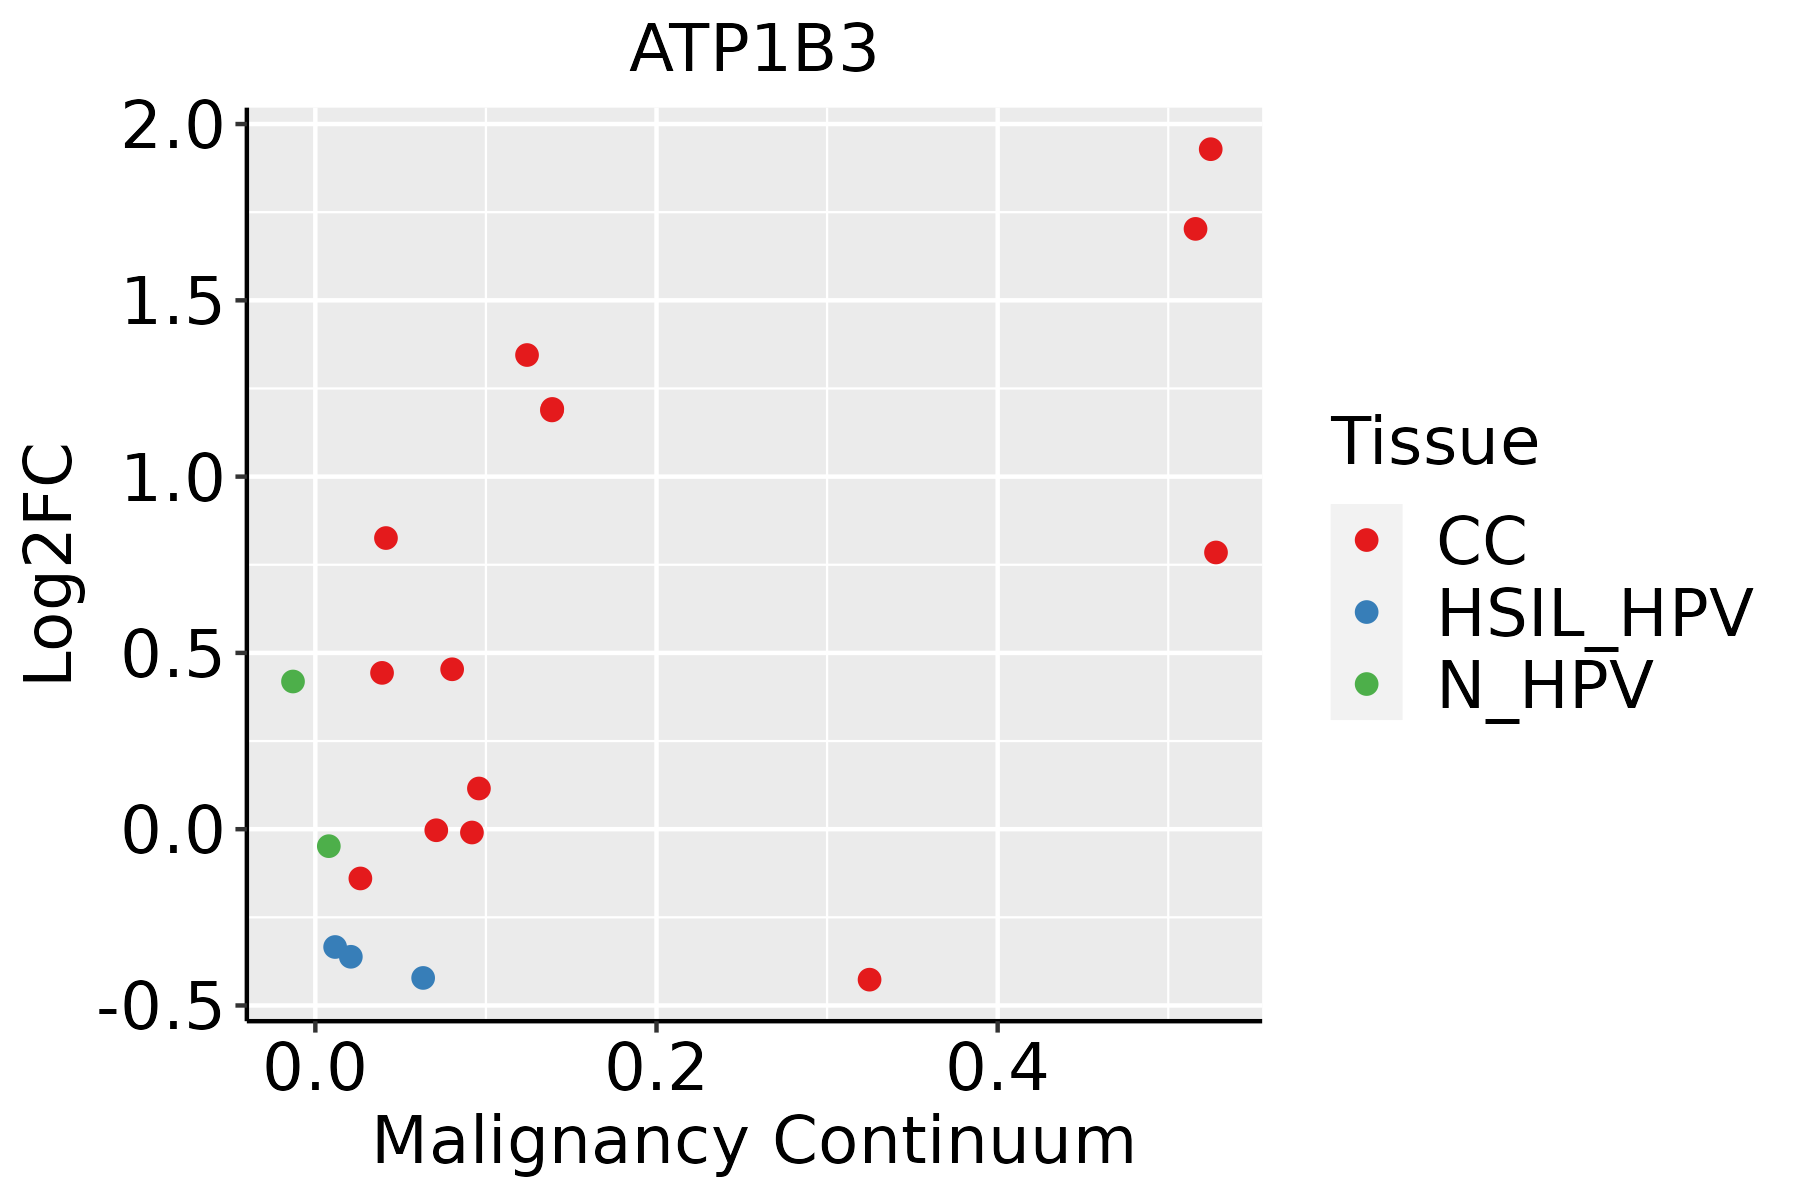 | CC: Cervix cancer |
| HSIL_HPV: HPV-infected high-grade squamous intraepithelial lesions | ||
| N_HPV: HPV-infected normal cervix | ||
| Colorectum (GSE201348) |  | FAP: Familial adenomatous polyposis |
| CRC: Colorectal cancer | ||
| Colorectum (HTA11) |  | AD: Adenomas |
| SER: Sessile serrated lesions | ||
| MSI-H: Microsatellite-high colorectal cancer | ||
| MSS: Microsatellite stable colorectal cancer | ||
| Endometrium | 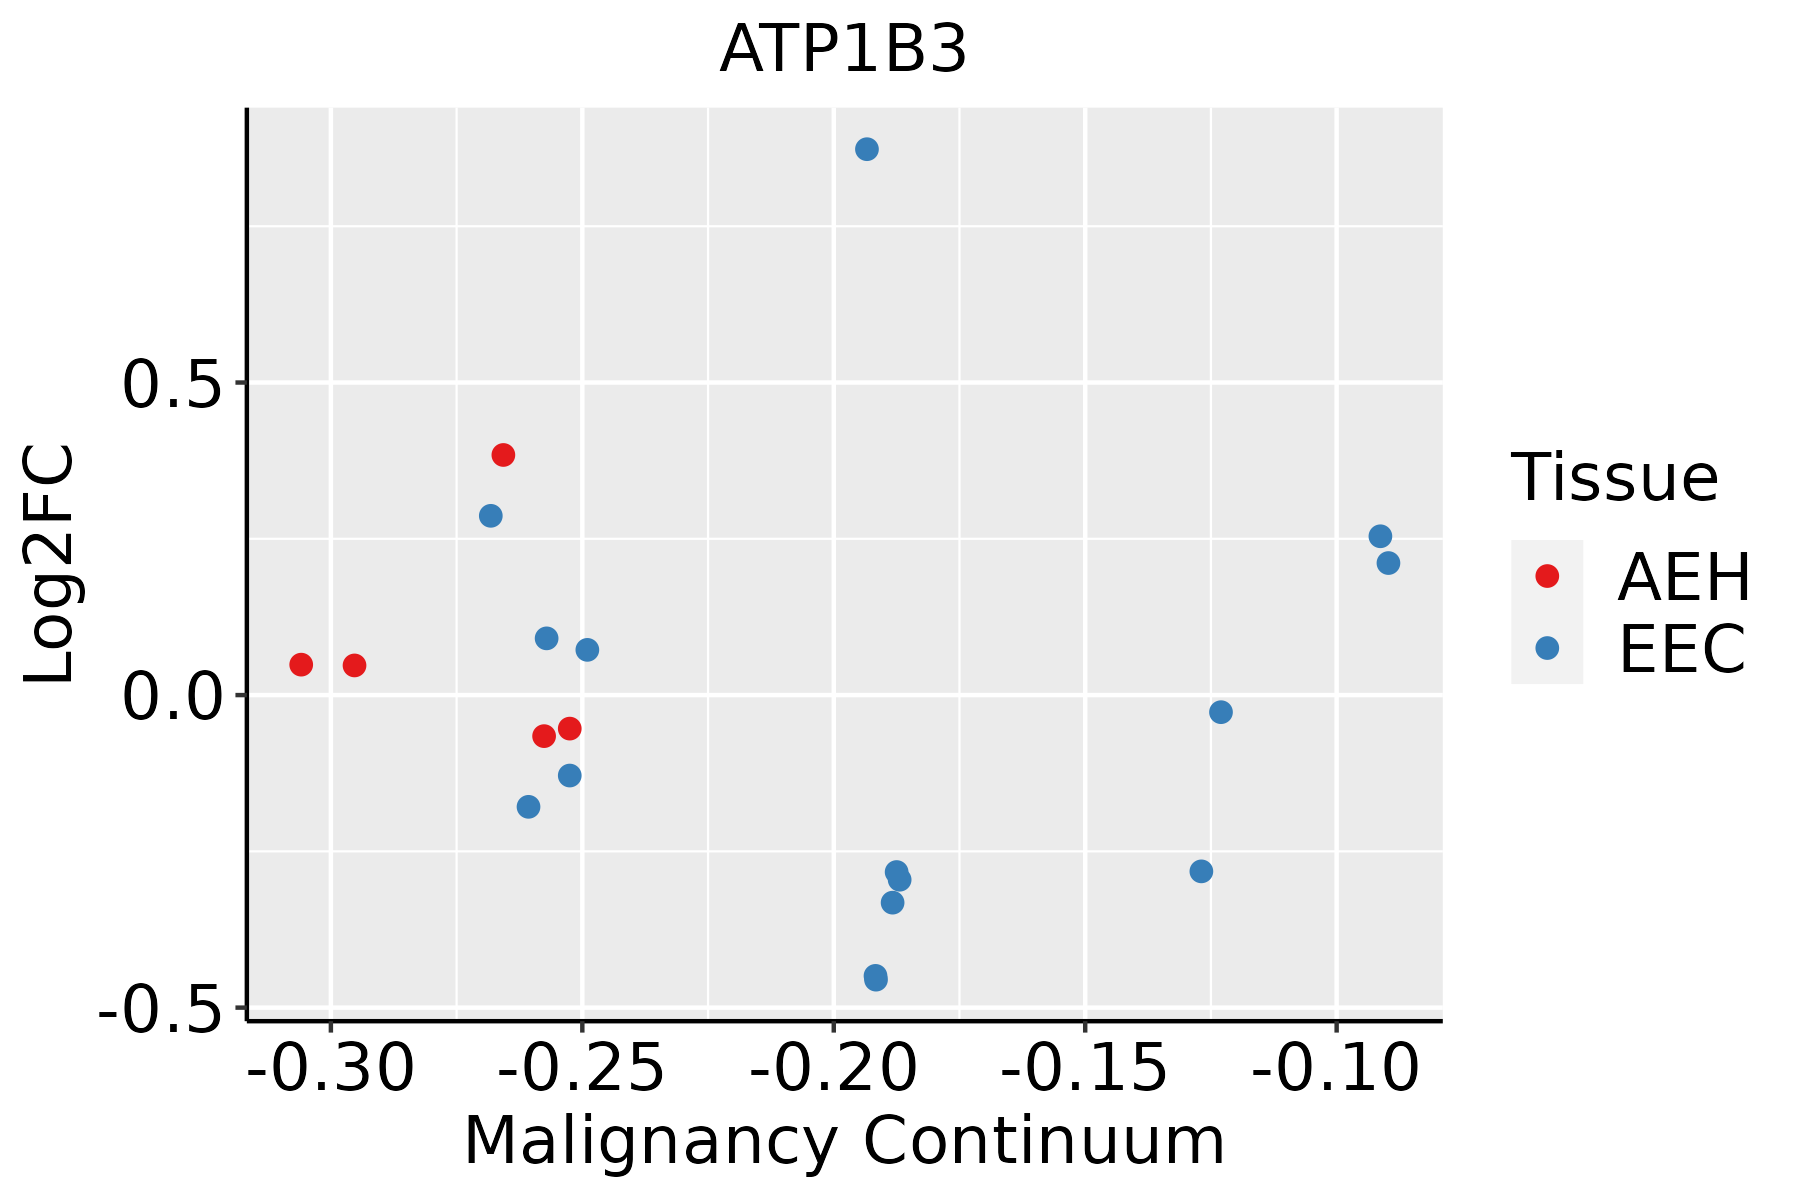 | AEH: Atypical endometrial hyperplasia |
| EEC: Endometrioid Cancer | ||
| Esophagus | 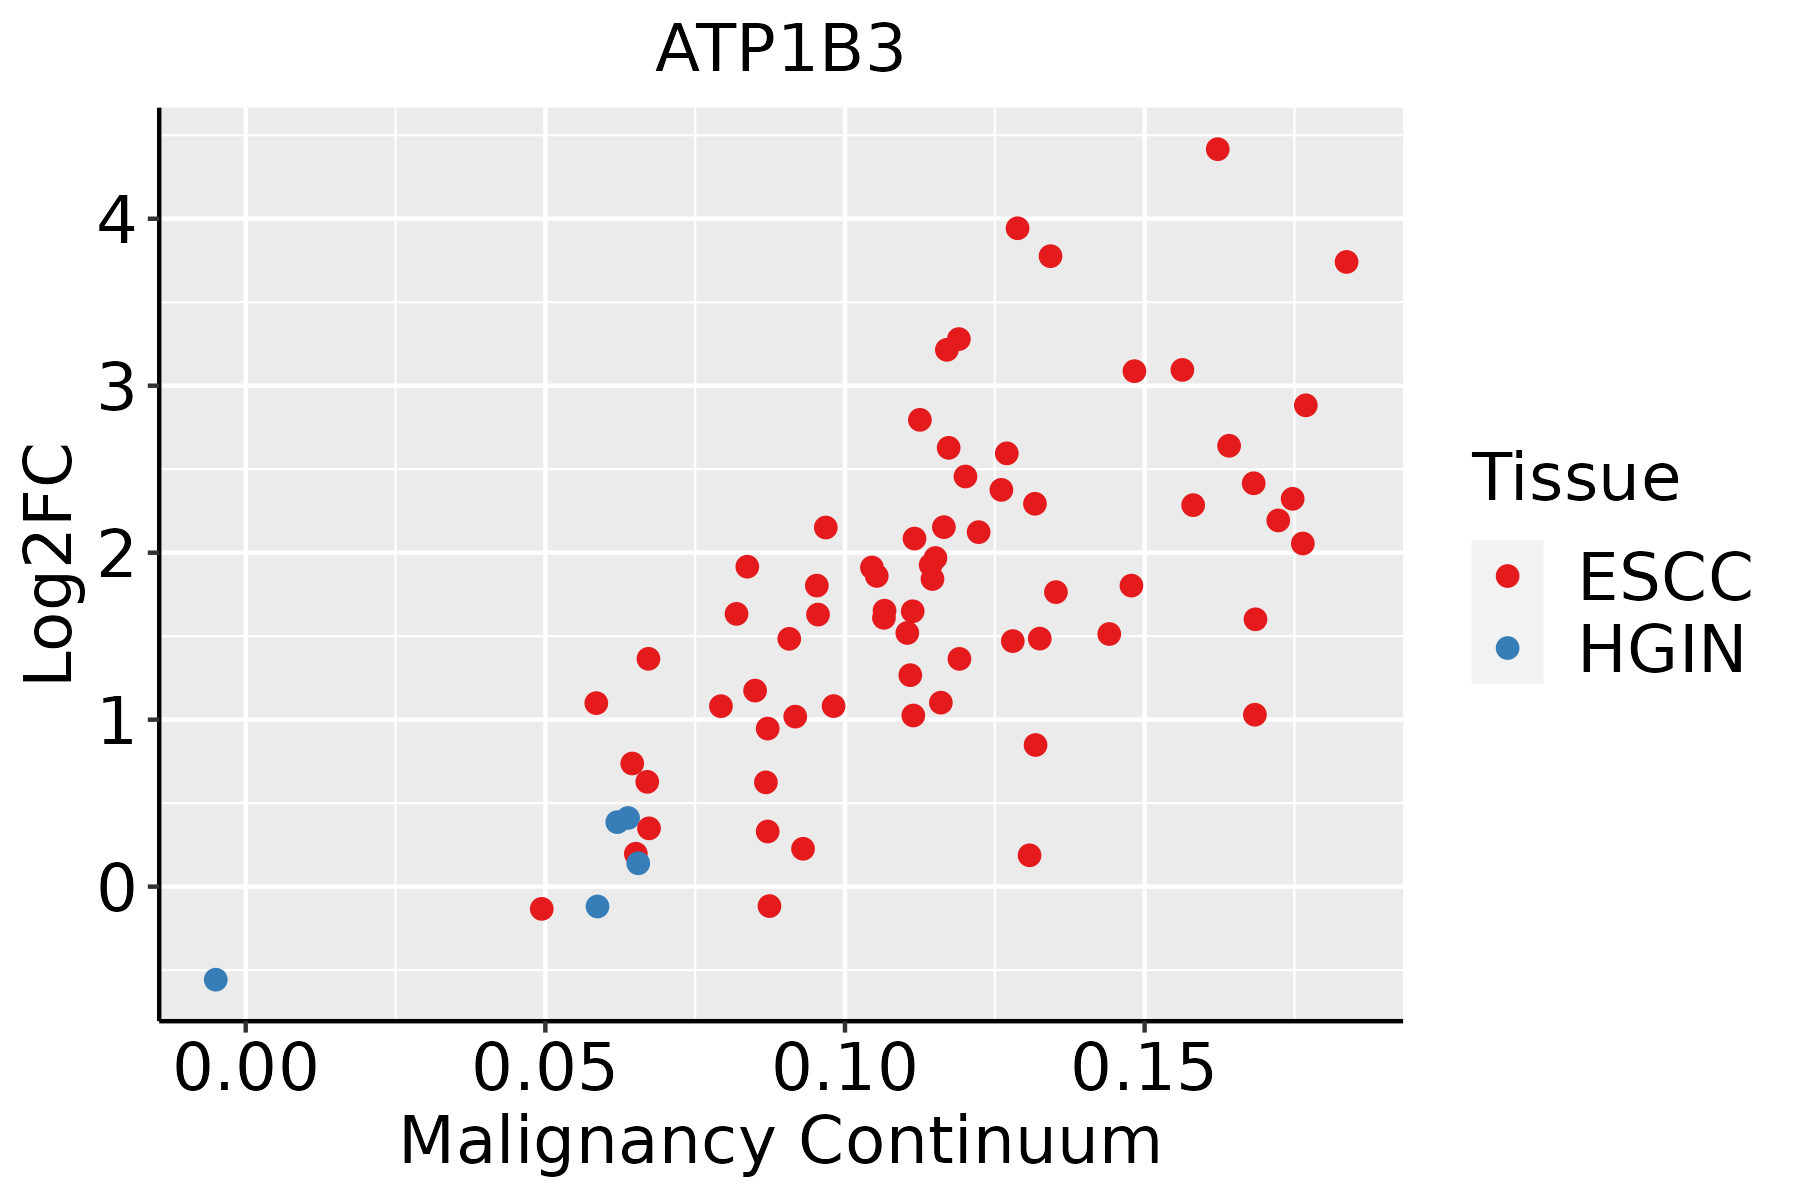 | ESCC: Esophageal squamous cell carcinoma |
| HGIN: High-grade intraepithelial neoplasias | ||
| LGIN: Low-grade intraepithelial neoplasias | ||
| Liver |  | HCC: Hepatocellular carcinoma |
| NAFLD: Non-alcoholic fatty liver disease | ||
| Oral Cavity |  | EOLP: Erosive Oral lichen planus |
| LP: leukoplakia | ||
| NEOLP: Non-erosive oral lichen planus | ||
| OSCC: Oral squamous cell carcinoma | ||
| Prostate |  | BPH: Benign Prostatic Hyperplasia |
| Skin |  | AK: Actinic keratosis |
| cSCC: Cutaneous squamous cell carcinoma | ||
| SCCIS:squamous cell carcinoma in situ | ||
| Thyroid | 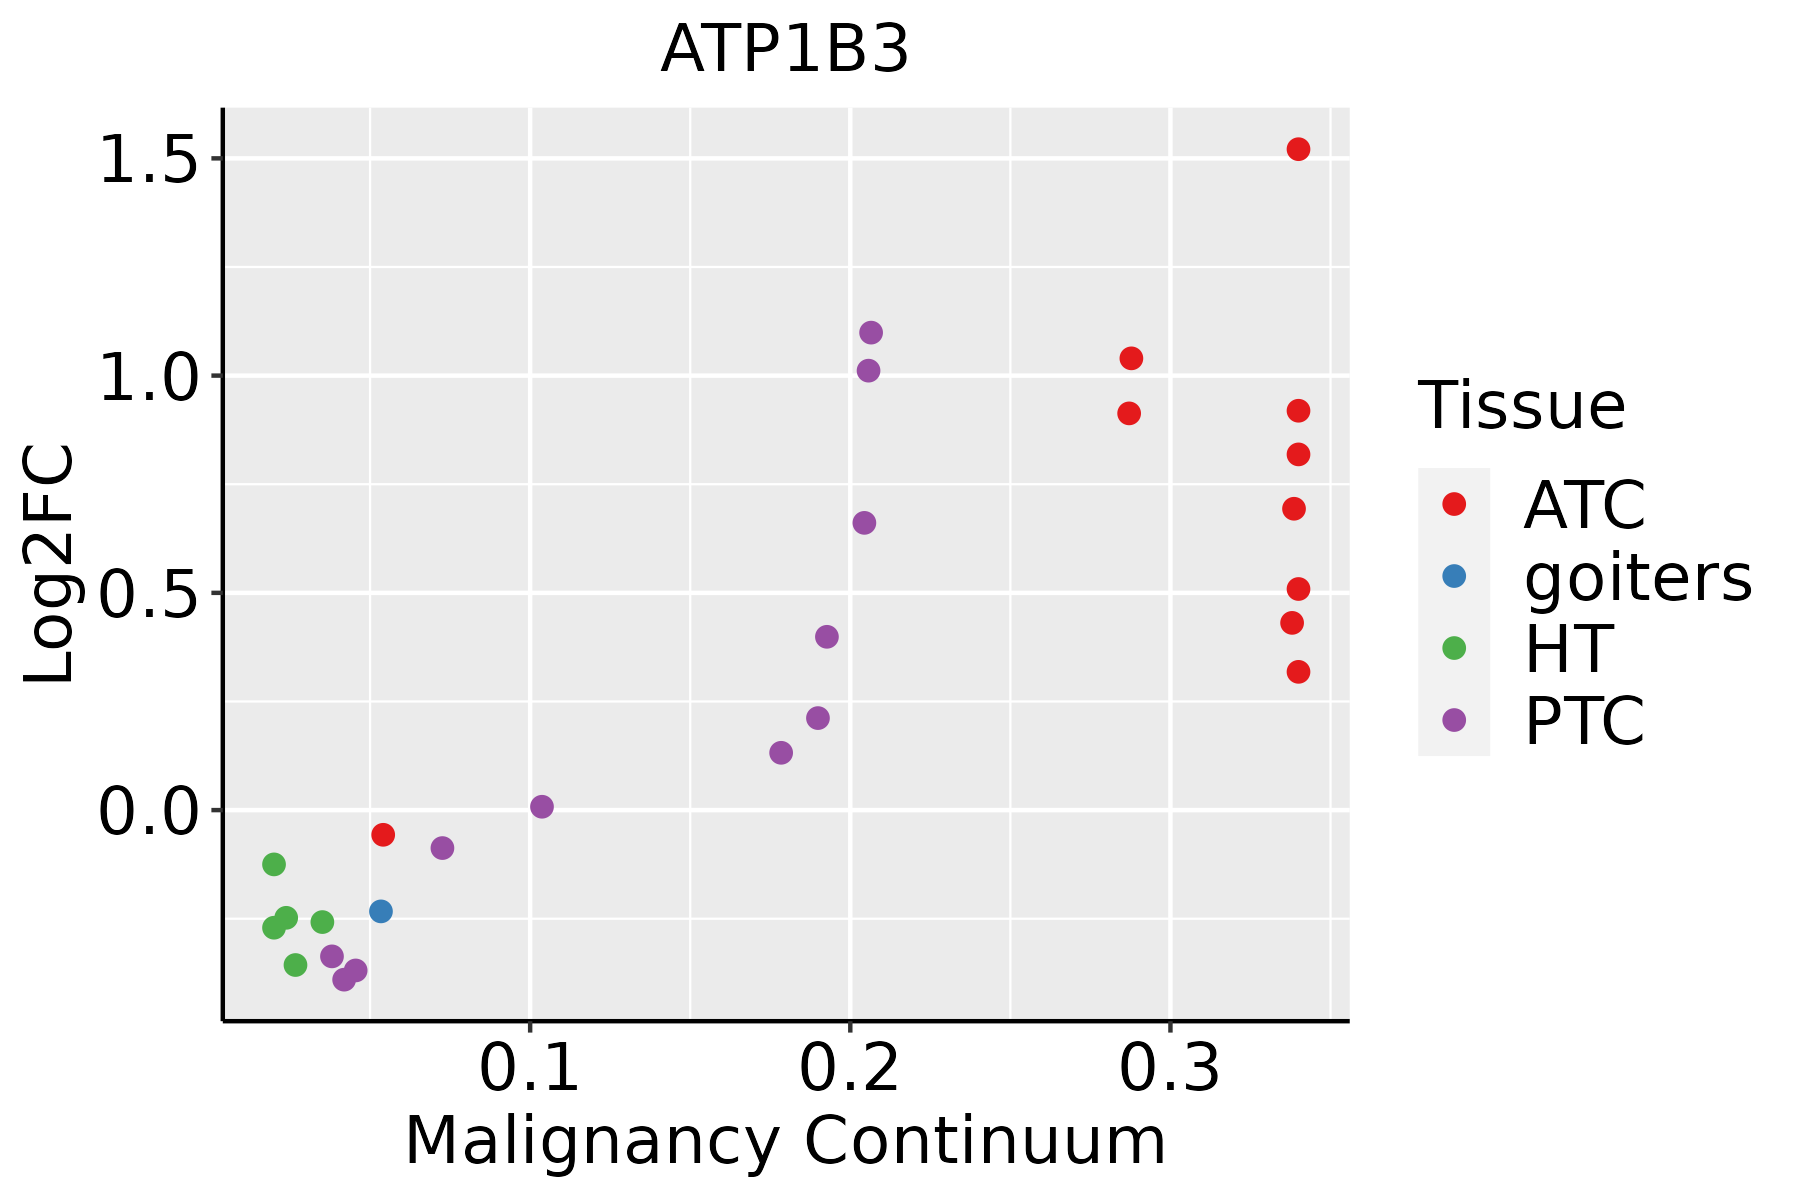 | ATC: Anaplastic thyroid cancer |
| HT: Hashimoto's thyroiditis | ||
| PTC: Papillary thyroid cancer |
| ∗log2FC in expression of this searched gene in stem-like cells from each diseased tissue sample relative to stem-like cells in normal samples in each tissue plotted against the malignancy continuum. Samples are colored based on if they are from different disease stage. |
Top |
Malignant transformation related pathway analysis |
| Find out the enriched GO biological processes and KEGG pathways involved in transition from healthy to precancer to cancer |
| Tissue | Disease Stage | Enriched GO biological Processes |
| Colorectum | AD |  |
| Colorectum | SER |  |
| Colorectum | MSS |  |
| Colorectum | MSI-H |  |
| Colorectum | FAP |  |
| ∗Top 15 enriched GO BP terms are showed in the bar plot of each disease state in each tissue. Each row represents a significant GO biological process which is colored according to the -log10(p.adjust). |
| Page: 1 2 3 4 5 6 7 8 9 |
| GO ID | Tissue | Disease Stage | Description | Gene Ratio | Bg Ratio | pvalue | p.adjust | Count |
| GO:003240912 | Breast | DCIS | regulation of transporter activity | 36/1390 | 310/18723 | 5.05e-03 | 3.74e-02 | 36 |
| GO:00708391 | Breast | DCIS | metal ion export | 10/1390 | 54/18723 | 5.83e-03 | 4.18e-02 | 10 |
| GO:00423911 | Breast | DCIS | regulation of membrane potential | 47/1390 | 434/18723 | 5.87e-03 | 4.20e-02 | 47 |
| GO:003476412 | Breast | DCIS | positive regulation of transmembrane transport | 27/1390 | 219/18723 | 6.47e-03 | 4.59e-02 | 27 |
| GO:007265910 | Cervix | CC | protein localization to plasma membrane | 73/2311 | 284/18723 | 4.95e-10 | 6.73e-08 | 73 |
| GO:19907788 | Cervix | CC | protein localization to cell periphery | 78/2311 | 333/18723 | 1.22e-08 | 9.73e-07 | 78 |
| GO:003164710 | Cervix | CC | regulation of protein stability | 63/2311 | 298/18723 | 1.14e-05 | 2.45e-04 | 63 |
| GO:005082110 | Cervix | CC | protein stabilization | 43/2311 | 191/18723 | 5.90e-05 | 8.54e-04 | 43 |
| GO:19023059 | Cervix | CC | regulation of sodium ion transmembrane transport | 19/2311 | 68/18723 | 4.21e-04 | 4.25e-03 | 19 |
| GO:00020288 | Cervix | CC | regulation of sodium ion transport | 21/2311 | 90/18723 | 2.71e-03 | 1.85e-02 | 21 |
| GO:00347645 | Cervix | CC | positive regulation of transmembrane transport | 40/2311 | 219/18723 | 6.97e-03 | 3.76e-02 | 40 |
| GO:003164715 | Cervix | HSIL_HPV | regulation of protein stability | 31/737 | 298/18723 | 8.69e-07 | 4.19e-05 | 31 |
| GO:005082115 | Cervix | HSIL_HPV | protein stabilization | 21/737 | 191/18723 | 2.17e-05 | 6.58e-04 | 21 |
| GO:007265913 | Cervix | HSIL_HPV | protein localization to plasma membrane | 21/737 | 284/18723 | 4.36e-03 | 3.68e-02 | 21 |
| GO:007265923 | Cervix | N_HPV | protein localization to plasma membrane | 20/534 | 284/18723 | 2.01e-04 | 3.37e-03 | 20 |
| GO:005082125 | Cervix | N_HPV | protein stabilization | 14/534 | 191/18723 | 1.20e-03 | 1.34e-02 | 14 |
| GO:199077813 | Cervix | N_HPV | protein localization to cell periphery | 20/534 | 333/18723 | 1.49e-03 | 1.57e-02 | 20 |
| GO:00324117 | Cervix | N_HPV | positive regulation of transporter activity | 10/534 | 120/18723 | 2.30e-03 | 2.13e-02 | 10 |
| GO:00324144 | Cervix | N_HPV | positive regulation of ion transmembrane transporter activity | 9/534 | 109/18723 | 3.99e-03 | 3.13e-02 | 9 |
| GO:003164725 | Cervix | N_HPV | regulation of protein stability | 17/534 | 298/18723 | 5.47e-03 | 3.90e-02 | 17 |
| Page: 1 2 3 4 5 6 7 8 9 10 11 12 13 |
| Pathway ID | Tissue | Disease Stage | Description | Gene Ratio | Bg Ratio | pvalue | p.adjust | qvalue | Count |
| hsa0426016 | Breast | Precancer | Cardiac muscle contraction | 22/684 | 87/8465 | 9.72e-07 | 1.62e-05 | 1.24e-05 | 22 |
| hsa0496110 | Breast | Precancer | Endocrine and other factor-regulated calcium reabsorption | 11/684 | 53/8465 | 2.92e-03 | 1.81e-02 | 1.39e-02 | 11 |
| hsa0497114 | Breast | Precancer | Gastric acid secretion | 13/684 | 76/8465 | 7.35e-03 | 4.07e-02 | 3.12e-02 | 13 |
| hsa0426017 | Breast | Precancer | Cardiac muscle contraction | 22/684 | 87/8465 | 9.72e-07 | 1.62e-05 | 1.24e-05 | 22 |
| hsa0496111 | Breast | Precancer | Endocrine and other factor-regulated calcium reabsorption | 11/684 | 53/8465 | 2.92e-03 | 1.81e-02 | 1.39e-02 | 11 |
| hsa0497115 | Breast | Precancer | Gastric acid secretion | 13/684 | 76/8465 | 7.35e-03 | 4.07e-02 | 3.12e-02 | 13 |
| hsa0426022 | Breast | IDC | Cardiac muscle contraction | 23/867 | 87/8465 | 1.39e-05 | 1.61e-04 | 1.21e-04 | 23 |
| hsa0491916 | Breast | IDC | Thyroid hormone signaling pathway | 23/867 | 121/8465 | 2.45e-03 | 1.69e-02 | 1.27e-02 | 23 |
| hsa0497122 | Breast | IDC | Gastric acid secretion | 16/867 | 76/8465 | 3.80e-03 | 2.33e-02 | 1.74e-02 | 16 |
| hsa049704 | Breast | IDC | Salivary secretion | 18/867 | 93/8465 | 5.69e-03 | 3.13e-02 | 2.34e-02 | 18 |
| hsa0496121 | Breast | IDC | Endocrine and other factor-regulated calcium reabsorption | 12/867 | 53/8465 | 6.29e-03 | 3.30e-02 | 2.47e-02 | 12 |
| hsa0497812 | Breast | IDC | Mineral absorption | 13/867 | 60/8465 | 6.73e-03 | 3.42e-02 | 2.56e-02 | 13 |
| hsa0426032 | Breast | IDC | Cardiac muscle contraction | 23/867 | 87/8465 | 1.39e-05 | 1.61e-04 | 1.21e-04 | 23 |
| hsa0491917 | Breast | IDC | Thyroid hormone signaling pathway | 23/867 | 121/8465 | 2.45e-03 | 1.69e-02 | 1.27e-02 | 23 |
| hsa0497132 | Breast | IDC | Gastric acid secretion | 16/867 | 76/8465 | 3.80e-03 | 2.33e-02 | 1.74e-02 | 16 |
| hsa0497011 | Breast | IDC | Salivary secretion | 18/867 | 93/8465 | 5.69e-03 | 3.13e-02 | 2.34e-02 | 18 |
| hsa0496131 | Breast | IDC | Endocrine and other factor-regulated calcium reabsorption | 12/867 | 53/8465 | 6.29e-03 | 3.30e-02 | 2.47e-02 | 12 |
| hsa0497813 | Breast | IDC | Mineral absorption | 13/867 | 60/8465 | 6.73e-03 | 3.42e-02 | 2.56e-02 | 13 |
| hsa0426042 | Breast | DCIS | Cardiac muscle contraction | 22/846 | 87/8465 | 3.08e-05 | 3.43e-04 | 2.53e-04 | 22 |
| hsa0491922 | Breast | DCIS | Thyroid hormone signaling pathway | 23/846 | 121/8465 | 1.78e-03 | 1.22e-02 | 9.00e-03 | 23 |
| Page: 1 2 3 4 5 6 7 8 |
Top |
Cell-cell communication analysis |
| Identification of potential cell-cell interactions between two cell types and their ligand-receptor pairs for different disease states |
| Ligand | Receptor | LRpair | Pathway | Tissue | Disease Stage |
| Page: 1 |
Top |
Single-cell gene regulatory network inference analysis |
| Find out the significant the regulons (TFs) and the target genes of each regulon across cell types for different disease states |
| TF | Cell Type | Tissue | Disease Stage | Target Gene | RSS | Regulon Activity |
| ∗The dot plots of a searched regulon are shown for all cell subpopulations in each disease state of each tissue based on the regulon specific score inferred using pySCENIC and by calculating the average expression. |
| Page: 1 |
Top |
Somatic mutation of malignant transformation related genes |
| Annotation of somatic variants for genes involved in malignant transformation |
| Hugo Symbol | Variant Class | Variant Classification | dbSNP RS | HGVSc | HGVSp | HGVSp Short | SWISSPROT | BIOTYPE | SIFT | PolyPhen | Tumor Sample Barcode | Tissue | Histology | Sex | Age | Stage | Therapy Types | Drugs | Outcome |
| ATP1B3 | SNV | Missense_Mutation | c.305N>T | p.Ser102Leu | p.S102L | P54709 | protein_coding | deleterious(0.03) | possibly_damaging(0.536) | TCGA-DR-A0ZM-01 | Cervix | cervical & endocervical cancer | Female | <65 | III/IV | Unspecific | Cisplatin | SD | |
| ATP1B3 | SNV | Missense_Mutation | novel | c.554N>C | p.Gly185Ala | p.G185A | P54709 | protein_coding | tolerated(0.06) | probably_damaging(0.998) | TCGA-MA-AA41-01 | Cervix | cervical & endocervical cancer | Female | <65 | I/II | Unknown | Unknown | SD |
| ATP1B3 | SNV | Missense_Mutation | c.625N>T | p.Met209Leu | p.M209L | P54709 | protein_coding | tolerated(0.36) | benign(0) | TCGA-AA-3502-01 | Colorectum | colon adenocarcinoma | Male | >=65 | I/II | Unknown | Unknown | SD | |
| ATP1B3 | SNV | Missense_Mutation | novel | c.752N>C | p.Lys251Thr | p.K251T | P54709 | protein_coding | deleterious(0) | probably_damaging(0.909) | TCGA-AZ-4315-01 | Colorectum | colon adenocarcinoma | Male | <65 | I/II | Unknown | Unknown | SD |
| ATP1B3 | SNV | Missense_Mutation | novel | c.512N>C | p.Ile171Thr | p.I171T | P54709 | protein_coding | deleterious(0) | possibly_damaging(0.608) | TCGA-CA-6717-01 | Colorectum | colon adenocarcinoma | Male | <65 | I/II | Chemotherapy | oxaliplatin | CR |
| ATP1B3 | SNV | Missense_Mutation | novel | c.325N>A | p.Asp109Asn | p.D109N | P54709 | protein_coding | tolerated(0.55) | possibly_damaging(0.499) | TCGA-F5-6814-01 | Colorectum | rectum adenocarcinoma | Male | <65 | I/II | Unknown | Unknown | SD |
| ATP1B3 | insertion | In_Frame_Ins | novel | c.184_185insATG | p.Leu62delinsHisVal | p.L62delinsHV | P54709 | protein_coding | TCGA-AM-5820-01 | Colorectum | colon adenocarcinoma | Female | <65 | I/II | Unknown | Unknown | SD | ||
| ATP1B3 | insertion | Frame_Shift_Ins | novel | c.186_187insTGGC | p.Gln63TrpfsTer7 | p.Q63Wfs*7 | P54709 | protein_coding | TCGA-AM-5820-01 | Colorectum | colon adenocarcinoma | Female | <65 | I/II | Unknown | Unknown | SD | ||
| ATP1B3 | deletion | Frame_Shift_Del | c.658delN | p.Lys221AsnfsTer26 | p.K221Nfs*26 | P54709 | protein_coding | TCGA-AZ-4615-01 | Colorectum | colon adenocarcinoma | Male | >=65 | III/IV | Chemotherapy | xeloda | PD | |||
| ATP1B3 | SNV | Missense_Mutation | novel | c.301N>C | p.Thr101Pro | p.T101P | P54709 | protein_coding | tolerated(0.14) | benign(0.295) | TCGA-A5-A0G2-01 | Endometrium | uterine corpus endometrioid carcinoma | Female | <65 | III/IV | Unknown | Unknown | SD |
| Page: 1 2 3 |
Top |
Related drugs of malignant transformation related genes |
| Identification of chemicals and drugs interact with genes involved in malignant transfromation |
| (DGIdb 4.0) |
| Entrez ID | Symbol | Category | Interaction Types | Drug Claim Name | Drug Name | PMIDs |
| 483 | ATP1B3 | ENZYME, TRANSPORTER, DRUGGABLE GENOME | inhibitor | CHEMBL3545057 | ACETYLDIGITOXIN | |
| 483 | ATP1B3 | ENZYME, TRANSPORTER, DRUGGABLE GENOME | inhibitor | CHEMBL254219 | DIGITOXIN | |
| 483 | ATP1B3 | ENZYME, TRANSPORTER, DRUGGABLE GENOME | inhibitor | CHEMBL1614 | DESLANOSIDE | |
| 483 | ATP1B3 | ENZYME, TRANSPORTER, DRUGGABLE GENOME | inhibitor | CHEMBL1751 | DIGOXIN |
| Page: 1 |

Copyright 2023-Present -The University of Texas Health Science Center at Houston |