
|
|||||
|
 | |
| |
| |
| |
| |
| |
|
Gene: ARID2 |
Gene summary for ARID2 |
| Gene information | Species | Human | Gene symbol | ARID2 | Gene ID | 196528 |
| Gene name | AT-rich interaction domain 2 | |
| Gene Alias | BAF200 | |
| Cytomap | 12q12 | |
| Gene Type | protein-coding | GO ID | GO:0000018 | UniProtAcc | Q68CP9 |
Top |
Malignant transformation analysis |
| Identification of the aberrant gene expression in precancerous and cancerous lesions by comparing the gene expression of stem-like cells in diseased tissues with normal stem cells |
| Entrez ID | Symbol | Replicates | Species | Organ | Tissue | Adj P-value | Log2FC | Malignancy |
| 196528 | ARID2 | CCI_1 | Human | Cervix | CC | 1.28e-09 | 7.48e-01 | 0.528 |
| 196528 | ARID2 | CCI_2 | Human | Cervix | CC | 7.81e-13 | 1.57e+00 | 0.5249 |
| 196528 | ARID2 | CCI_3 | Human | Cervix | CC | 4.37e-13 | 9.62e-01 | 0.516 |
| 196528 | ARID2 | HTA11_3410_2000001011 | Human | Colorectum | AD | 7.57e-16 | -6.45e-01 | 0.0155 |
| 196528 | ARID2 | HTA11_3361_2000001011 | Human | Colorectum | AD | 1.19e-02 | -4.54e-01 | -0.1207 |
| 196528 | ARID2 | HTA11_5212_2000001011 | Human | Colorectum | AD | 3.73e-04 | -7.72e-01 | -0.2061 |
| 196528 | ARID2 | HTA11_5216_2000001011 | Human | Colorectum | SER | 2.18e-02 | -6.02e-01 | -0.1462 |
| 196528 | ARID2 | HTA11_7862_2000001011 | Human | Colorectum | AD | 6.15e-04 | -6.60e-01 | -0.0179 |
| 196528 | ARID2 | HTA11_866_3004761011 | Human | Colorectum | AD | 4.58e-13 | -5.35e-01 | 0.096 |
| 196528 | ARID2 | HTA11_10711_2000001011 | Human | Colorectum | AD | 1.63e-04 | -4.50e-01 | 0.0338 |
| 196528 | ARID2 | HTA11_7696_3000711011 | Human | Colorectum | AD | 6.43e-09 | -4.10e-01 | 0.0674 |
| 196528 | ARID2 | HTA11_99999970781_79442 | Human | Colorectum | MSS | 1.01e-07 | -3.58e-01 | 0.294 |
| 196528 | ARID2 | HTA11_99999965062_69753 | Human | Colorectum | MSI-H | 2.62e-02 | 7.36e-01 | 0.3487 |
| 196528 | ARID2 | HTA11_99999974143_84620 | Human | Colorectum | MSS | 2.30e-18 | -5.55e-01 | 0.3005 |
| 196528 | ARID2 | F007 | Human | Colorectum | FAP | 4.48e-02 | -2.25e-01 | 0.1176 |
| 196528 | ARID2 | A001-C-207 | Human | Colorectum | FAP | 1.46e-03 | -2.33e-01 | 0.1278 |
| 196528 | ARID2 | A015-C-203 | Human | Colorectum | FAP | 3.78e-34 | -5.22e-01 | -0.1294 |
| 196528 | ARID2 | A015-C-204 | Human | Colorectum | FAP | 1.89e-06 | -3.37e-01 | -0.0228 |
| 196528 | ARID2 | A014-C-040 | Human | Colorectum | FAP | 1.45e-04 | -2.68e-01 | -0.1184 |
| 196528 | ARID2 | A002-C-201 | Human | Colorectum | FAP | 2.71e-16 | -4.04e-01 | 0.0324 |
| Page: 1 2 3 4 5 6 7 8 |
| Tissue | Expression Dynamics | Abbreviation |
| Cervix |  | CC: Cervix cancer |
| HSIL_HPV: HPV-infected high-grade squamous intraepithelial lesions | ||
| N_HPV: HPV-infected normal cervix | ||
| Colorectum (GSE201348) |  | FAP: Familial adenomatous polyposis |
| CRC: Colorectal cancer | ||
| Colorectum (HTA11) |  | AD: Adenomas |
| SER: Sessile serrated lesions | ||
| MSI-H: Microsatellite-high colorectal cancer | ||
| MSS: Microsatellite stable colorectal cancer | ||
| Endometrium | 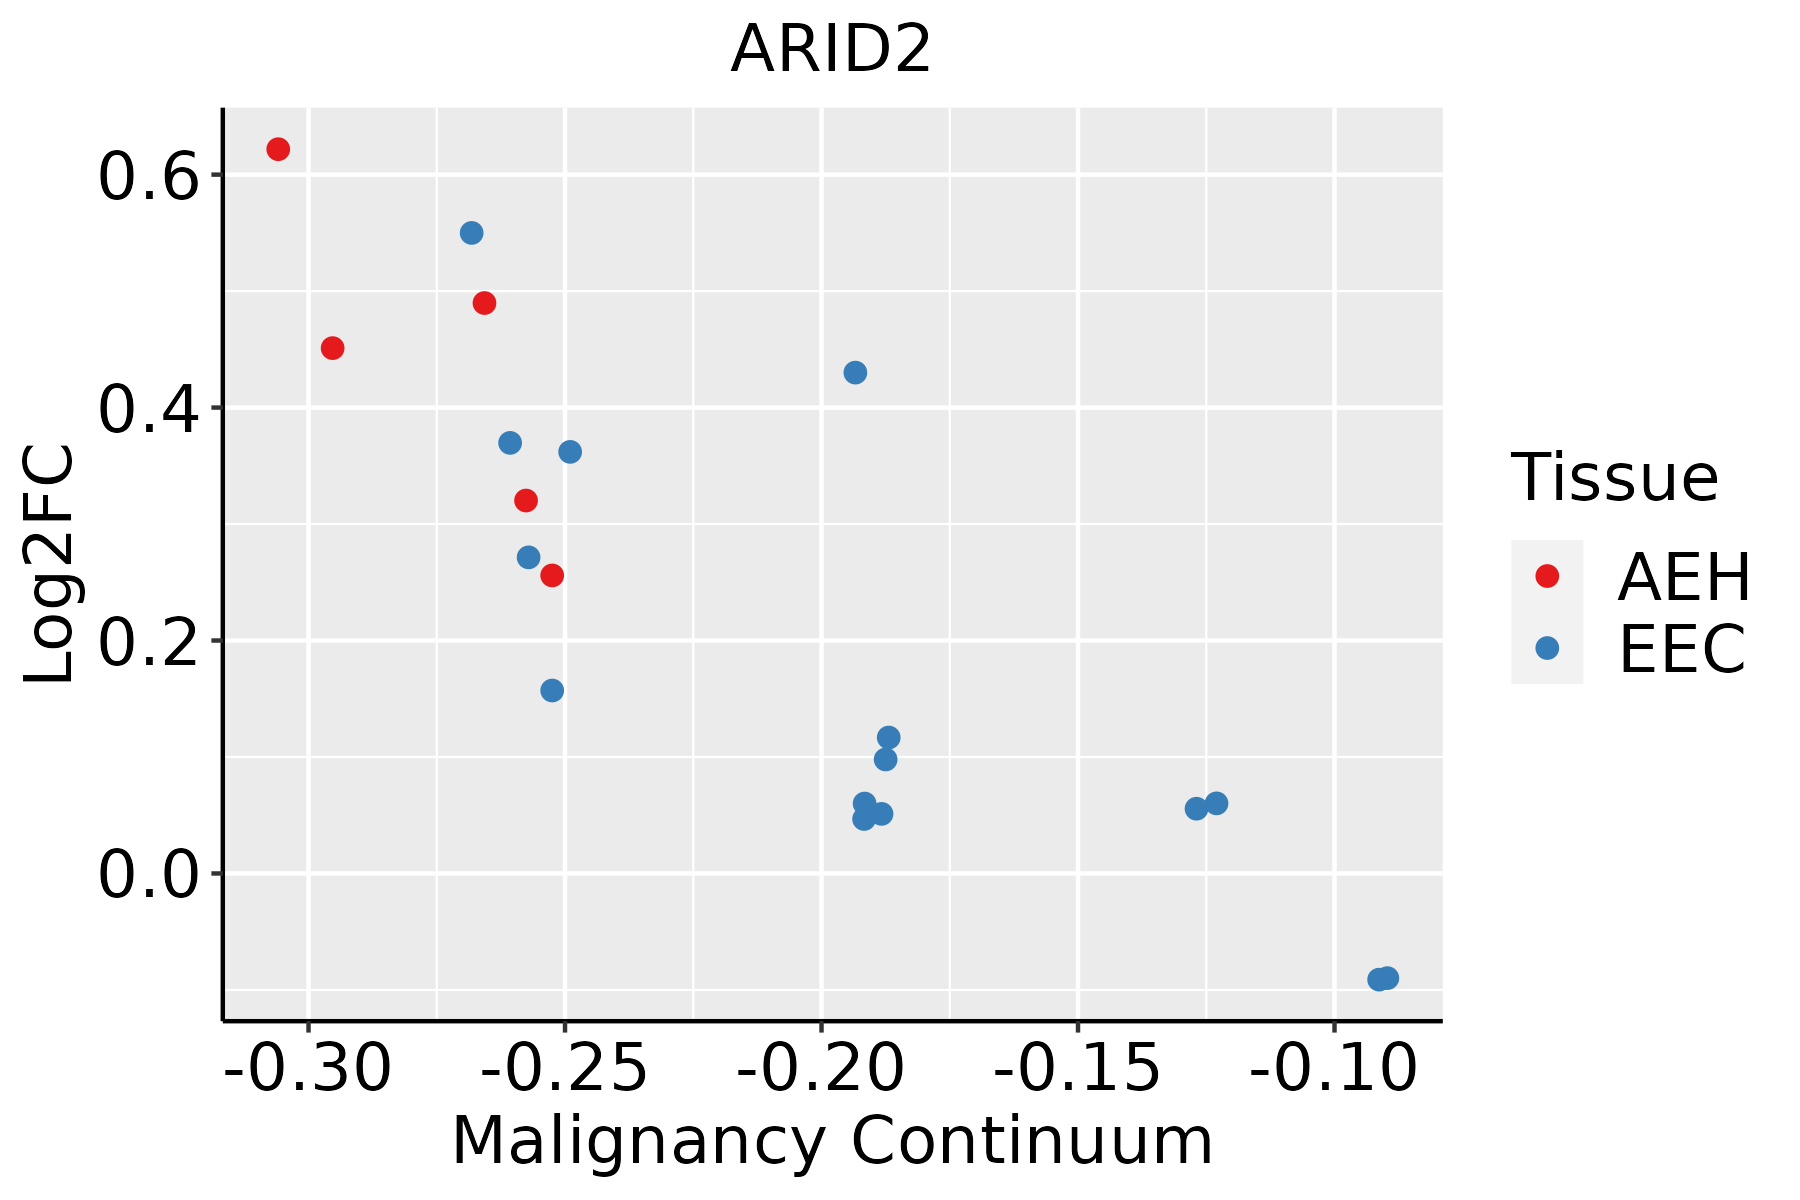 | AEH: Atypical endometrial hyperplasia |
| EEC: Endometrioid Cancer | ||
| Esophagus | 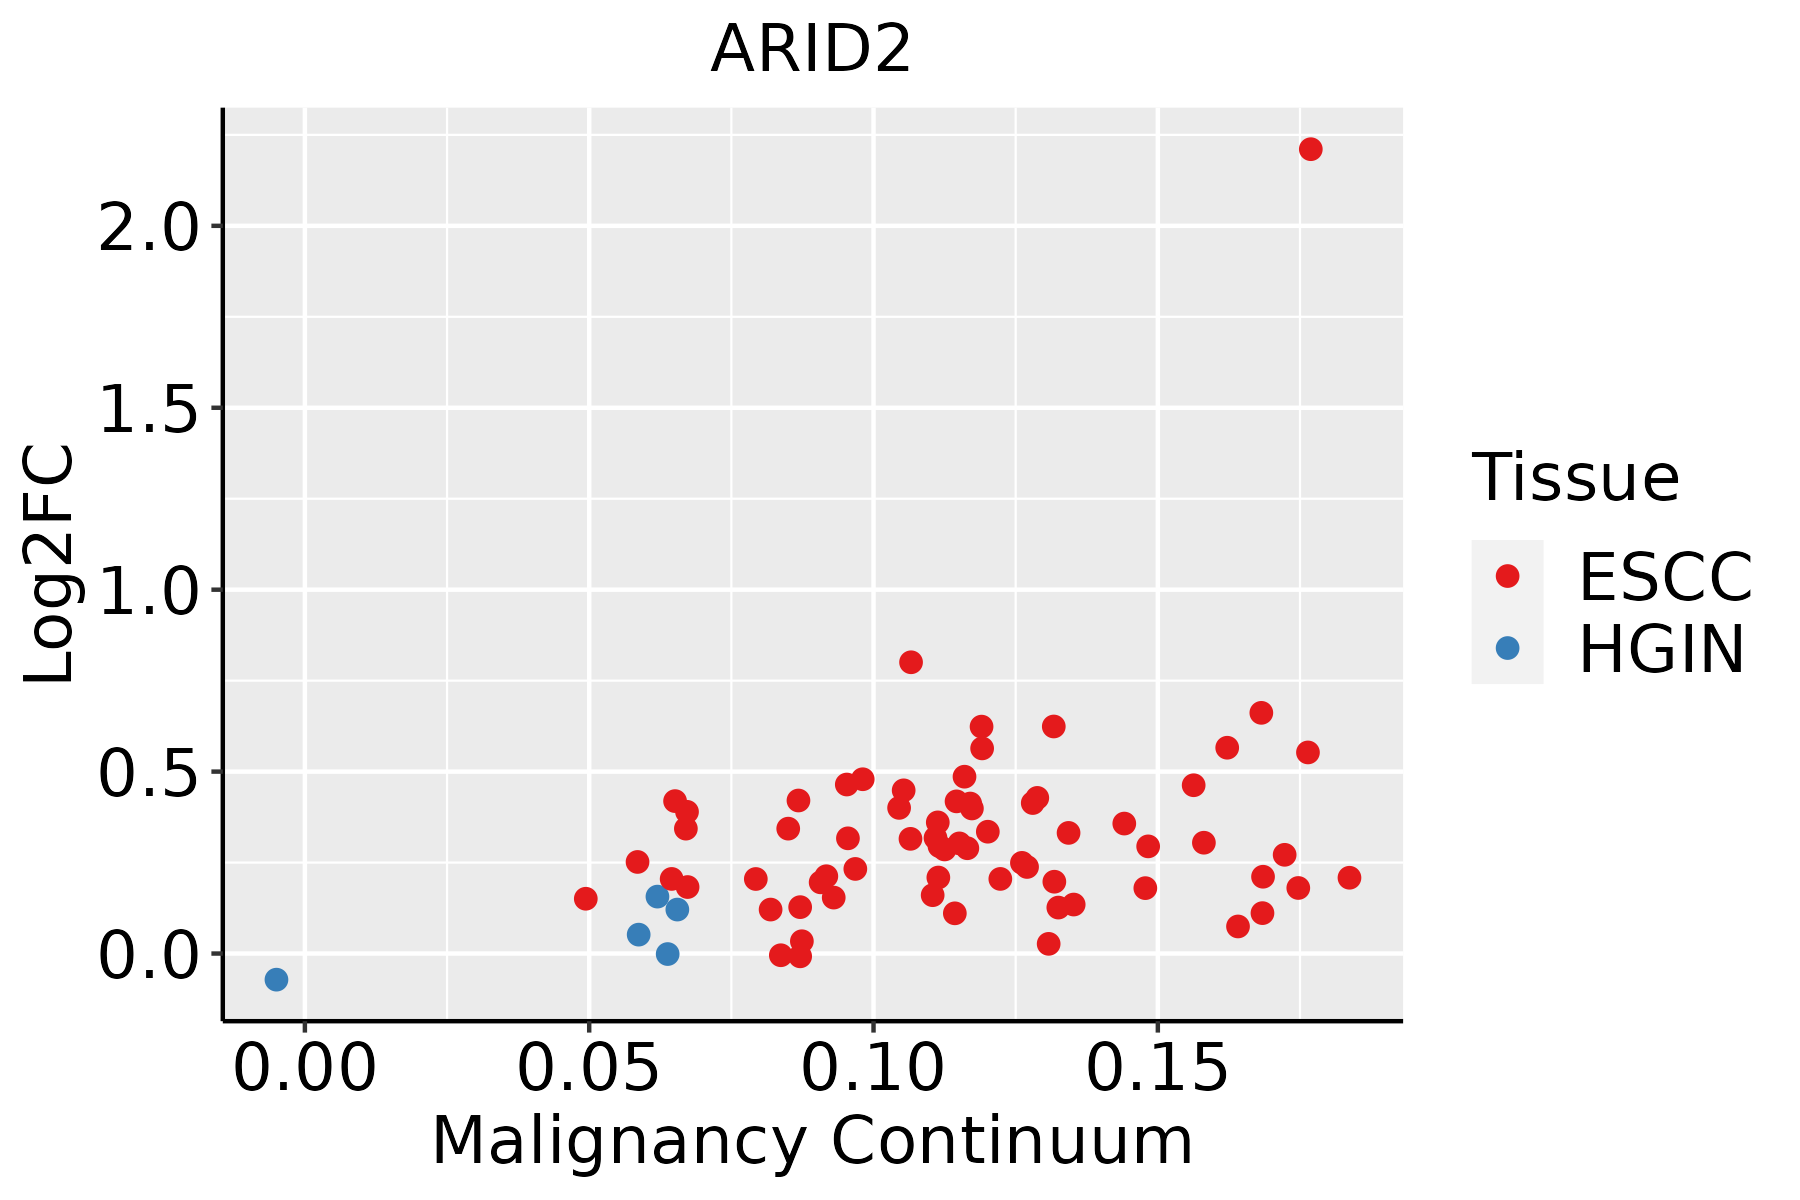 | ESCC: Esophageal squamous cell carcinoma |
| HGIN: High-grade intraepithelial neoplasias | ||
| LGIN: Low-grade intraepithelial neoplasias | ||
| Lung | 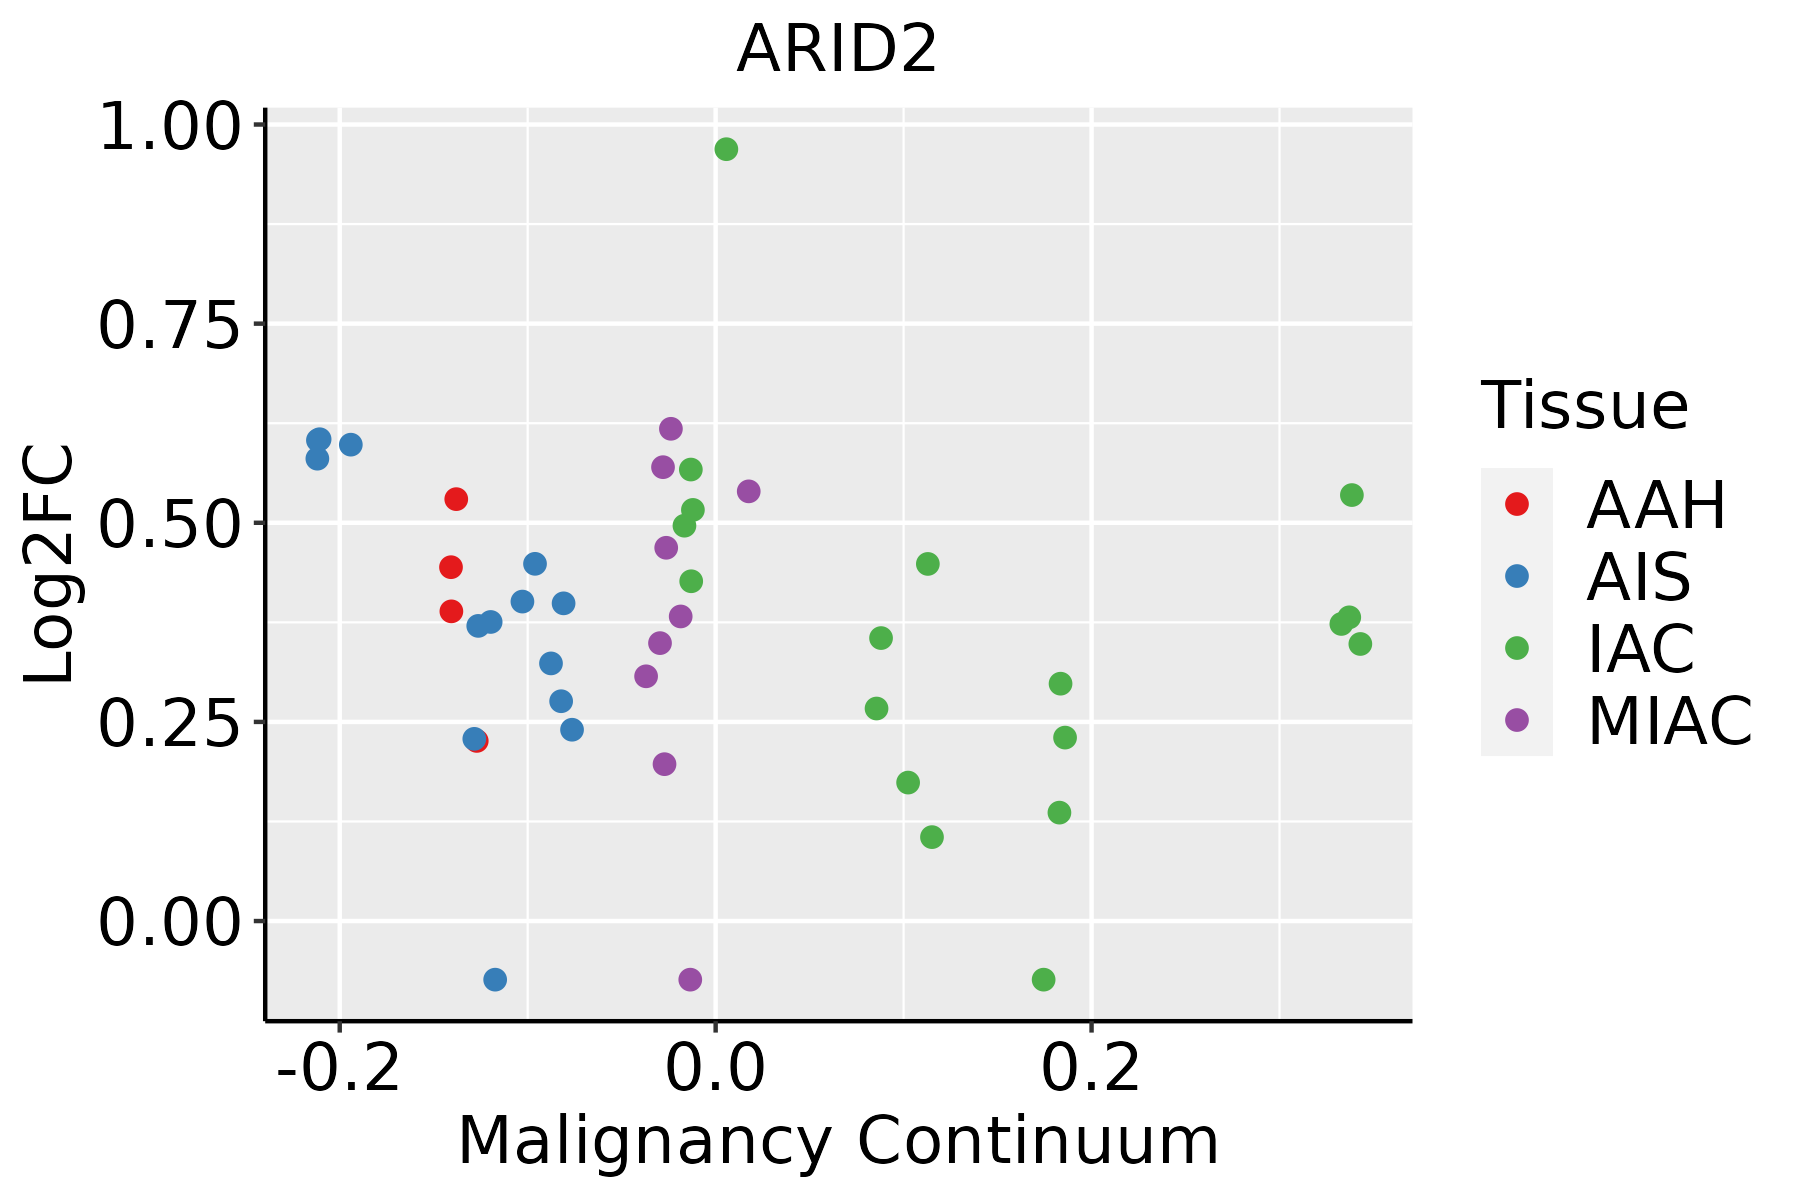 | AAH: Atypical adenomatous hyperplasia |
| AIS: Adenocarcinoma in situ | ||
| IAC: Invasive lung adenocarcinoma | ||
| MIA: Minimally invasive adenocarcinoma | ||
| Oral Cavity |  | EOLP: Erosive Oral lichen planus |
| LP: leukoplakia | ||
| NEOLP: Non-erosive oral lichen planus | ||
| OSCC: Oral squamous cell carcinoma | ||
| Skin |  | AK: Actinic keratosis |
| cSCC: Cutaneous squamous cell carcinoma | ||
| SCCIS:squamous cell carcinoma in situ | ||
| Thyroid | 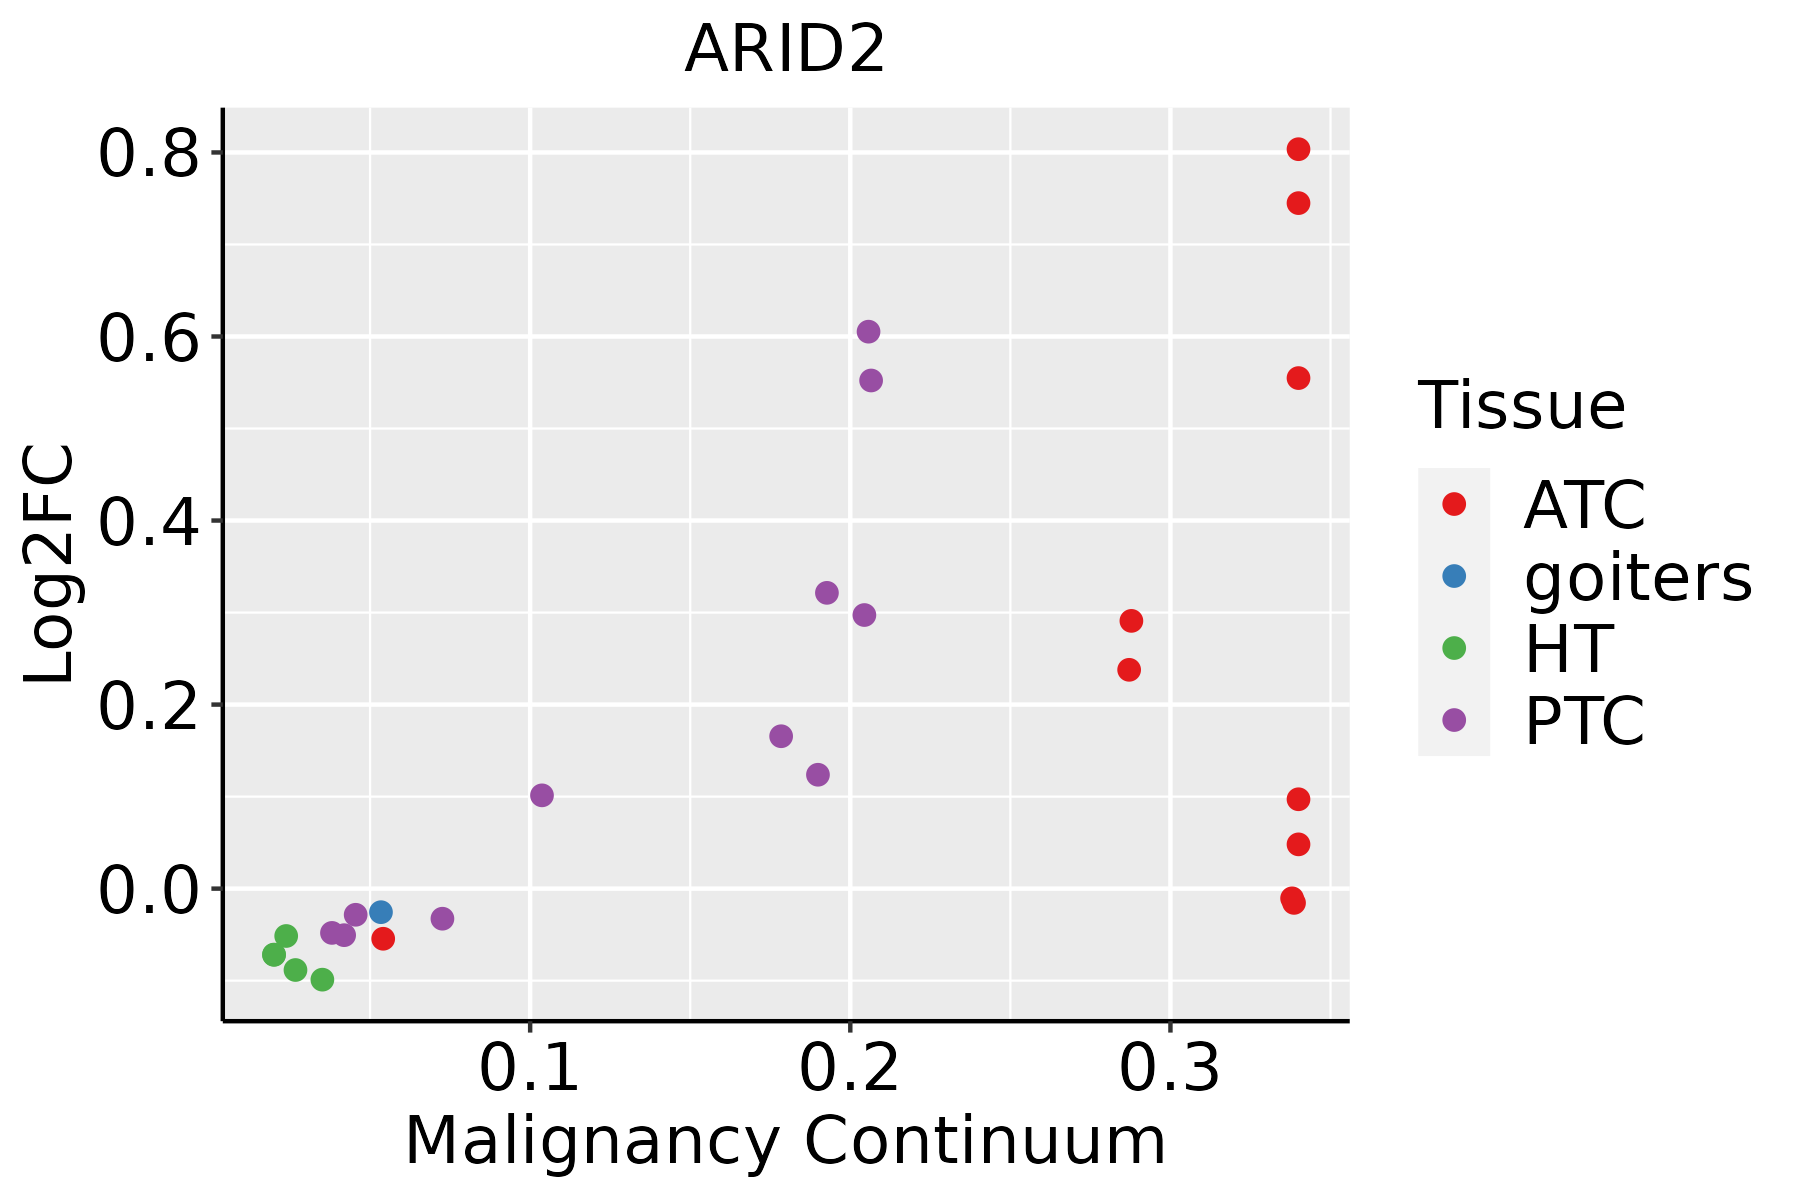 | ATC: Anaplastic thyroid cancer |
| HT: Hashimoto's thyroiditis | ||
| PTC: Papillary thyroid cancer |
| ∗log2FC in expression of this searched gene in stem-like cells from each diseased tissue sample relative to stem-like cells in normal samples in each tissue plotted against the malignancy continuum. Samples are colored based on if they are from different disease stage. |
Top |
Malignant transformation related pathway analysis |
| Find out the enriched GO biological processes and KEGG pathways involved in transition from healthy to precancer to cancer |
| Tissue | Disease Stage | Enriched GO biological Processes |
| Colorectum | AD |  |
| Colorectum | SER |  |
| Colorectum | MSS |  |
| Colorectum | MSI-H |  |
| Colorectum | FAP |  |
| ∗Top 15 enriched GO BP terms are showed in the bar plot of each disease state in each tissue. Each row represents a significant GO biological process which is colored according to the -log10(p.adjust). |
| Page: 1 2 3 4 5 6 7 8 9 |
| GO ID | Tissue | Disease Stage | Description | Gene Ratio | Bg Ratio | pvalue | p.adjust | Count |
| GO:199083011 | Cervix | N_HPV | cellular response to leukemia inhibitory factor | 8/534 | 94/18723 | 5.41e-03 | 3.87e-02 | 8 |
| GO:006053722 | Cervix | N_HPV | muscle tissue development | 21/534 | 403/18723 | 6.10e-03 | 4.21e-02 | 21 |
| GO:0048732 | Colorectum | AD | gland development | 149/3918 | 436/18723 | 6.07e-11 | 6.33e-09 | 149 |
| GO:0022411 | Colorectum | AD | cellular component disassembly | 147/3918 | 443/18723 | 8.53e-10 | 6.76e-08 | 147 |
| GO:0032984 | Colorectum | AD | protein-containing complex disassembly | 81/3918 | 224/18723 | 9.41e-08 | 4.65e-06 | 81 |
| GO:0051052 | Colorectum | AD | regulation of DNA metabolic process | 116/3918 | 359/18723 | 2.47e-07 | 1.00e-05 | 116 |
| GO:0051054 | Colorectum | AD | positive regulation of DNA metabolic process | 73/3918 | 201/18723 | 3.27e-07 | 1.29e-05 | 73 |
| GO:0061008 | Colorectum | AD | hepaticobiliary system development | 55/3918 | 150/18723 | 6.34e-06 | 1.59e-04 | 55 |
| GO:0001889 | Colorectum | AD | liver development | 54/3918 | 147/18723 | 7.20e-06 | 1.77e-04 | 54 |
| GO:2001020 | Colorectum | AD | regulation of response to DNA damage stimulus | 71/3918 | 219/18723 | 4.38e-05 | 7.65e-04 | 71 |
| GO:0006325 | Colorectum | AD | chromatin organization | 119/3918 | 409/18723 | 4.85e-05 | 8.33e-04 | 119 |
| GO:0032986 | Colorectum | AD | protein-DNA complex disassembly | 12/3918 | 20/18723 | 1.60e-04 | 2.21e-03 | 12 |
| GO:0031498 | Colorectum | AD | chromatin disassembly | 11/3918 | 20/18723 | 8.39e-04 | 8.21e-03 | 11 |
| GO:2001022 | Colorectum | AD | positive regulation of response to DNA damage stimulus | 36/3918 | 105/18723 | 1.02e-03 | 9.47e-03 | 36 |
| GO:0006337 | Colorectum | AD | nucleosome disassembly | 10/3918 | 18/18723 | 1.31e-03 | 1.15e-02 | 10 |
| GO:0090257 | Colorectum | AD | regulation of muscle system process | 73/3918 | 252/18723 | 1.46e-03 | 1.24e-02 | 73 |
| GO:0048638 | Colorectum | AD | regulation of developmental growth | 92/3918 | 330/18723 | 1.48e-03 | 1.25e-02 | 92 |
| GO:0006282 | Colorectum | AD | regulation of DNA repair | 42/3918 | 130/18723 | 1.57e-03 | 1.32e-02 | 42 |
| GO:0045926 | Colorectum | AD | negative regulation of growth | 70/3918 | 249/18723 | 4.07e-03 | 2.83e-02 | 70 |
| GO:0048568 | Colorectum | AD | embryonic organ development | 112/3918 | 427/18723 | 4.60e-03 | 3.14e-02 | 112 |
| Page: 1 2 3 4 5 6 7 8 9 10 11 12 13 14 15 16 17 18 19 20 21 22 23 24 25 26 27 28 29 30 31 32 33 34 35 |
| Pathway ID | Tissue | Disease Stage | Description | Gene Ratio | Bg Ratio | pvalue | p.adjust | qvalue | Count |
| hsa0522510 | Cervix | CC | Hepatocellular carcinoma | 40/1267 | 168/8465 | 1.52e-03 | 6.39e-03 | 3.78e-03 | 40 |
| hsa0522513 | Cervix | CC | Hepatocellular carcinoma | 40/1267 | 168/8465 | 1.52e-03 | 6.39e-03 | 3.78e-03 | 40 |
| hsa05225 | Colorectum | AD | Hepatocellular carcinoma | 59/2092 | 168/8465 | 1.50e-03 | 8.69e-03 | 5.54e-03 | 59 |
| hsa052251 | Colorectum | AD | Hepatocellular carcinoma | 59/2092 | 168/8465 | 1.50e-03 | 8.69e-03 | 5.54e-03 | 59 |
| hsa052252 | Colorectum | MSS | Hepatocellular carcinoma | 56/1875 | 168/8465 | 5.04e-04 | 3.45e-03 | 2.11e-03 | 56 |
| hsa052253 | Colorectum | MSS | Hepatocellular carcinoma | 56/1875 | 168/8465 | 5.04e-04 | 3.45e-03 | 2.11e-03 | 56 |
| hsa052254 | Colorectum | FAP | Hepatocellular carcinoma | 43/1404 | 168/8465 | 1.78e-03 | 8.99e-03 | 5.47e-03 | 43 |
| hsa052255 | Colorectum | FAP | Hepatocellular carcinoma | 43/1404 | 168/8465 | 1.78e-03 | 8.99e-03 | 5.47e-03 | 43 |
| hsa052256 | Colorectum | CRC | Hepatocellular carcinoma | 37/1091 | 168/8465 | 6.38e-04 | 5.89e-03 | 3.99e-03 | 37 |
| hsa052257 | Colorectum | CRC | Hepatocellular carcinoma | 37/1091 | 168/8465 | 6.38e-04 | 5.89e-03 | 3.99e-03 | 37 |
| hsa0522518 | Esophagus | ESCC | Hepatocellular carcinoma | 109/4205 | 168/8465 | 4.27e-05 | 1.88e-04 | 9.64e-05 | 109 |
| hsa0522519 | Esophagus | ESCC | Hepatocellular carcinoma | 109/4205 | 168/8465 | 4.27e-05 | 1.88e-04 | 9.64e-05 | 109 |
| hsa052259 | Lung | IAC | Hepatocellular carcinoma | 33/1053 | 168/8465 | 4.77e-03 | 2.15e-02 | 1.43e-02 | 33 |
| hsa0522512 | Lung | IAC | Hepatocellular carcinoma | 33/1053 | 168/8465 | 4.77e-03 | 2.15e-02 | 1.43e-02 | 33 |
| hsa0522521 | Lung | AIS | Hepatocellular carcinoma | 31/961 | 168/8465 | 4.11e-03 | 2.15e-02 | 1.38e-02 | 31 |
| hsa0522531 | Lung | AIS | Hepatocellular carcinoma | 31/961 | 168/8465 | 4.11e-03 | 2.15e-02 | 1.38e-02 | 31 |
| hsa0522516 | Oral cavity | OSCC | Hepatocellular carcinoma | 97/3704 | 168/8465 | 1.63e-04 | 5.52e-04 | 2.81e-04 | 97 |
| hsa0522517 | Oral cavity | OSCC | Hepatocellular carcinoma | 97/3704 | 168/8465 | 1.63e-04 | 5.52e-04 | 2.81e-04 | 97 |
| hsa0522523 | Oral cavity | EOLP | Hepatocellular carcinoma | 39/1218 | 168/8465 | 1.35e-03 | 4.80e-03 | 2.83e-03 | 39 |
| hsa0522533 | Oral cavity | EOLP | Hepatocellular carcinoma | 39/1218 | 168/8465 | 1.35e-03 | 4.80e-03 | 2.83e-03 | 39 |
| Page: 1 |
Top |
Cell-cell communication analysis |
| Identification of potential cell-cell interactions between two cell types and their ligand-receptor pairs for different disease states |
| Ligand | Receptor | LRpair | Pathway | Tissue | Disease Stage |
| Page: 1 |
Top |
Single-cell gene regulatory network inference analysis |
| Find out the significant the regulons (TFs) and the target genes of each regulon across cell types for different disease states |
| TF | Cell Type | Tissue | Disease Stage | Target Gene | RSS | Regulon Activity |
| ∗The dot plots of a searched regulon are shown for all cell subpopulations in each disease state of each tissue based on the regulon specific score inferred using pySCENIC and by calculating the average expression. |
| Page: 1 |
Top |
Somatic mutation of malignant transformation related genes |
| Annotation of somatic variants for genes involved in malignant transformation |
| Hugo Symbol | Variant Class | Variant Classification | dbSNP RS | HGVSc | HGVSp | HGVSp Short | SWISSPROT | BIOTYPE | SIFT | PolyPhen | Tumor Sample Barcode | Tissue | Histology | Sex | Age | Stage | Therapy Types | Drugs | Outcome |
| ARID2 | SNV | Missense_Mutation | c.3931N>G | p.Lys1311Glu | p.K1311E | Q68CP9 | protein_coding | tolerated_low_confidence(0.06) | benign(0.444) | TCGA-A7-A13E-01 | Breast | breast invasive carcinoma | Female | <65 | I/II | Targeted Molecular therapy | bevacizumab | PD | |
| ARID2 | SNV | Missense_Mutation | c.4304C>T | p.Ser1435Leu | p.S1435L | Q68CP9 | protein_coding | tolerated_low_confidence(0.14) | benign(0) | TCGA-A8-A06T-01 | Breast | breast invasive carcinoma | Female | >=65 | III/IV | Hormone Therapy | anastrozole | SD | |
| ARID2 | SNV | Missense_Mutation | c.1113N>C | p.Lys371Asn | p.K371N | Q68CP9 | protein_coding | tolerated(0.08) | probably_damaging(0.991) | TCGA-AC-A23H-01 | Breast | breast invasive carcinoma | Female | >=65 | I/II | Unknown | Unknown | PD | |
| ARID2 | SNV | Missense_Mutation | novel | c.3877N>A | p.Leu1293Ile | p.L1293I | Q68CP9 | protein_coding | tolerated_low_confidence(0.08) | benign(0.019) | TCGA-AN-A046-01 | Breast | breast invasive carcinoma | Female | >=65 | I/II | Unknown | Unknown | SD |
| ARID2 | SNV | Missense_Mutation | c.5199T>G | p.Ile1733Met | p.I1733M | Q68CP9 | protein_coding | deleterious(0.01) | benign(0.294) | TCGA-AN-A0FW-01 | Breast | breast invasive carcinoma | Female | >=65 | III/IV | Unknown | Unknown | SD | |
| ARID2 | SNV | Missense_Mutation | c.4364N>A | p.Ser1455Asn | p.S1455N | Q68CP9 | protein_coding | tolerated(0.08) | benign(0) | TCGA-AO-A0JD-01 | Breast | breast invasive carcinoma | Female | <65 | III/IV | Chemotherapy | cyclophosphamide | SD | |
| ARID2 | SNV | Missense_Mutation | c.1715N>A | p.Arg572Lys | p.R572K | Q68CP9 | protein_coding | tolerated(0.1) | probably_damaging(0.987) | TCGA-BH-A0HF-01 | Breast | breast invasive carcinoma | Female | >=65 | I/II | Hormone Therapy | arimidex | SD | |
| ARID2 | SNV | Missense_Mutation | c.4531N>A | p.Glu1511Lys | p.E1511K | Q68CP9 | protein_coding | deleterious_low_confidence(0) | benign(0.257) | TCGA-BH-A0HF-01 | Breast | breast invasive carcinoma | Female | >=65 | I/II | Hormone Therapy | arimidex | SD | |
| ARID2 | SNV | Missense_Mutation | c.2713C>A | p.Gln905Lys | p.Q905K | Q68CP9 | protein_coding | tolerated_low_confidence(0.38) | benign(0.01) | TCGA-BH-A18N-01 | Breast | breast invasive carcinoma | Female | >=65 | I/II | Unknown | Unknown | SD | |
| ARID2 | SNV | Missense_Mutation | novel | c.4758N>T | p.Gln1586His | p.Q1586H | Q68CP9 | protein_coding | deleterious(0.02) | possibly_damaging(0.564) | TCGA-BH-A2L8-01 | Breast | breast invasive carcinoma | Female | <65 | I/II | Chemotherapy | cytoxan | CR |
| Page: 1 2 3 4 5 6 7 8 9 10 11 12 13 14 15 16 17 18 19 20 21 22 23 |
Top |
Related drugs of malignant transformation related genes |
| Identification of chemicals and drugs interact with genes involved in malignant transfromation |
| (DGIdb 4.0) |
| Entrez ID | Symbol | Category | Interaction Types | Drug Claim Name | Drug Name | PMIDs |
| Page: 1 |

Copyright 2023-Present -The University of Texas Health Science Center at Houston |