
|
|||||
|
 | |
| |
| |
| |
| |
| |
|
Gene: ARFIP1 |
Gene summary for ARFIP1 |
| Gene information | Species | Human | Gene symbol | ARFIP1 | Gene ID | 27236 |
| Gene name | ADP ribosylation factor interacting protein 1 | |
| Gene Alias | HSU52521 | |
| Cytomap | 4q31.3 | |
| Gene Type | protein-coding | GO ID | GO:0006810 | UniProtAcc | B4E273 |
Top |
Malignant transformation analysis |
| Identification of the aberrant gene expression in precancerous and cancerous lesions by comparing the gene expression of stem-like cells in diseased tissues with normal stem cells |
| Entrez ID | Symbol | Replicates | Species | Organ | Tissue | Adj P-value | Log2FC | Malignancy |
| 27236 | ARFIP1 | HTA11_3410_2000001011 | Human | Colorectum | AD | 2.06e-21 | -6.84e-01 | 0.0155 |
| 27236 | ARFIP1 | HTA11_3361_2000001011 | Human | Colorectum | AD | 9.23e-06 | -5.73e-01 | -0.1207 |
| 27236 | ARFIP1 | HTA11_696_2000001011 | Human | Colorectum | AD | 1.64e-06 | -4.15e-01 | -0.1464 |
| 27236 | ARFIP1 | HTA11_866_2000001011 | Human | Colorectum | AD | 2.29e-03 | -3.46e-01 | -0.1001 |
| 27236 | ARFIP1 | HTA11_5216_2000001011 | Human | Colorectum | SER | 1.91e-02 | -6.40e-01 | -0.1462 |
| 27236 | ARFIP1 | HTA11_866_3004761011 | Human | Colorectum | AD | 8.48e-16 | -6.04e-01 | 0.096 |
| 27236 | ARFIP1 | HTA11_4255_2000001011 | Human | Colorectum | SER | 2.20e-02 | -5.84e-01 | 0.0446 |
| 27236 | ARFIP1 | HTA11_8622_2000001021 | Human | Colorectum | SER | 7.00e-04 | -6.66e-01 | 0.0528 |
| 27236 | ARFIP1 | HTA11_10711_2000001011 | Human | Colorectum | AD | 8.25e-06 | -5.21e-01 | 0.0338 |
| 27236 | ARFIP1 | HTA11_7696_3000711011 | Human | Colorectum | AD | 3.08e-18 | -5.44e-01 | 0.0674 |
| 27236 | ARFIP1 | HTA11_99999970781_79442 | Human | Colorectum | MSS | 3.78e-03 | -3.17e-01 | 0.294 |
| 27236 | ARFIP1 | HTA11_99999965104_69814 | Human | Colorectum | MSS | 6.36e-04 | -3.37e-01 | 0.281 |
| 27236 | ARFIP1 | HTA11_99999971662_82457 | Human | Colorectum | MSS | 1.35e-05 | -3.81e-01 | 0.3859 |
| 27236 | ARFIP1 | HTA11_99999973899_84307 | Human | Colorectum | MSS | 2.23e-05 | -5.57e-01 | 0.2585 |
| 27236 | ARFIP1 | HTA11_99999974143_84620 | Human | Colorectum | MSS | 5.43e-26 | -6.83e-01 | 0.3005 |
| 27236 | ARFIP1 | A015-C-203 | Human | Colorectum | FAP | 7.88e-29 | -3.04e-01 | -0.1294 |
| 27236 | ARFIP1 | A015-C-204 | Human | Colorectum | FAP | 7.76e-05 | -2.00e-01 | -0.0228 |
| 27236 | ARFIP1 | A014-C-040 | Human | Colorectum | FAP | 4.96e-03 | -2.65e-01 | -0.1184 |
| 27236 | ARFIP1 | A002-C-201 | Human | Colorectum | FAP | 2.11e-16 | -4.06e-01 | 0.0324 |
| 27236 | ARFIP1 | A002-C-203 | Human | Colorectum | FAP | 3.36e-05 | -3.76e-03 | 0.2786 |
| Page: 1 2 3 4 5 6 7 8 |
| Tissue | Expression Dynamics | Abbreviation |
| Colorectum (GSE201348) | 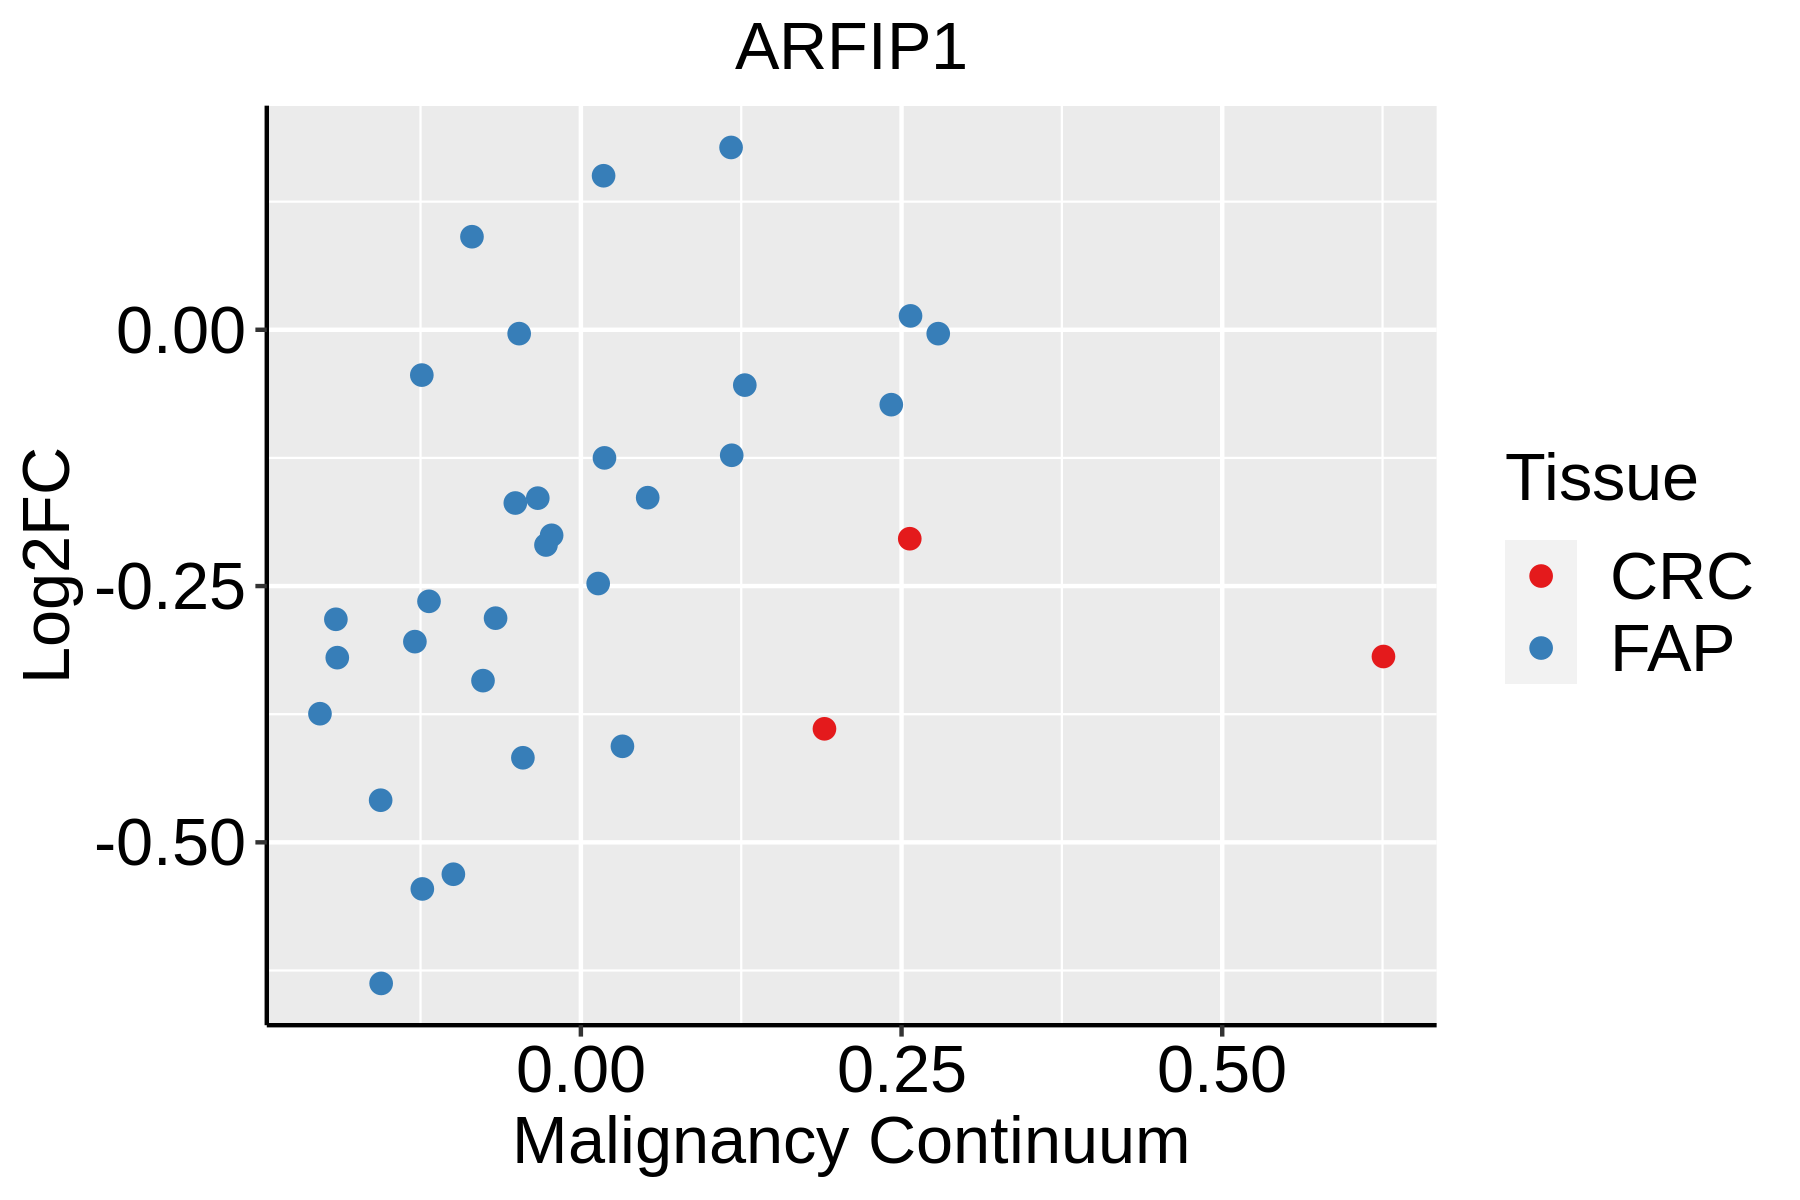 | FAP: Familial adenomatous polyposis |
| CRC: Colorectal cancer | ||
| Colorectum (HTA11) |  | AD: Adenomas |
| SER: Sessile serrated lesions | ||
| MSI-H: Microsatellite-high colorectal cancer | ||
| MSS: Microsatellite stable colorectal cancer | ||
| Esophagus | 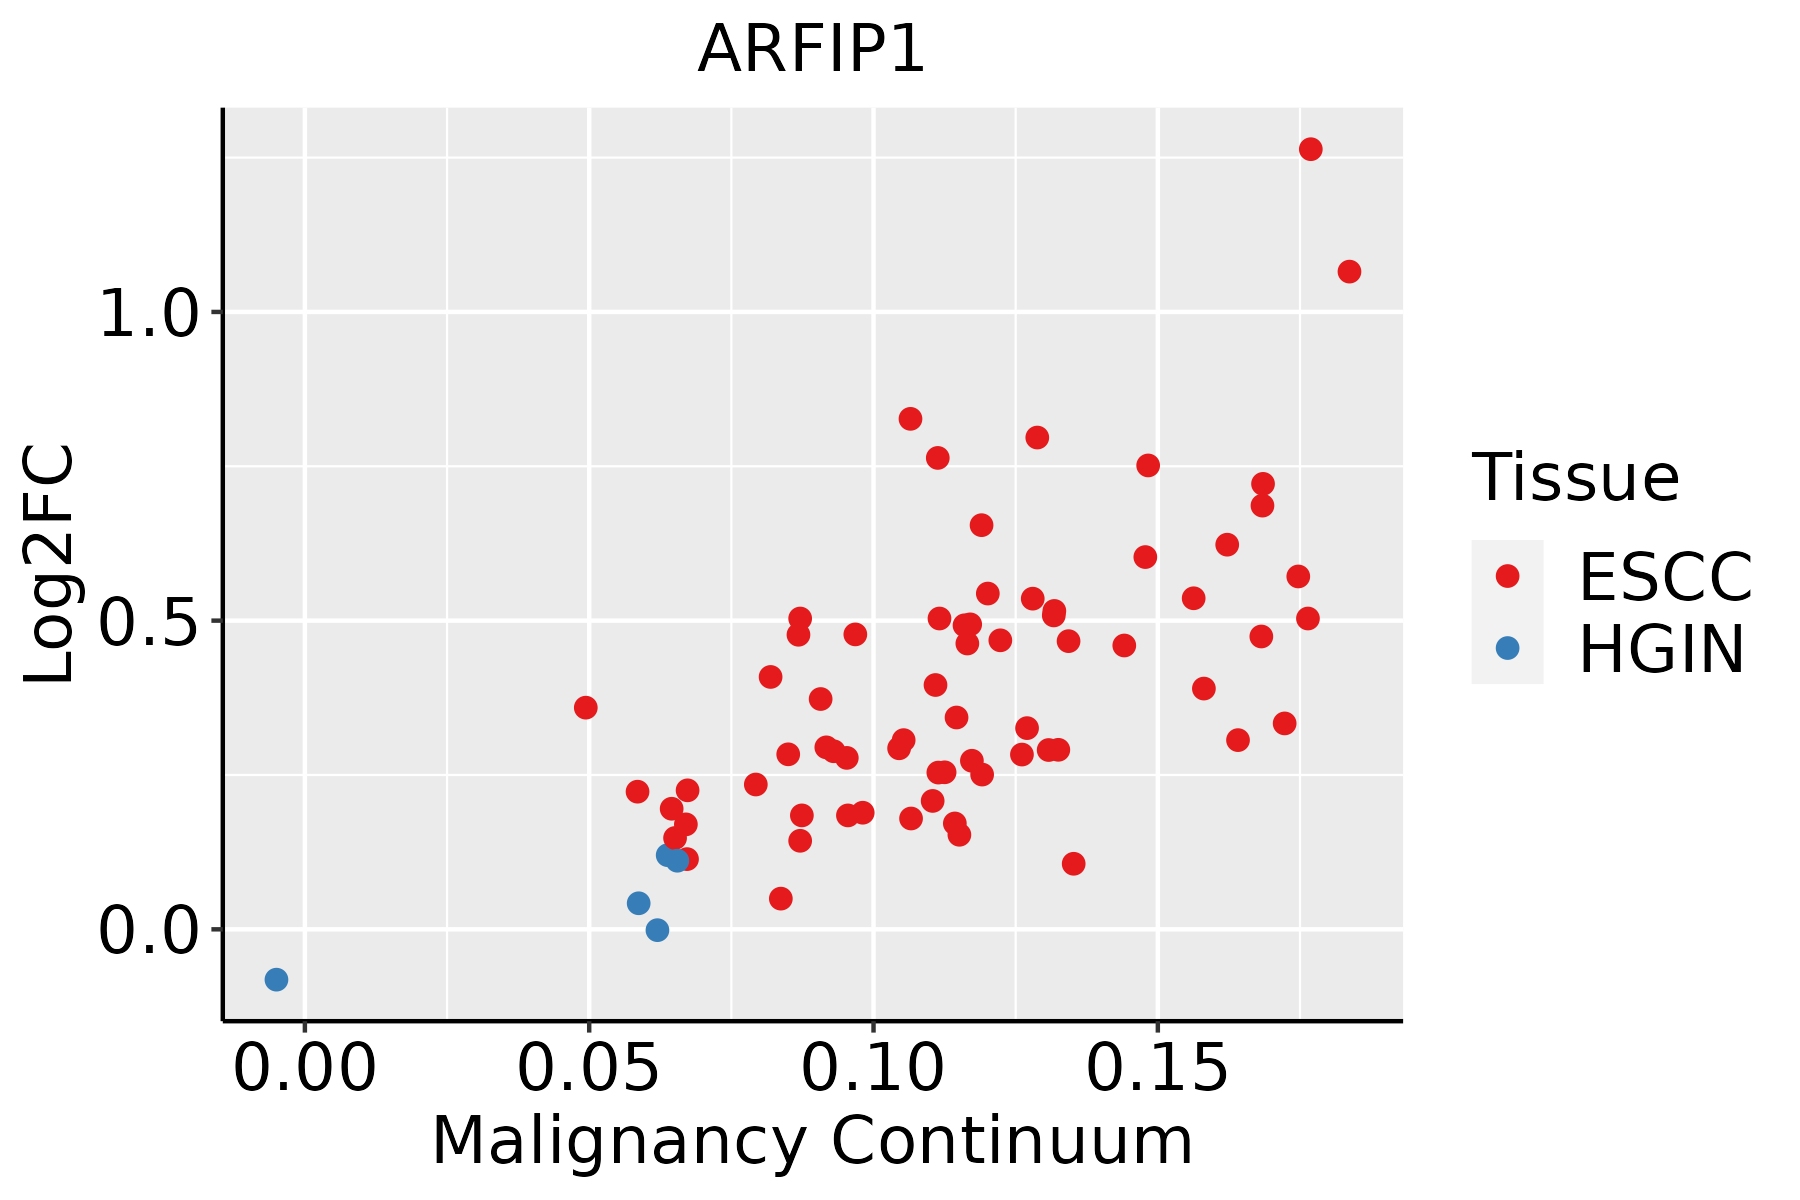 | ESCC: Esophageal squamous cell carcinoma |
| HGIN: High-grade intraepithelial neoplasias | ||
| LGIN: Low-grade intraepithelial neoplasias | ||
| Liver | 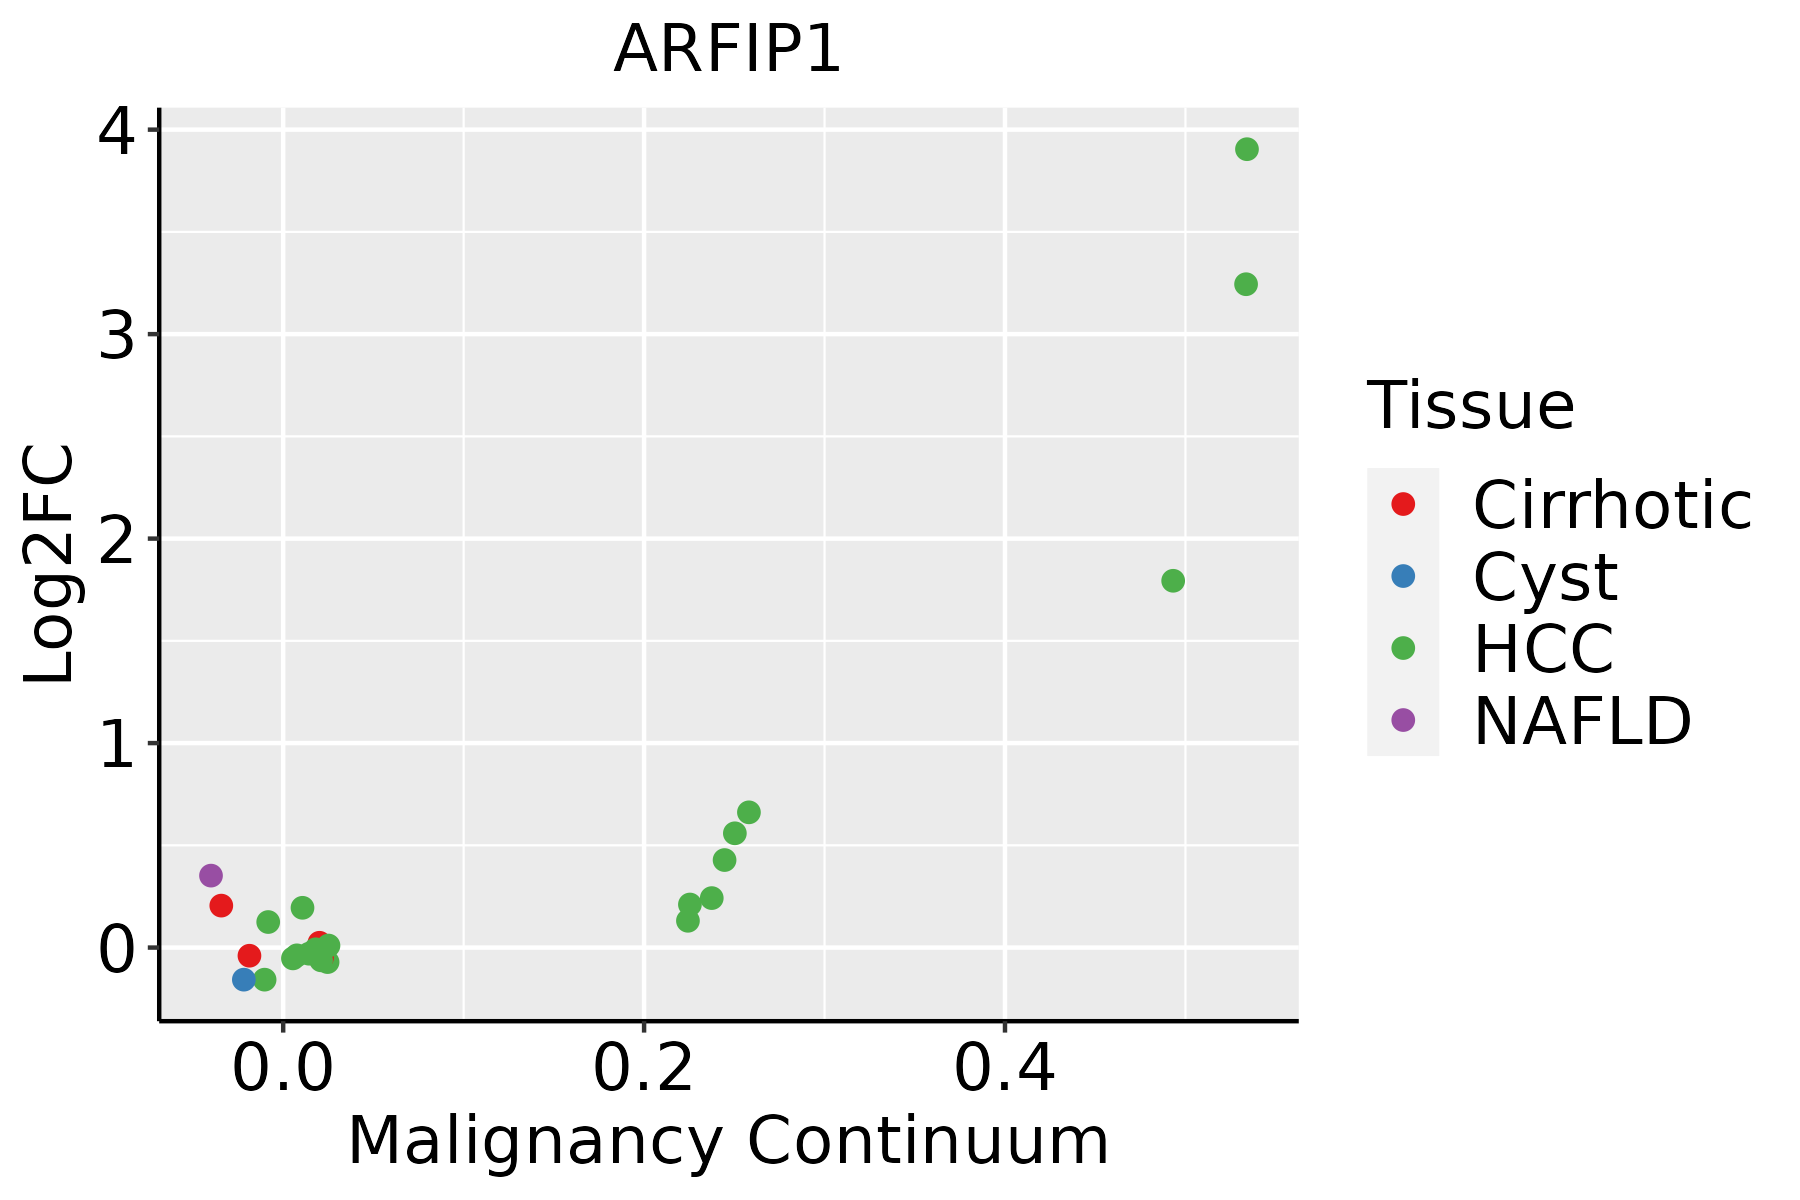 | HCC: Hepatocellular carcinoma |
| NAFLD: Non-alcoholic fatty liver disease | ||
| Oral Cavity | 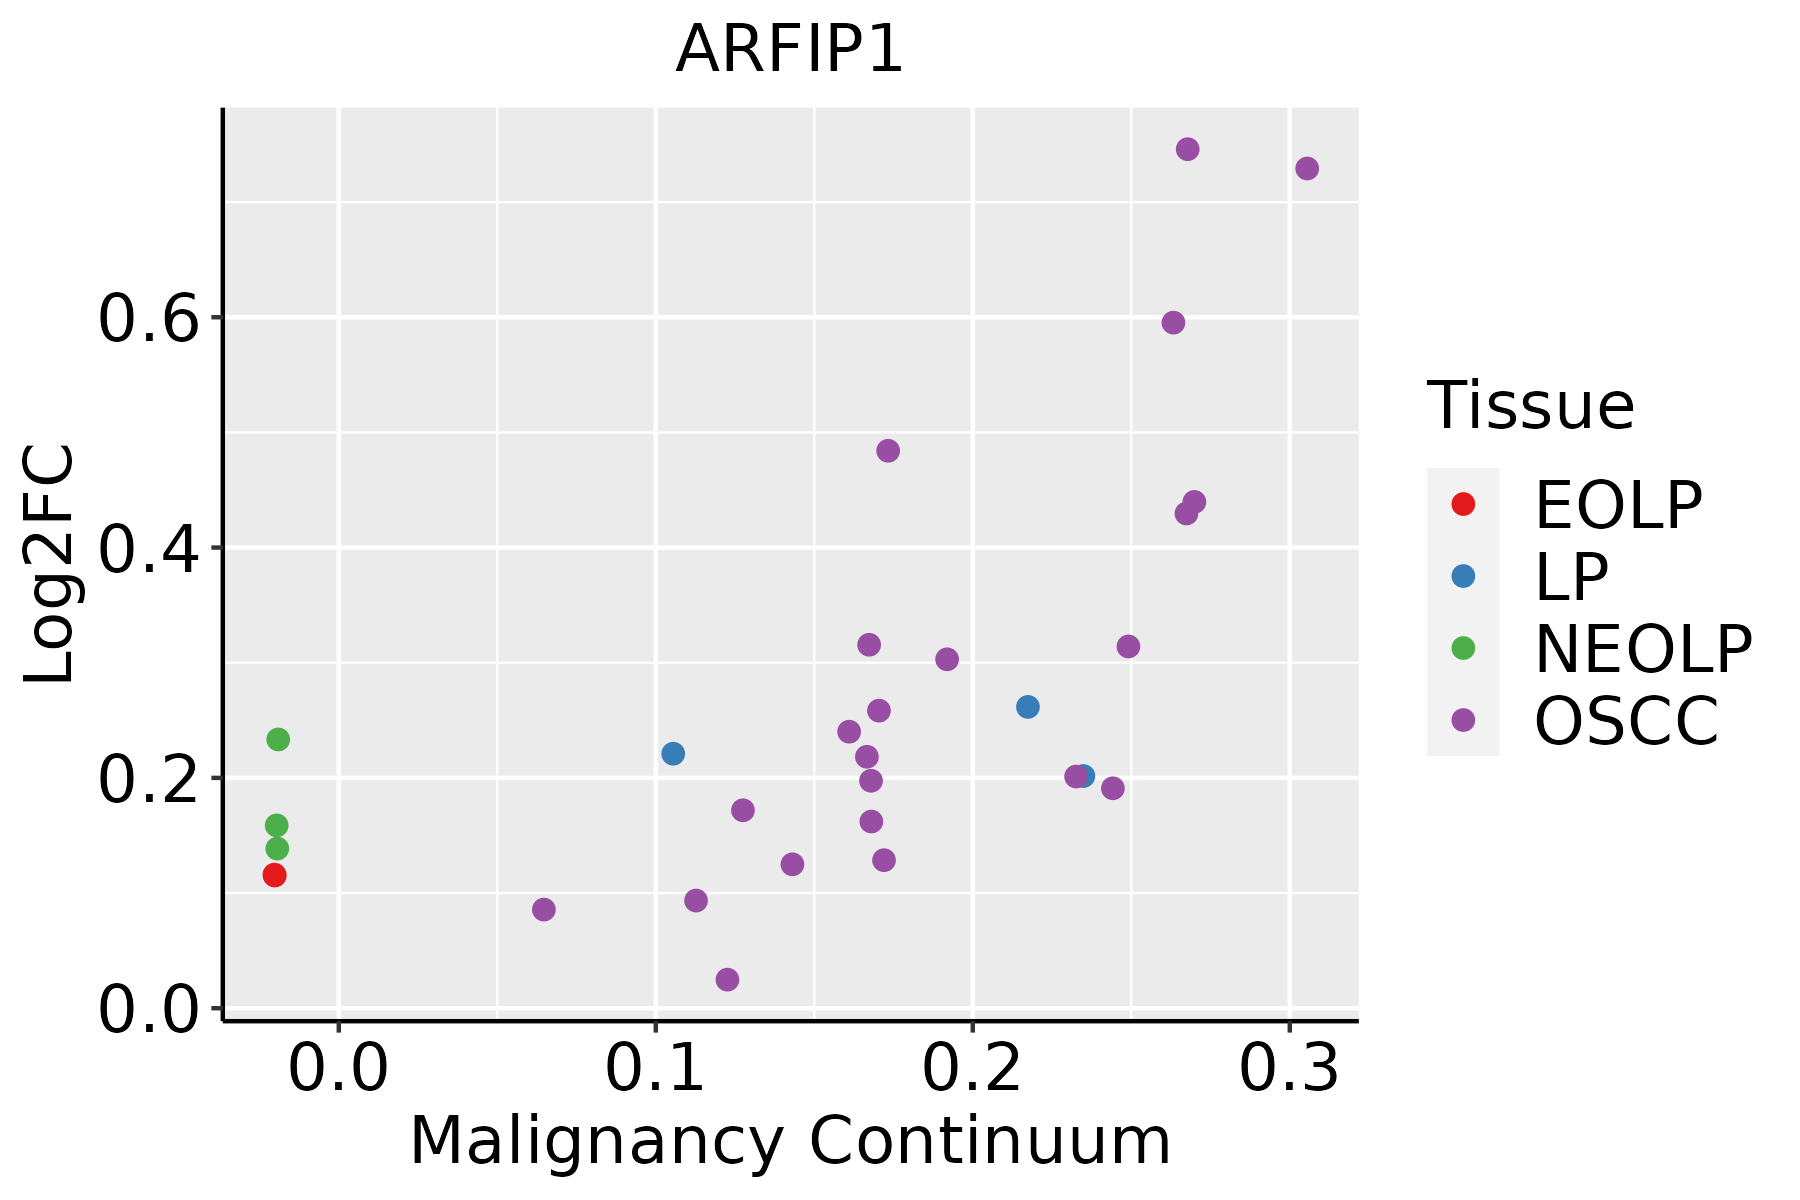 | EOLP: Erosive Oral lichen planus |
| LP: leukoplakia | ||
| NEOLP: Non-erosive oral lichen planus | ||
| OSCC: Oral squamous cell carcinoma | ||
| Thyroid |  | ATC: Anaplastic thyroid cancer |
| HT: Hashimoto's thyroiditis | ||
| PTC: Papillary thyroid cancer |
| ∗log2FC in expression of this searched gene in stem-like cells from each diseased tissue sample relative to stem-like cells in normal samples in each tissue plotted against the malignancy continuum. Samples are colored based on if they are from different disease stage. |
Top |
Malignant transformation related pathway analysis |
| Find out the enriched GO biological processes and KEGG pathways involved in transition from healthy to precancer to cancer |
| Tissue | Disease Stage | Enriched GO biological Processes |
| Colorectum | AD |  |
| Colorectum | SER |  |
| Colorectum | MSS |  |
| Colorectum | MSI-H |  |
| Colorectum | FAP |  |
| ∗Top 15 enriched GO BP terms are showed in the bar plot of each disease state in each tissue. Each row represents a significant GO biological process which is colored according to the -log10(p.adjust). |
| Page: 1 2 3 4 5 6 7 8 9 |
| GO ID | Tissue | Disease Stage | Description | Gene Ratio | Bg Ratio | pvalue | p.adjust | Count |
| GO:00308331 | Colorectum | SER | regulation of actin filament polymerization | 64/2897 | 172/18723 | 2.42e-12 | 5.70e-10 | 64 |
| GO:00329701 | Colorectum | SER | regulation of actin filament-based process | 115/2897 | 397/18723 | 4.16e-12 | 8.80e-10 | 115 |
| GO:00322711 | Colorectum | SER | regulation of protein polymerization | 78/2897 | 233/18723 | 5.71e-12 | 1.17e-09 | 78 |
| GO:00512581 | Colorectum | SER | protein polymerization | 91/2897 | 297/18723 | 2.72e-11 | 5.06e-09 | 91 |
| GO:00432541 | Colorectum | SER | regulation of protein-containing complex assembly | 119/2897 | 428/18723 | 3.34e-11 | 5.86e-09 | 119 |
| GO:00329561 | Colorectum | SER | regulation of actin cytoskeleton organization | 104/2897 | 358/18723 | 3.68e-11 | 6.11e-09 | 104 |
| GO:00308381 | Colorectum | SER | positive regulation of actin filament polymerization | 41/2897 | 99/18723 | 4.78e-10 | 5.68e-08 | 41 |
| GO:19029051 | Colorectum | SER | positive regulation of supramolecular fiber organization | 68/2897 | 209/18723 | 5.17e-10 | 5.98e-08 | 68 |
| GO:00322731 | Colorectum | SER | positive regulation of protein polymerization | 51/2897 | 138/18723 | 5.26e-10 | 5.98e-08 | 51 |
| GO:00514951 | Colorectum | SER | positive regulation of cytoskeleton organization | 71/2897 | 226/18723 | 1.22e-09 | 1.27e-07 | 71 |
| GO:00313341 | Colorectum | SER | positive regulation of protein-containing complex assembly | 73/2897 | 237/18723 | 1.89e-09 | 1.84e-07 | 73 |
| GO:00323861 | Colorectum | SER | regulation of intracellular transport | 89/2897 | 337/18723 | 1.34e-07 | 7.96e-06 | 89 |
| GO:00450101 | Colorectum | SER | actin nucleation | 22/2897 | 52/18723 | 3.25e-06 | 1.28e-04 | 22 |
| GO:00161971 | Colorectum | SER | endosomal transport | 61/2897 | 230/18723 | 1.03e-05 | 3.35e-04 | 61 |
| GO:00343141 | Colorectum | SER | Arp2/3 complex-mediated actin nucleation | 17/2897 | 39/18723 | 2.64e-05 | 7.21e-04 | 17 |
| GO:00164821 | Colorectum | SER | cytosolic transport | 46/2897 | 168/18723 | 5.20e-05 | 1.25e-03 | 46 |
| GO:00511251 | Colorectum | SER | regulation of actin nucleation | 13/2897 | 30/18723 | 2.52e-04 | 4.23e-03 | 13 |
| GO:00507081 | Colorectum | SER | regulation of protein secretion | 63/2897 | 268/18723 | 3.42e-04 | 5.39e-03 | 63 |
| GO:00093061 | Colorectum | SER | protein secretion | 79/2897 | 359/18723 | 5.99e-04 | 8.19e-03 | 79 |
| GO:00355921 | Colorectum | SER | establishment of protein localization to extracellular region | 79/2897 | 360/18723 | 6.54e-04 | 8.77e-03 | 79 |
| Page: 1 2 3 4 5 6 7 8 9 10 11 12 13 14 15 16 17 18 19 20 |
| Pathway ID | Tissue | Disease Stage | Description | Gene Ratio | Bg Ratio | pvalue | p.adjust | qvalue | Count |
| Page: 1 |
Top |
Cell-cell communication analysis |
| Identification of potential cell-cell interactions between two cell types and their ligand-receptor pairs for different disease states |
| Ligand | Receptor | LRpair | Pathway | Tissue | Disease Stage |
| Page: 1 |
Top |
Single-cell gene regulatory network inference analysis |
| Find out the significant the regulons (TFs) and the target genes of each regulon across cell types for different disease states |
| TF | Cell Type | Tissue | Disease Stage | Target Gene | RSS | Regulon Activity |
| ∗The dot plots of a searched regulon are shown for all cell subpopulations in each disease state of each tissue based on the regulon specific score inferred using pySCENIC and by calculating the average expression. |
| Page: 1 |
Top |
Somatic mutation of malignant transformation related genes |
| Annotation of somatic variants for genes involved in malignant transformation |
| Hugo Symbol | Variant Class | Variant Classification | dbSNP RS | HGVSc | HGVSp | HGVSp Short | SWISSPROT | BIOTYPE | SIFT | PolyPhen | Tumor Sample Barcode | Tissue | Histology | Sex | Age | Stage | Therapy Types | Drugs | Outcome |
| ARFIP1 | SNV | Missense_Mutation | c.507G>C | p.Lys169Asn | p.K169N | P53367 | protein_coding | deleterious(0) | probably_damaging(0.988) | TCGA-A8-A09G-01 | Breast | breast invasive carcinoma | Female | >=65 | III/IV | Unknown | Unknown | SD | |
| ARFIP1 | SNV | Missense_Mutation | novel | c.76G>A | p.Glu26Lys | p.E26K | P53367 | protein_coding | deleterious_low_confidence(0.01) | probably_damaging(0.98) | TCGA-AN-A046-01 | Breast | breast invasive carcinoma | Female | >=65 | I/II | Unknown | Unknown | SD |
| ARFIP1 | SNV | Missense_Mutation | novel | c.1097N>G | p.Ala366Gly | p.A366G | P53367 | protein_coding | tolerated(0.3) | benign(0.077) | TCGA-BH-A1FC-01 | Breast | breast invasive carcinoma | Female | >=65 | I/II | Unknown | Unknown | SD |
| ARFIP1 | SNV | Missense_Mutation | rs146931969 | c.1004N>G | p.Asn335Ser | p.N335S | P53367 | protein_coding | tolerated(0.07) | benign(0) | TCGA-FU-A23L-01 | Cervix | cervical & endocervical cancer | Female | <65 | I/II | Chemotherapy | cisplatin | CR |
| ARFIP1 | SNV | Missense_Mutation | c.923N>A | p.Arg308His | p.R308H | P53367 | protein_coding | deleterious(0.01) | probably_damaging(0.998) | TCGA-AA-3975-01 | Colorectum | colon adenocarcinoma | Male | >=65 | I/II | Unknown | Unknown | SD | |
| ARFIP1 | SNV | Missense_Mutation | rs776711621 | c.811N>T | p.Arg271Cys | p.R271C | P53367 | protein_coding | deleterious(0) | probably_damaging(1) | TCGA-AA-A00N-01 | Colorectum | colon adenocarcinoma | Male | >=65 | I/II | Unknown | Unknown | PD |
| ARFIP1 | SNV | Missense_Mutation | novel | c.1024N>A | p.Ala342Thr | p.A342T | P53367 | protein_coding | tolerated(0.1) | probably_damaging(0.96) | TCGA-AZ-4315-01 | Colorectum | colon adenocarcinoma | Male | <65 | I/II | Unknown | Unknown | SD |
| ARFIP1 | SNV | Missense_Mutation | novel | c.572N>G | p.His191Arg | p.H191R | P53367 | protein_coding | deleterious(0.03) | benign(0.084) | TCGA-CA-6717-01 | Colorectum | colon adenocarcinoma | Male | <65 | I/II | Chemotherapy | oxaliplatin | CR |
| ARFIP1 | SNV | Missense_Mutation | c.302G>A | p.Gly101Asp | p.G101D | P53367 | protein_coding | tolerated(0.45) | benign(0) | TCGA-CA-6718-01 | Colorectum | colon adenocarcinoma | Male | <65 | I/II | Unknown | Unknown | PD | |
| ARFIP1 | SNV | Missense_Mutation | c.452N>T | p.Ser151Leu | p.S151L | P53367 | protein_coding | deleterious(0) | possibly_damaging(0.899) | TCGA-D5-6532-01 | Colorectum | colon adenocarcinoma | Male | <65 | I/II | Unknown | Unknown | SD |
| Page: 1 2 3 4 |
Top |
Related drugs of malignant transformation related genes |
| Identification of chemicals and drugs interact with genes involved in malignant transfromation |
| (DGIdb 4.0) |
| Entrez ID | Symbol | Category | Interaction Types | Drug Claim Name | Drug Name | PMIDs |
| Page: 1 |

Copyright 2023-Present -The University of Texas Health Science Center at Houston |