
|
|||||
|
 | |
| |
| |
| |
| |
| |
|
Gene: APPL1 |
Gene summary for APPL1 |
| Gene information | Species | Human | Gene symbol | APPL1 | Gene ID | 26060 |
| Gene name | adaptor protein, phosphotyrosine interacting with PH domain and leucine zipper 1 | |
| Gene Alias | APPL | |
| Cytomap | 3p14.3 | |
| Gene Type | protein-coding | GO ID | GO:0000082 | UniProtAcc | Q9UKG1 |
Top |
Malignant transformation analysis |
| Identification of the aberrant gene expression in precancerous and cancerous lesions by comparing the gene expression of stem-like cells in diseased tissues with normal stem cells |
| Entrez ID | Symbol | Replicates | Species | Organ | Tissue | Adj P-value | Log2FC | Malignancy |
| 26060 | APPL1 | LZE4T | Human | Esophagus | ESCC | 7.05e-05 | 1.72e-01 | 0.0811 |
| 26060 | APPL1 | LZE7T | Human | Esophagus | ESCC | 3.36e-04 | 1.94e-01 | 0.0667 |
| 26060 | APPL1 | LZE8T | Human | Esophagus | ESCC | 2.05e-04 | 1.66e-02 | 0.067 |
| 26060 | APPL1 | LZE24T | Human | Esophagus | ESCC | 6.64e-12 | 3.17e-01 | 0.0596 |
| 26060 | APPL1 | LZE21T | Human | Esophagus | ESCC | 8.70e-06 | 2.14e-01 | 0.0655 |
| 26060 | APPL1 | P1T-E | Human | Esophagus | ESCC | 5.15e-06 | 3.53e-01 | 0.0875 |
| 26060 | APPL1 | P2T-E | Human | Esophagus | ESCC | 7.43e-70 | 1.11e+00 | 0.1177 |
| 26060 | APPL1 | P4T-E | Human | Esophagus | ESCC | 8.63e-37 | 8.64e-01 | 0.1323 |
| 26060 | APPL1 | P5T-E | Human | Esophagus | ESCC | 3.12e-15 | 2.97e-01 | 0.1327 |
| 26060 | APPL1 | P8T-E | Human | Esophagus | ESCC | 6.36e-29 | 5.52e-01 | 0.0889 |
| 26060 | APPL1 | P9T-E | Human | Esophagus | ESCC | 4.90e-19 | 4.34e-01 | 0.1131 |
| 26060 | APPL1 | P10T-E | Human | Esophagus | ESCC | 3.95e-45 | 8.52e-01 | 0.116 |
| 26060 | APPL1 | P11T-E | Human | Esophagus | ESCC | 8.29e-07 | 2.42e-01 | 0.1426 |
| 26060 | APPL1 | P12T-E | Human | Esophagus | ESCC | 4.80e-31 | 7.13e-01 | 0.1122 |
| 26060 | APPL1 | P15T-E | Human | Esophagus | ESCC | 3.85e-15 | 4.27e-01 | 0.1149 |
| 26060 | APPL1 | P16T-E | Human | Esophagus | ESCC | 1.65e-52 | 9.99e-01 | 0.1153 |
| 26060 | APPL1 | P17T-E | Human | Esophagus | ESCC | 6.61e-05 | 4.72e-01 | 0.1278 |
| 26060 | APPL1 | P19T-E | Human | Esophagus | ESCC | 4.32e-02 | 5.25e-01 | 0.1662 |
| 26060 | APPL1 | P20T-E | Human | Esophagus | ESCC | 7.44e-17 | 4.63e-01 | 0.1124 |
| 26060 | APPL1 | P21T-E | Human | Esophagus | ESCC | 5.65e-35 | 5.74e-01 | 0.1617 |
| Page: 1 2 3 4 5 6 |
| Tissue | Expression Dynamics | Abbreviation |
| Esophagus |  | ESCC: Esophageal squamous cell carcinoma |
| HGIN: High-grade intraepithelial neoplasias | ||
| LGIN: Low-grade intraepithelial neoplasias | ||
| Liver |  | HCC: Hepatocellular carcinoma |
| NAFLD: Non-alcoholic fatty liver disease | ||
| Oral Cavity | 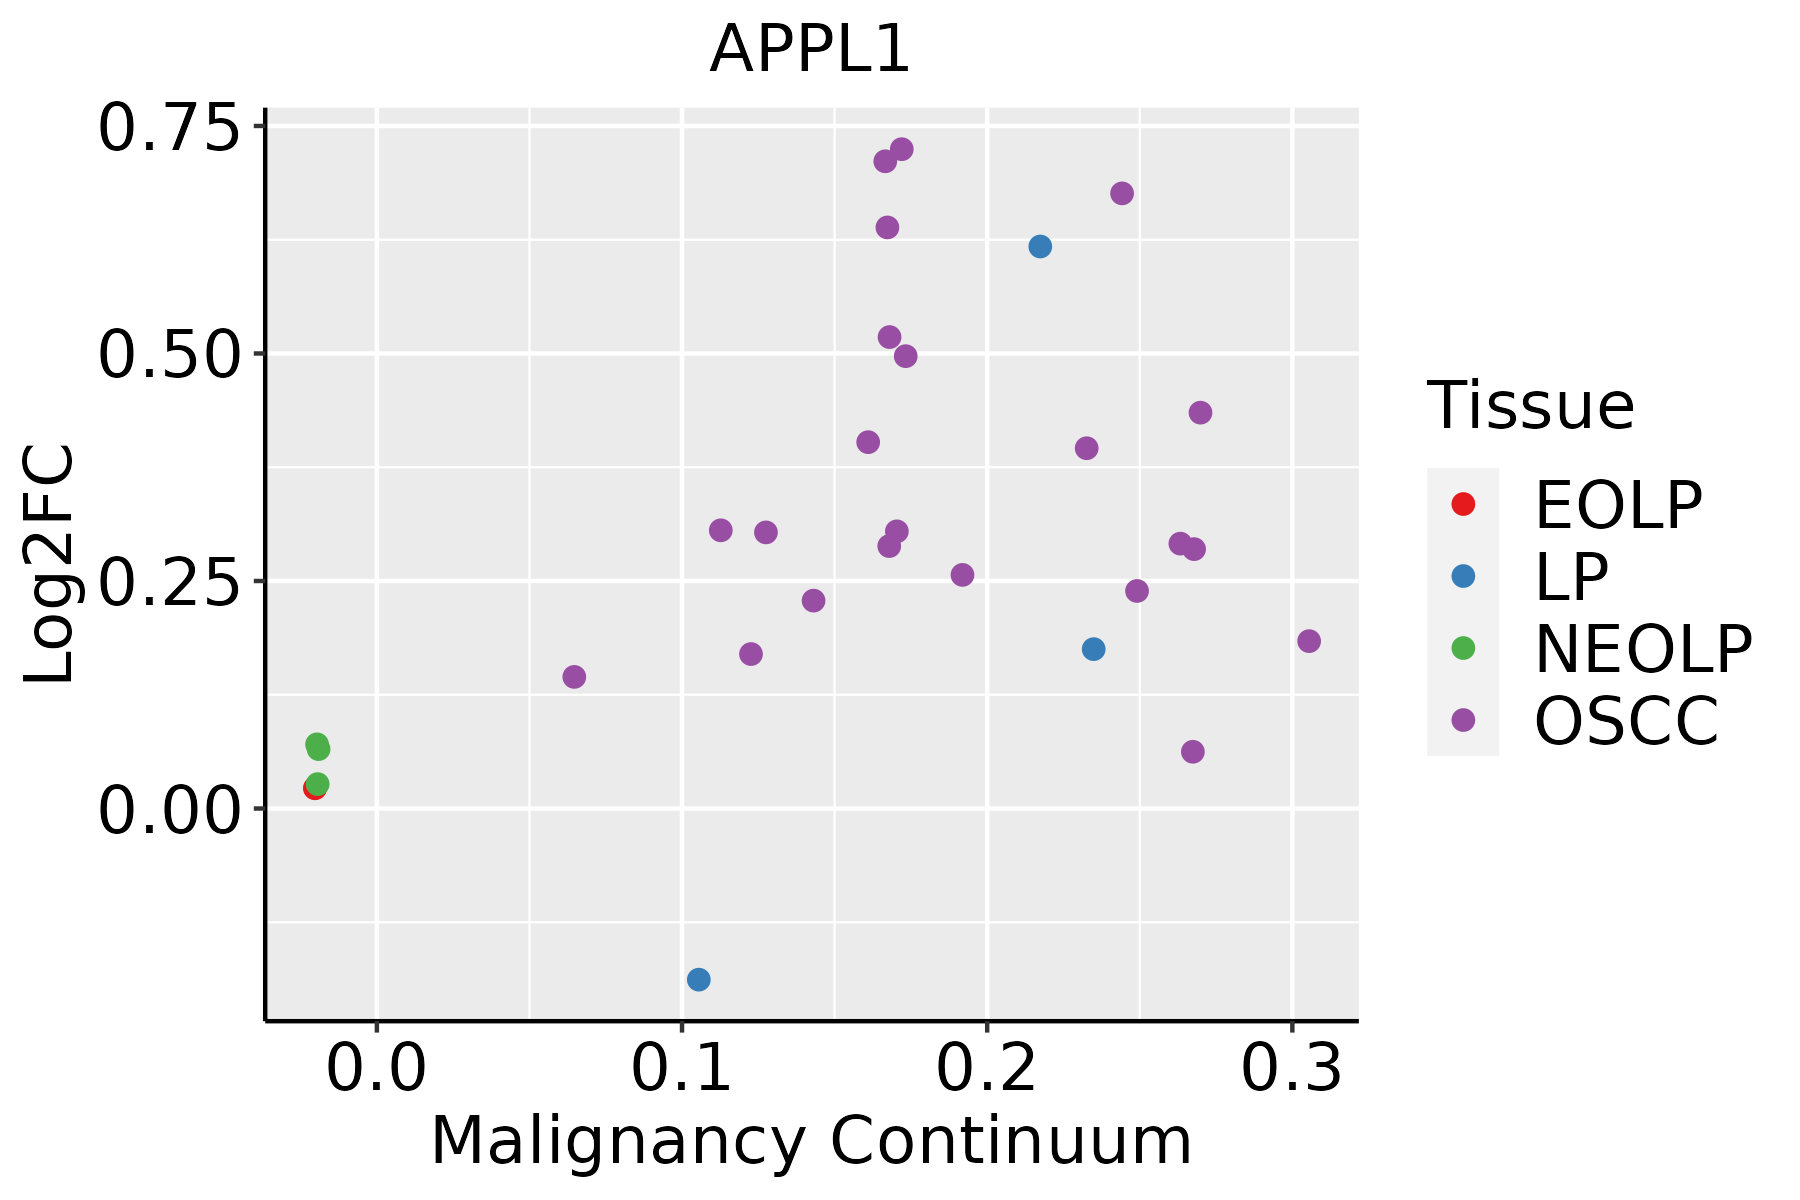 | EOLP: Erosive Oral lichen planus |
| LP: leukoplakia | ||
| NEOLP: Non-erosive oral lichen planus | ||
| OSCC: Oral squamous cell carcinoma | ||
| Prostate |  | BPH: Benign Prostatic Hyperplasia |
| Skin | 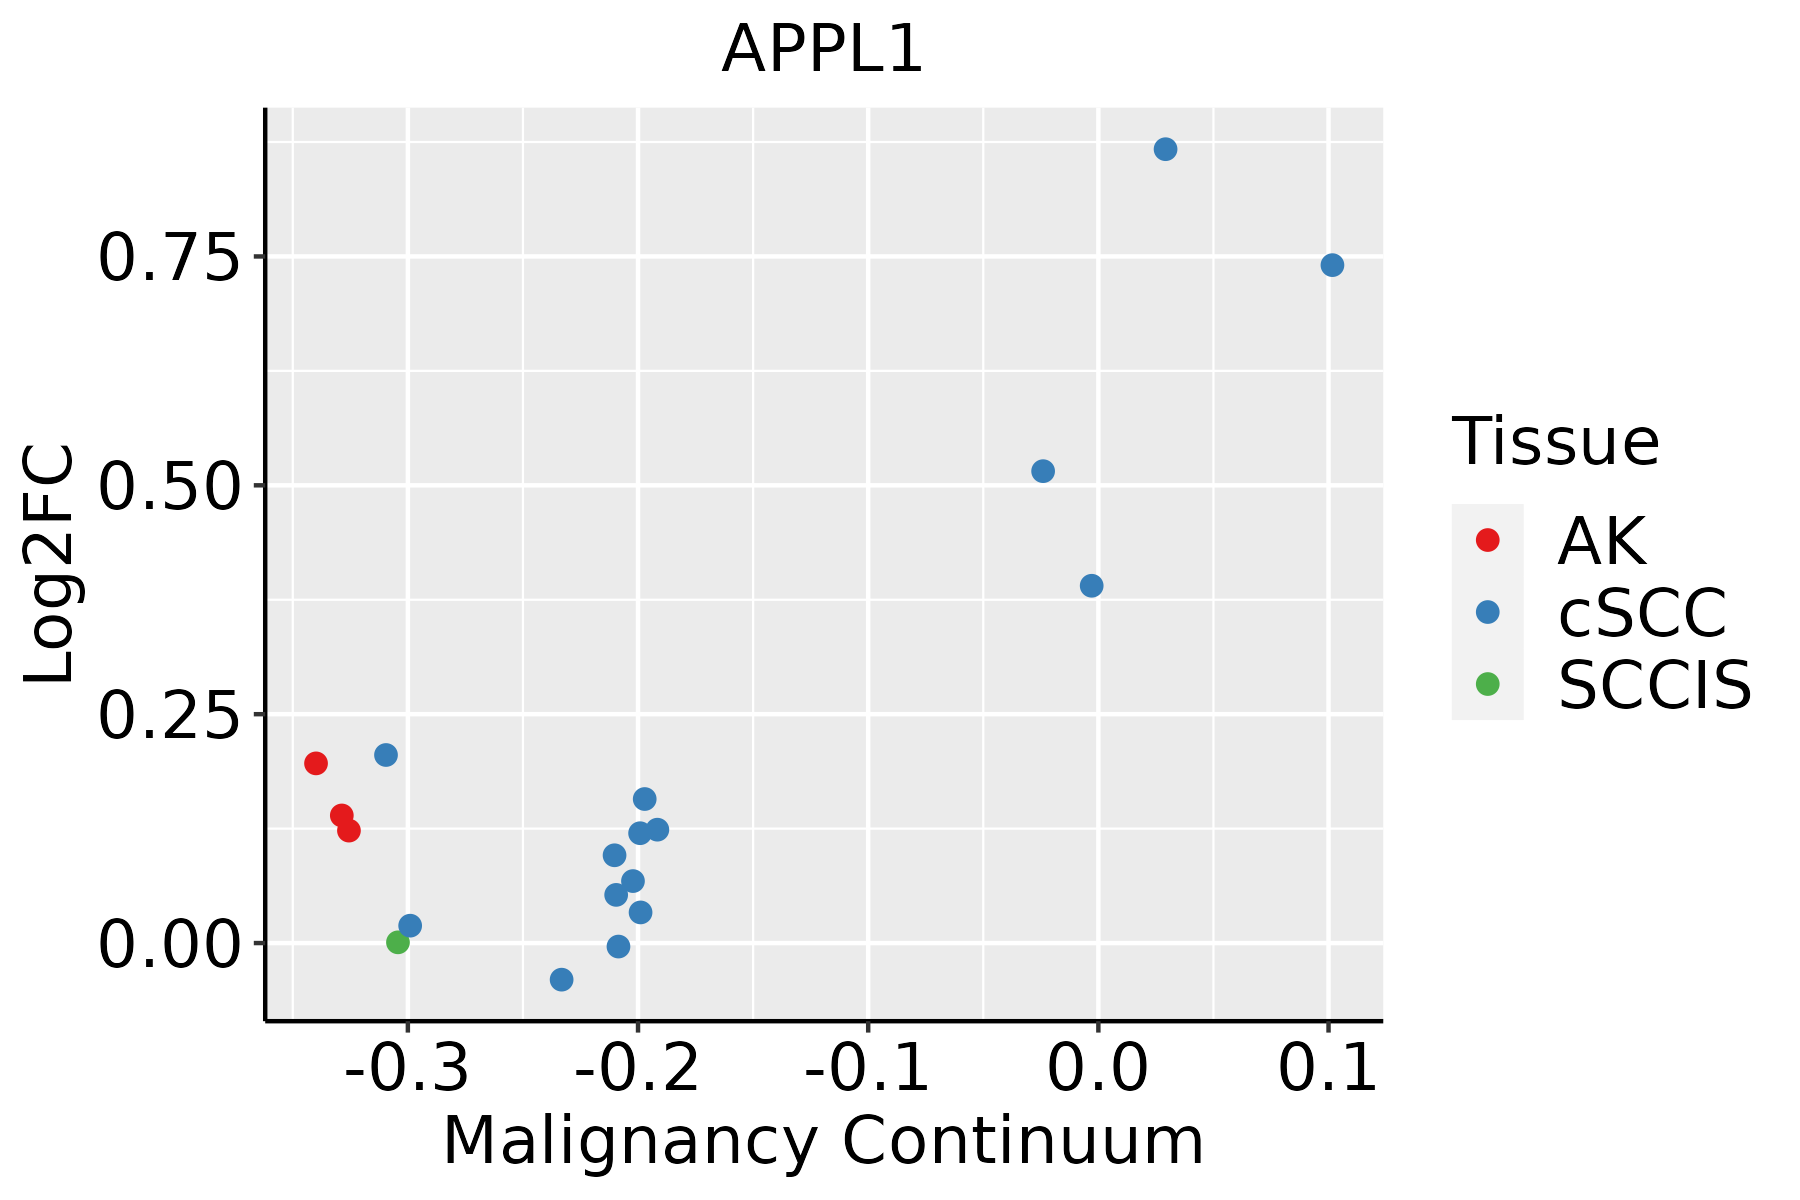 | AK: Actinic keratosis |
| cSCC: Cutaneous squamous cell carcinoma | ||
| SCCIS:squamous cell carcinoma in situ | ||
| Thyroid | 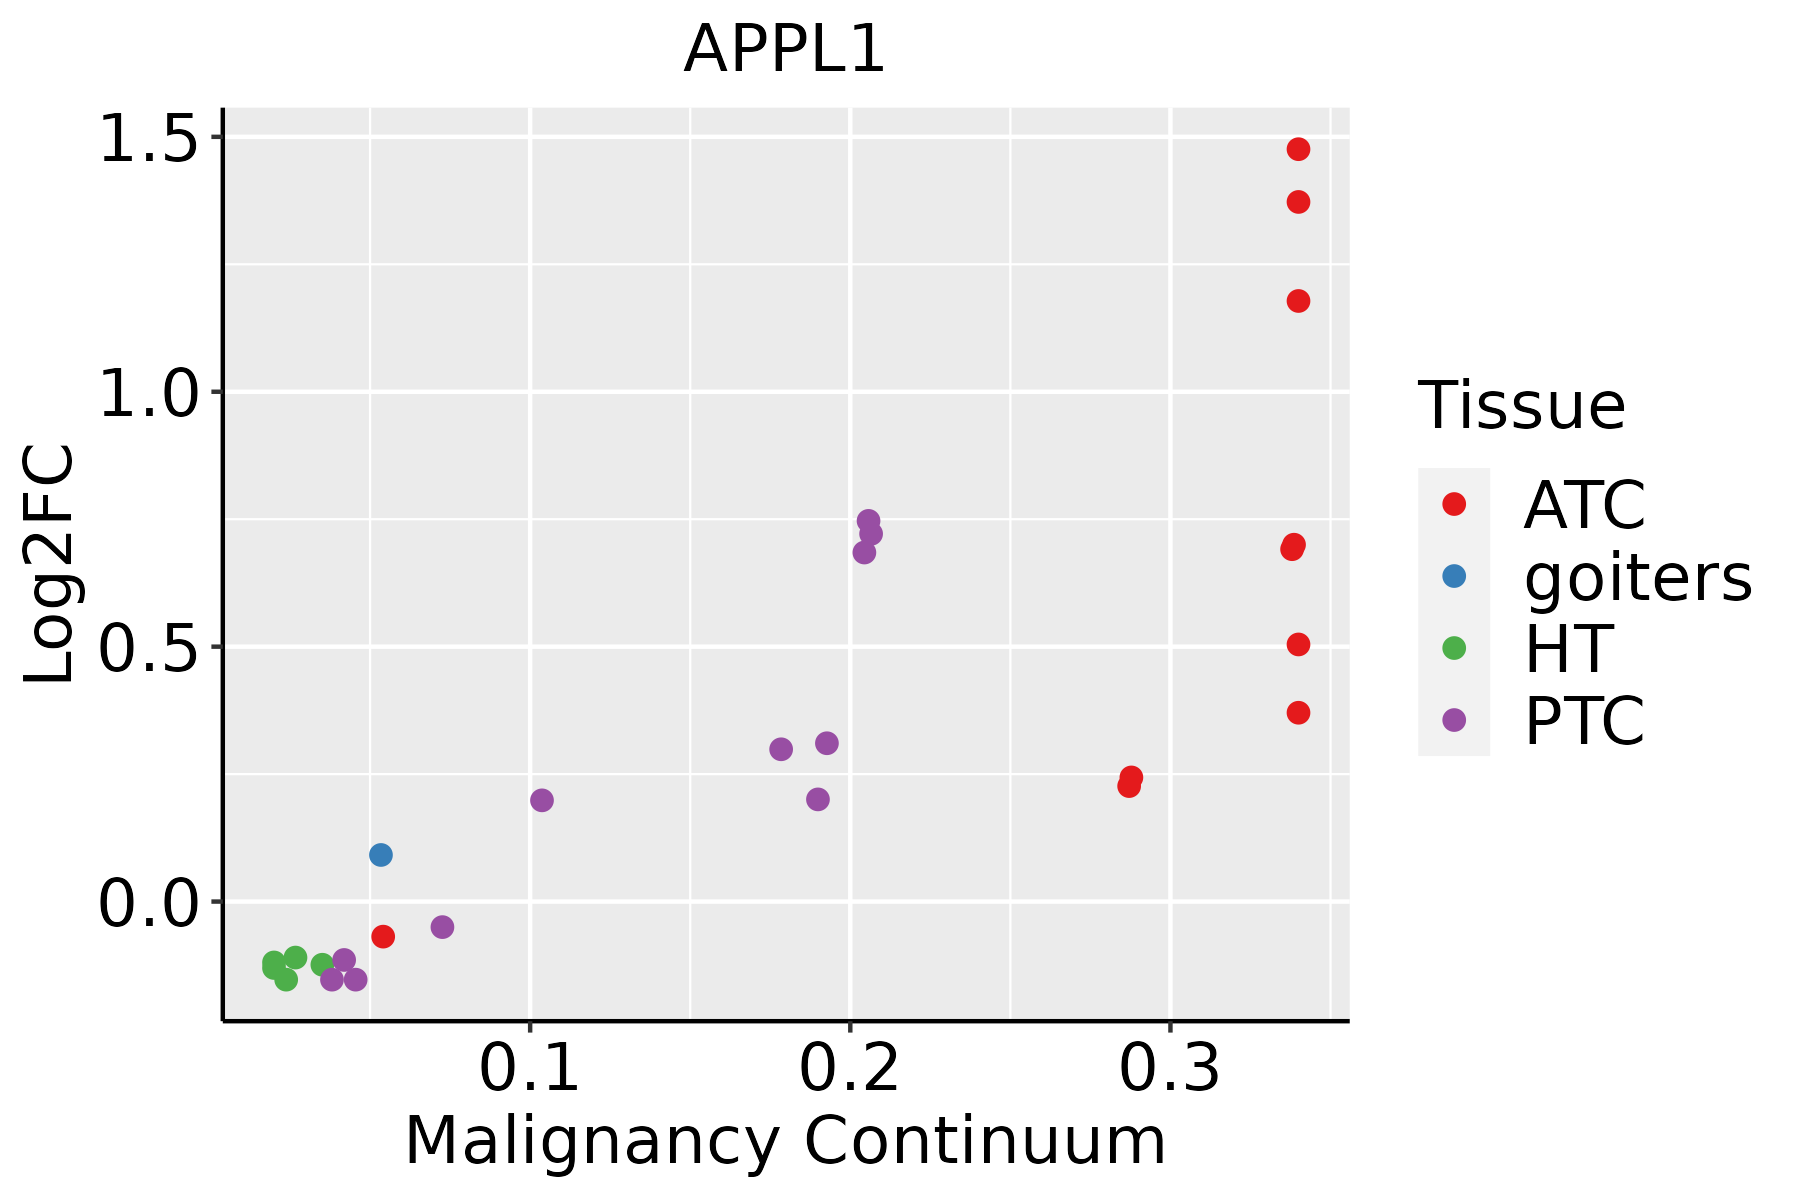 | ATC: Anaplastic thyroid cancer |
| HT: Hashimoto's thyroiditis | ||
| PTC: Papillary thyroid cancer |
| ∗log2FC in expression of this searched gene in stem-like cells from each diseased tissue sample relative to stem-like cells in normal samples in each tissue plotted against the malignancy continuum. Samples are colored based on if they are from different disease stage. |
Top |
Malignant transformation related pathway analysis |
| Find out the enriched GO biological processes and KEGG pathways involved in transition from healthy to precancer to cancer |
| Tissue | Disease Stage | Enriched GO biological Processes |
| Colorectum | AD |  |
| Colorectum | SER |  |
| Colorectum | MSS |  |
| Colorectum | MSI-H |  |
| Colorectum | FAP |  |
| ∗Top 15 enriched GO BP terms are showed in the bar plot of each disease state in each tissue. Each row represents a significant GO biological process which is colored according to the -log10(p.adjust). |
| Page: 1 2 3 4 5 6 7 8 9 |
| GO ID | Tissue | Disease Stage | Description | Gene Ratio | Bg Ratio | pvalue | p.adjust | Count |
| GO:19016174 | Esophagus | ESCC | organic hydroxy compound biosynthetic process | 128/8552 | 237/18723 | 5.86e-03 | 2.16e-02 | 128 |
| GO:00424401 | Esophagus | ESCC | pigment metabolic process | 50/8552 | 84/18723 | 7.34e-03 | 2.64e-02 | 50 |
| GO:00069073 | Esophagus | ESCC | pinocytosis | 16/8552 | 22/18723 | 9.46e-03 | 3.28e-02 | 16 |
| GO:00082869 | Esophagus | ESCC | insulin receptor signaling pathway | 66/8552 | 116/18723 | 9.76e-03 | 3.37e-02 | 66 |
| GO:007259412 | Liver | Cirrhotic | establishment of protein localization to organelle | 189/4634 | 422/18723 | 1.01e-19 | 2.45e-17 | 189 |
| GO:199077811 | Liver | Cirrhotic | protein localization to cell periphery | 135/4634 | 333/18723 | 1.18e-10 | 6.21e-09 | 135 |
| GO:007265911 | Liver | Cirrhotic | protein localization to plasma membrane | 119/4634 | 284/18723 | 1.30e-10 | 6.80e-09 | 119 |
| GO:000691312 | Liver | Cirrhotic | nucleocytoplasmic transport | 118/4634 | 301/18723 | 1.71e-08 | 6.27e-07 | 118 |
| GO:005116912 | Liver | Cirrhotic | nuclear transport | 118/4634 | 301/18723 | 1.71e-08 | 6.27e-07 | 118 |
| GO:19054755 | Liver | Cirrhotic | regulation of protein localization to membrane | 76/4634 | 175/18723 | 4.55e-08 | 1.45e-06 | 76 |
| GO:003450411 | Liver | Cirrhotic | protein localization to nucleus | 113/4634 | 290/18723 | 5.00e-08 | 1.58e-06 | 113 |
| GO:004343412 | Liver | Cirrhotic | response to peptide hormone | 149/4634 | 414/18723 | 1.70e-07 | 4.49e-06 | 149 |
| GO:190437511 | Liver | Cirrhotic | regulation of protein localization to cell periphery | 57/4634 | 125/18723 | 2.97e-07 | 7.18e-06 | 57 |
| GO:007137511 | Liver | Cirrhotic | cellular response to peptide hormone stimulus | 110/4634 | 290/18723 | 3.73e-07 | 8.82e-06 | 110 |
| GO:190165311 | Liver | Cirrhotic | cellular response to peptide | 129/4634 | 359/18723 | 1.23e-06 | 2.49e-05 | 129 |
| GO:003286911 | Liver | Cirrhotic | cellular response to insulin stimulus | 80/4634 | 203/18723 | 2.55e-06 | 4.63e-05 | 80 |
| GO:007155911 | Liver | Cirrhotic | response to transforming growth factor beta | 96/4634 | 256/18723 | 3.55e-06 | 6.09e-05 | 96 |
| GO:190307611 | Liver | Cirrhotic | regulation of protein localization to plasma membrane | 47/4634 | 104/18723 | 4.29e-06 | 7.15e-05 | 47 |
| GO:007156011 | Liver | Cirrhotic | cellular response to transforming growth factor beta stimulus | 93/4634 | 250/18723 | 7.34e-06 | 1.13e-04 | 93 |
| GO:00073463 | Liver | Cirrhotic | regulation of mitotic cell cycle | 154/4634 | 457/18723 | 8.73e-06 | 1.29e-04 | 154 |
| Page: 1 2 3 4 5 6 7 8 9 10 11 12 13 14 15 16 17 18 19 20 21 22 |
| Pathway ID | Tissue | Disease Stage | Description | Gene Ratio | Bg Ratio | pvalue | p.adjust | qvalue | Count |
| hsa0521020 | Esophagus | ESCC | Colorectal cancer | 69/4205 | 86/8465 | 4.06e-09 | 4.13e-08 | 2.11e-08 | 69 |
| hsa0421114 | Esophagus | ESCC | Longevity regulating pathway | 58/4205 | 89/8465 | 2.19e-03 | 6.16e-03 | 3.16e-03 | 58 |
| hsa05210110 | Esophagus | ESCC | Colorectal cancer | 69/4205 | 86/8465 | 4.06e-09 | 4.13e-08 | 2.11e-08 | 69 |
| hsa0421115 | Esophagus | ESCC | Longevity regulating pathway | 58/4205 | 89/8465 | 2.19e-03 | 6.16e-03 | 3.16e-03 | 58 |
| hsa052107 | Liver | Cirrhotic | Colorectal cancer | 39/2530 | 86/8465 | 1.67e-03 | 8.01e-03 | 4.94e-03 | 39 |
| hsa042118 | Liver | Cirrhotic | Longevity regulating pathway | 37/2530 | 89/8465 | 1.22e-02 | 3.89e-02 | 2.40e-02 | 37 |
| hsa0521012 | Liver | Cirrhotic | Colorectal cancer | 39/2530 | 86/8465 | 1.67e-03 | 8.01e-03 | 4.94e-03 | 39 |
| hsa0421111 | Liver | Cirrhotic | Longevity regulating pathway | 37/2530 | 89/8465 | 1.22e-02 | 3.89e-02 | 2.40e-02 | 37 |
| hsa0521022 | Liver | HCC | Colorectal cancer | 65/4020 | 86/8465 | 8.85e-08 | 1.23e-06 | 6.87e-07 | 65 |
| hsa0421121 | Liver | HCC | Longevity regulating pathway | 61/4020 | 89/8465 | 4.46e-05 | 2.37e-04 | 1.32e-04 | 61 |
| hsa0521032 | Liver | HCC | Colorectal cancer | 65/4020 | 86/8465 | 8.85e-08 | 1.23e-06 | 6.87e-07 | 65 |
| hsa0421131 | Liver | HCC | Longevity regulating pathway | 61/4020 | 89/8465 | 4.46e-05 | 2.37e-04 | 1.32e-04 | 61 |
| hsa0521018 | Oral cavity | OSCC | Colorectal cancer | 66/3704 | 86/8465 | 3.99e-10 | 4.95e-09 | 2.52e-09 | 66 |
| hsa0421110 | Oral cavity | OSCC | Longevity regulating pathway | 54/3704 | 89/8465 | 9.24e-04 | 2.65e-03 | 1.35e-03 | 54 |
| hsa0521019 | Oral cavity | OSCC | Colorectal cancer | 66/3704 | 86/8465 | 3.99e-10 | 4.95e-09 | 2.52e-09 | 66 |
| hsa0421113 | Oral cavity | OSCC | Longevity regulating pathway | 54/3704 | 89/8465 | 9.24e-04 | 2.65e-03 | 1.35e-03 | 54 |
| hsa0521016 | Prostate | BPH | Colorectal cancer | 36/1718 | 86/8465 | 3.94e-06 | 3.25e-05 | 2.01e-05 | 36 |
| hsa042119 | Prostate | BPH | Longevity regulating pathway | 27/1718 | 89/8465 | 1.57e-02 | 4.42e-02 | 2.73e-02 | 27 |
| hsa0521017 | Prostate | BPH | Colorectal cancer | 36/1718 | 86/8465 | 3.94e-06 | 3.25e-05 | 2.01e-05 | 36 |
| hsa0421112 | Prostate | BPH | Longevity regulating pathway | 27/1718 | 89/8465 | 1.57e-02 | 4.42e-02 | 2.73e-02 | 27 |
| Page: 1 |
Top |
Cell-cell communication analysis |
| Identification of potential cell-cell interactions between two cell types and their ligand-receptor pairs for different disease states |
| Ligand | Receptor | LRpair | Pathway | Tissue | Disease Stage |
| Page: 1 |
Top |
Single-cell gene regulatory network inference analysis |
| Find out the significant the regulons (TFs) and the target genes of each regulon across cell types for different disease states |
| TF | Cell Type | Tissue | Disease Stage | Target Gene | RSS | Regulon Activity |
| ∗The dot plots of a searched regulon are shown for all cell subpopulations in each disease state of each tissue based on the regulon specific score inferred using pySCENIC and by calculating the average expression. |
| Page: 1 |
Top |
Somatic mutation of malignant transformation related genes |
| Annotation of somatic variants for genes involved in malignant transformation |
| Hugo Symbol | Variant Class | Variant Classification | dbSNP RS | HGVSc | HGVSp | HGVSp Short | SWISSPROT | BIOTYPE | SIFT | PolyPhen | Tumor Sample Barcode | Tissue | Histology | Sex | Age | Stage | Therapy Types | Drugs | Outcome |
| APPL1 | SNV | Missense_Mutation | rs753618573 | c.1166N>A | p.Arg389Gln | p.R389Q | Q9UKG1 | protein_coding | deleterious(0.03) | possibly_damaging(0.709) | TCGA-A2-A0CS-01 | Breast | breast invasive carcinoma | Female | >=65 | III/IV | Hormone Therapy | anastrozole | SD |
| APPL1 | SNV | Missense_Mutation | c.226N>A | p.Gly76Arg | p.G76R | Q9UKG1 | protein_coding | deleterious(0) | possibly_damaging(0.797) | TCGA-A2-A0CX-01 | Breast | breast invasive carcinoma | Female | <65 | I/II | Chemotherapy | adriamycin | SD | |
| APPL1 | SNV | Missense_Mutation | novel | c.2025A>T | p.Arg675Ser | p.R675S | Q9UKG1 | protein_coding | tolerated(0.41) | probably_damaging(0.966) | TCGA-A7-A426-01 | Breast | breast invasive carcinoma | Female | <65 | III/IV | Chemotherapy | adriamycin | SD |
| APPL1 | SNV | Missense_Mutation | novel | c.621N>C | p.Gln207His | p.Q207H | Q9UKG1 | protein_coding | tolerated(0.06) | benign(0.193) | TCGA-AC-A6IW-01 | Breast | breast invasive carcinoma | Female | >=65 | I/II | Unknown | Unknown | SD |
| APPL1 | SNV | Missense_Mutation | novel | c.1072N>C | p.Glu358Gln | p.E358Q | Q9UKG1 | protein_coding | deleterious(0.02) | benign(0.325) | TCGA-AR-A1AS-01 | Breast | breast invasive carcinoma | Female | <65 | I/II | Chemotherapy | doxorubicin | SD |
| APPL1 | SNV | Missense_Mutation | c.1979A>C | p.Glu660Ala | p.E660A | Q9UKG1 | protein_coding | tolerated(0.13) | benign(0.015) | TCGA-GM-A2D9-01 | Breast | breast invasive carcinoma | Female | >=65 | I/II | Hormone Therapy | arimidex | SD | |
| APPL1 | SNV | Missense_Mutation | novel | c.1048N>G | p.Lys350Glu | p.K350E | Q9UKG1 | protein_coding | deleterious(0) | benign(0.027) | TCGA-ZJ-AAXJ-01 | Cervix | cervical & endocervical cancer | Female | <65 | I/II | Unknown | Unknown | SD |
| APPL1 | SNV | Missense_Mutation | rs748607720 | c.824N>A | p.Arg275Gln | p.R275Q | Q9UKG1 | protein_coding | deleterious(0.02) | probably_damaging(0.917) | TCGA-AA-3510-01 | Colorectum | colon adenocarcinoma | Male | >=65 | I/II | Unknown | Unknown | SD |
| APPL1 | SNV | Missense_Mutation | rs745495066 | c.709N>T | p.Arg237Cys | p.R237C | Q9UKG1 | protein_coding | deleterious(0) | possibly_damaging(0.653) | TCGA-AA-3715-01 | Colorectum | colon adenocarcinoma | Male | >=65 | I/II | Unknown | Unknown | PD |
| APPL1 | SNV | Missense_Mutation | rs529656946 | c.134N>G | p.His45Arg | p.H45R | Q9UKG1 | protein_coding | deleterious(0.04) | benign(0) | TCGA-AA-3811-01 | Colorectum | colon adenocarcinoma | Female | >=65 | III/IV | Unknown | Unknown | PD |
| Page: 1 2 3 4 5 6 7 8 |
Top |
Related drugs of malignant transformation related genes |
| Identification of chemicals and drugs interact with genes involved in malignant transfromation |
| (DGIdb 4.0) |
| Entrez ID | Symbol | Category | Interaction Types | Drug Claim Name | Drug Name | PMIDs |
| Page: 1 |

Copyright 2023-Present -The University of Texas Health Science Center at Houston |