
|
|||||
|
 | |
| |
| |
| |
| |
| |
|
Gene: ANTXR1 |
Gene summary for ANTXR1 |
| Gene information | Species | Human | Gene symbol | ANTXR1 | Gene ID | 84168 |
| Gene name | ANTXR cell adhesion molecule 1 | |
| Gene Alias | ATR | |
| Cytomap | 2p13.3 | |
| Gene Type | protein-coding | GO ID | GO:0000003 | UniProtAcc | Q96EC6 |
Top |
Malignant transformation analysis |
| Identification of the aberrant gene expression in precancerous and cancerous lesions by comparing the gene expression of stem-like cells in diseased tissues with normal stem cells |
| Entrez ID | Symbol | Replicates | Species | Organ | Tissue | Adj P-value | Log2FC | Malignancy |
| 84168 | ANTXR1 | HTA11_3410_2000001011 | Human | Colorectum | AD | 3.25e-02 | 1.40e-01 | 0.0155 |
| 84168 | ANTXR1 | HTA11_2487_2000001011 | Human | Colorectum | SER | 7.57e-05 | 2.18e-01 | -0.1808 |
| 84168 | ANTXR1 | HTA11_1938_2000001011 | Human | Colorectum | AD | 8.43e-12 | 6.44e-01 | -0.0811 |
| 84168 | ANTXR1 | HTA11_78_2000001011 | Human | Colorectum | AD | 4.00e-03 | 2.56e-01 | -0.1088 |
| 84168 | ANTXR1 | HTA11_347_2000001011 | Human | Colorectum | AD | 7.61e-07 | 2.04e-01 | -0.1954 |
| 84168 | ANTXR1 | HTA11_696_2000001011 | Human | Colorectum | AD | 4.08e-11 | 2.77e-01 | -0.1464 |
| 84168 | ANTXR1 | HTA11_866_2000001011 | Human | Colorectum | AD | 1.36e-04 | 7.04e-02 | -0.1001 |
| 84168 | ANTXR1 | HTA11_1391_2000001011 | Human | Colorectum | AD | 4.12e-07 | 2.36e-01 | -0.059 |
| 84168 | ANTXR1 | HTA11_9408_2000001011 | Human | Colorectum | AD | 2.25e-05 | 5.13e-01 | 0.0451 |
| 84168 | ANTXR1 | HTA11_7696_3000711011 | Human | Colorectum | AD | 3.06e-06 | 1.63e-01 | 0.0674 |
| 84168 | ANTXR1 | HTA11_99999970781_79442 | Human | Colorectum | MSS | 8.87e-46 | 7.80e-01 | 0.294 |
| 84168 | ANTXR1 | HTA11_99999965104_69814 | Human | Colorectum | MSS | 2.73e-03 | 1.88e-01 | 0.281 |
| 84168 | ANTXR1 | LZE8T | Human | Esophagus | ESCC | 1.05e-03 | -3.58e-02 | 0.067 |
| 84168 | ANTXR1 | LZE24T | Human | Esophagus | ESCC | 4.33e-07 | 1.22e-01 | 0.0596 |
| 84168 | ANTXR1 | LZE21T | Human | Esophagus | ESCC | 1.15e-02 | 2.51e-02 | 0.0655 |
| 84168 | ANTXR1 | P1T-E | Human | Esophagus | ESCC | 8.34e-03 | 4.64e-02 | 0.0875 |
| 84168 | ANTXR1 | P2T-E | Human | Esophagus | ESCC | 2.73e-19 | 4.04e-01 | 0.1177 |
| 84168 | ANTXR1 | P4T-E | Human | Esophagus | ESCC | 3.05e-15 | 7.13e-01 | 0.1323 |
| 84168 | ANTXR1 | P8T-E | Human | Esophagus | ESCC | 4.64e-10 | 3.32e-01 | 0.0889 |
| 84168 | ANTXR1 | P9T-E | Human | Esophagus | ESCC | 6.74e-06 | 5.31e-01 | 0.1131 |
| Page: 1 2 3 4 5 6 |
| Tissue | Expression Dynamics | Abbreviation |
| Colorectum (GSE201348) | 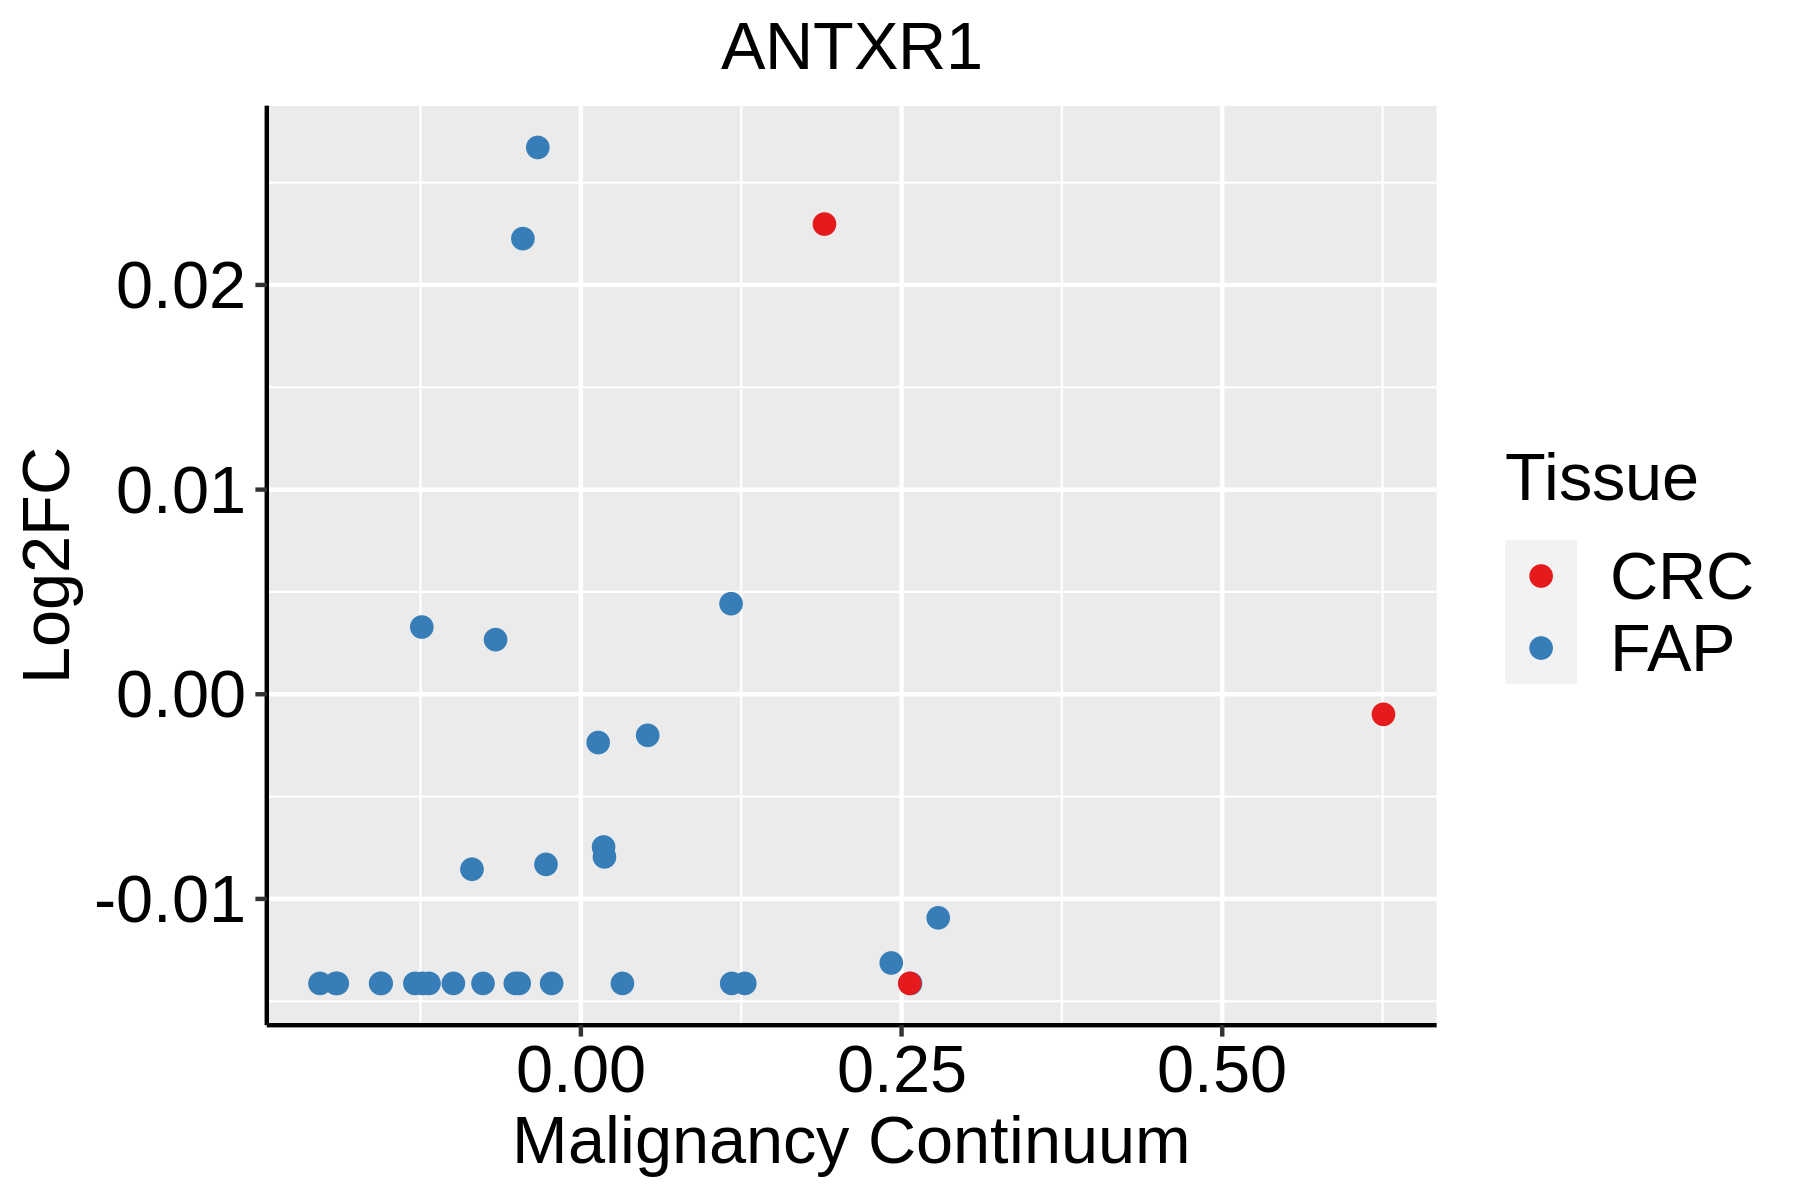 | FAP: Familial adenomatous polyposis |
| CRC: Colorectal cancer | ||
| Colorectum (HTA11) |  | AD: Adenomas |
| SER: Sessile serrated lesions | ||
| MSI-H: Microsatellite-high colorectal cancer | ||
| MSS: Microsatellite stable colorectal cancer | ||
| Esophagus |  | ESCC: Esophageal squamous cell carcinoma |
| HGIN: High-grade intraepithelial neoplasias | ||
| LGIN: Low-grade intraepithelial neoplasias | ||
| Oral Cavity | 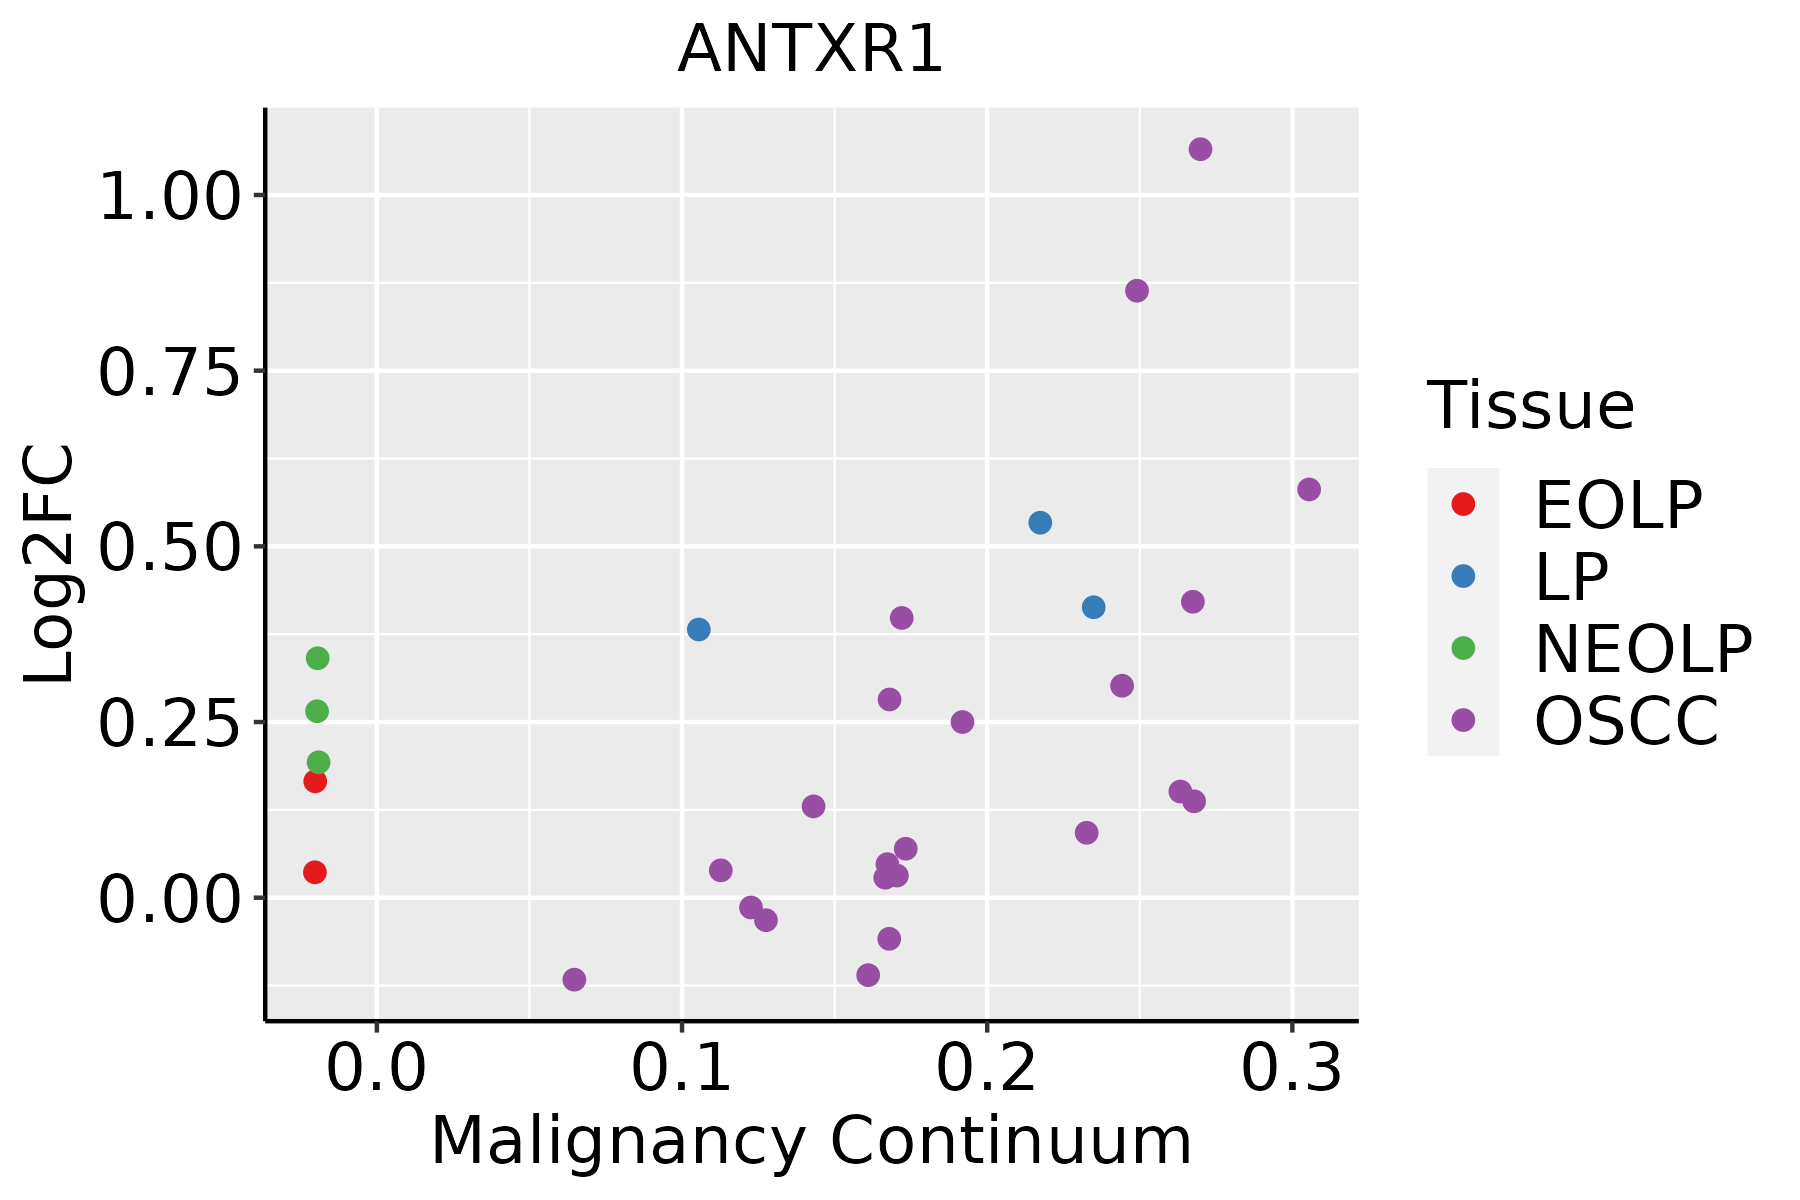 | EOLP: Erosive Oral lichen planus |
| LP: leukoplakia | ||
| NEOLP: Non-erosive oral lichen planus | ||
| OSCC: Oral squamous cell carcinoma | ||
| Prostate | 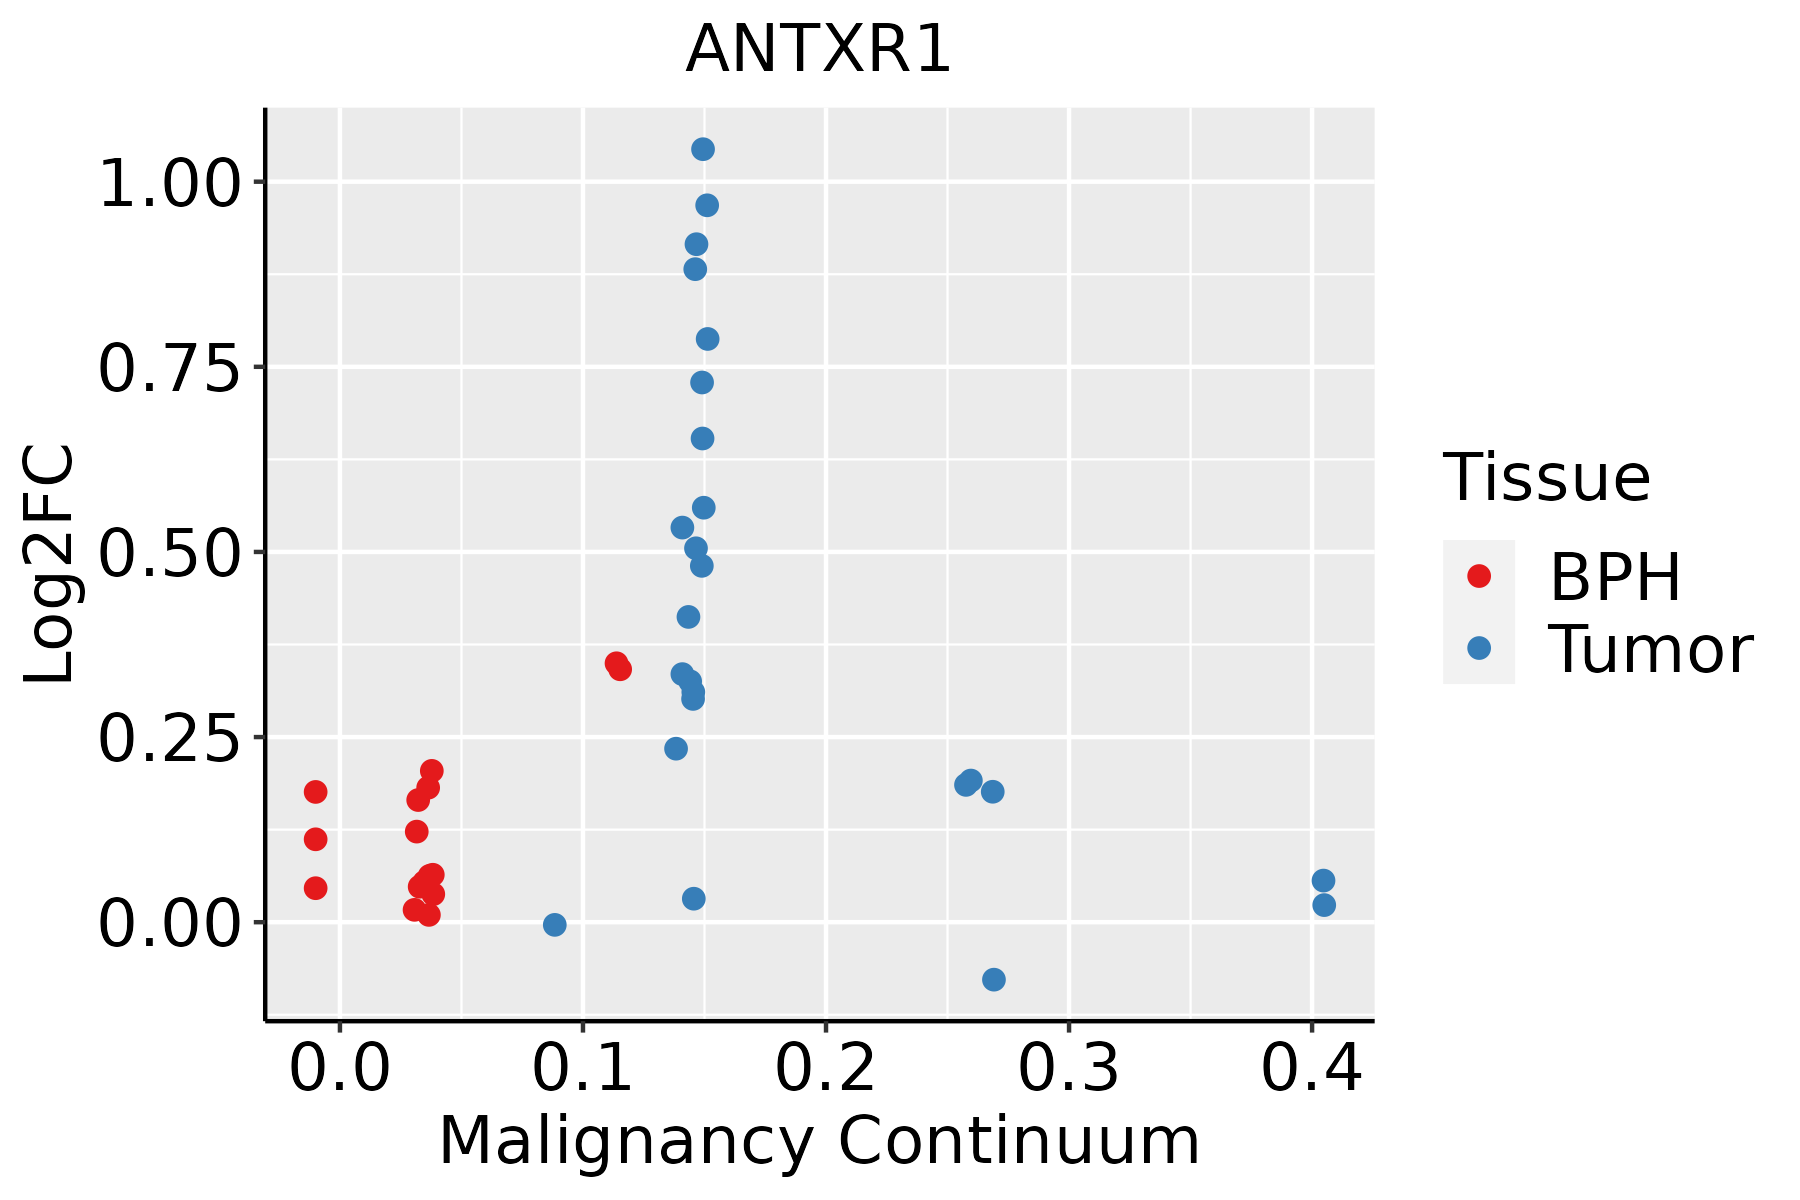 | BPH: Benign Prostatic Hyperplasia |
| Skin | 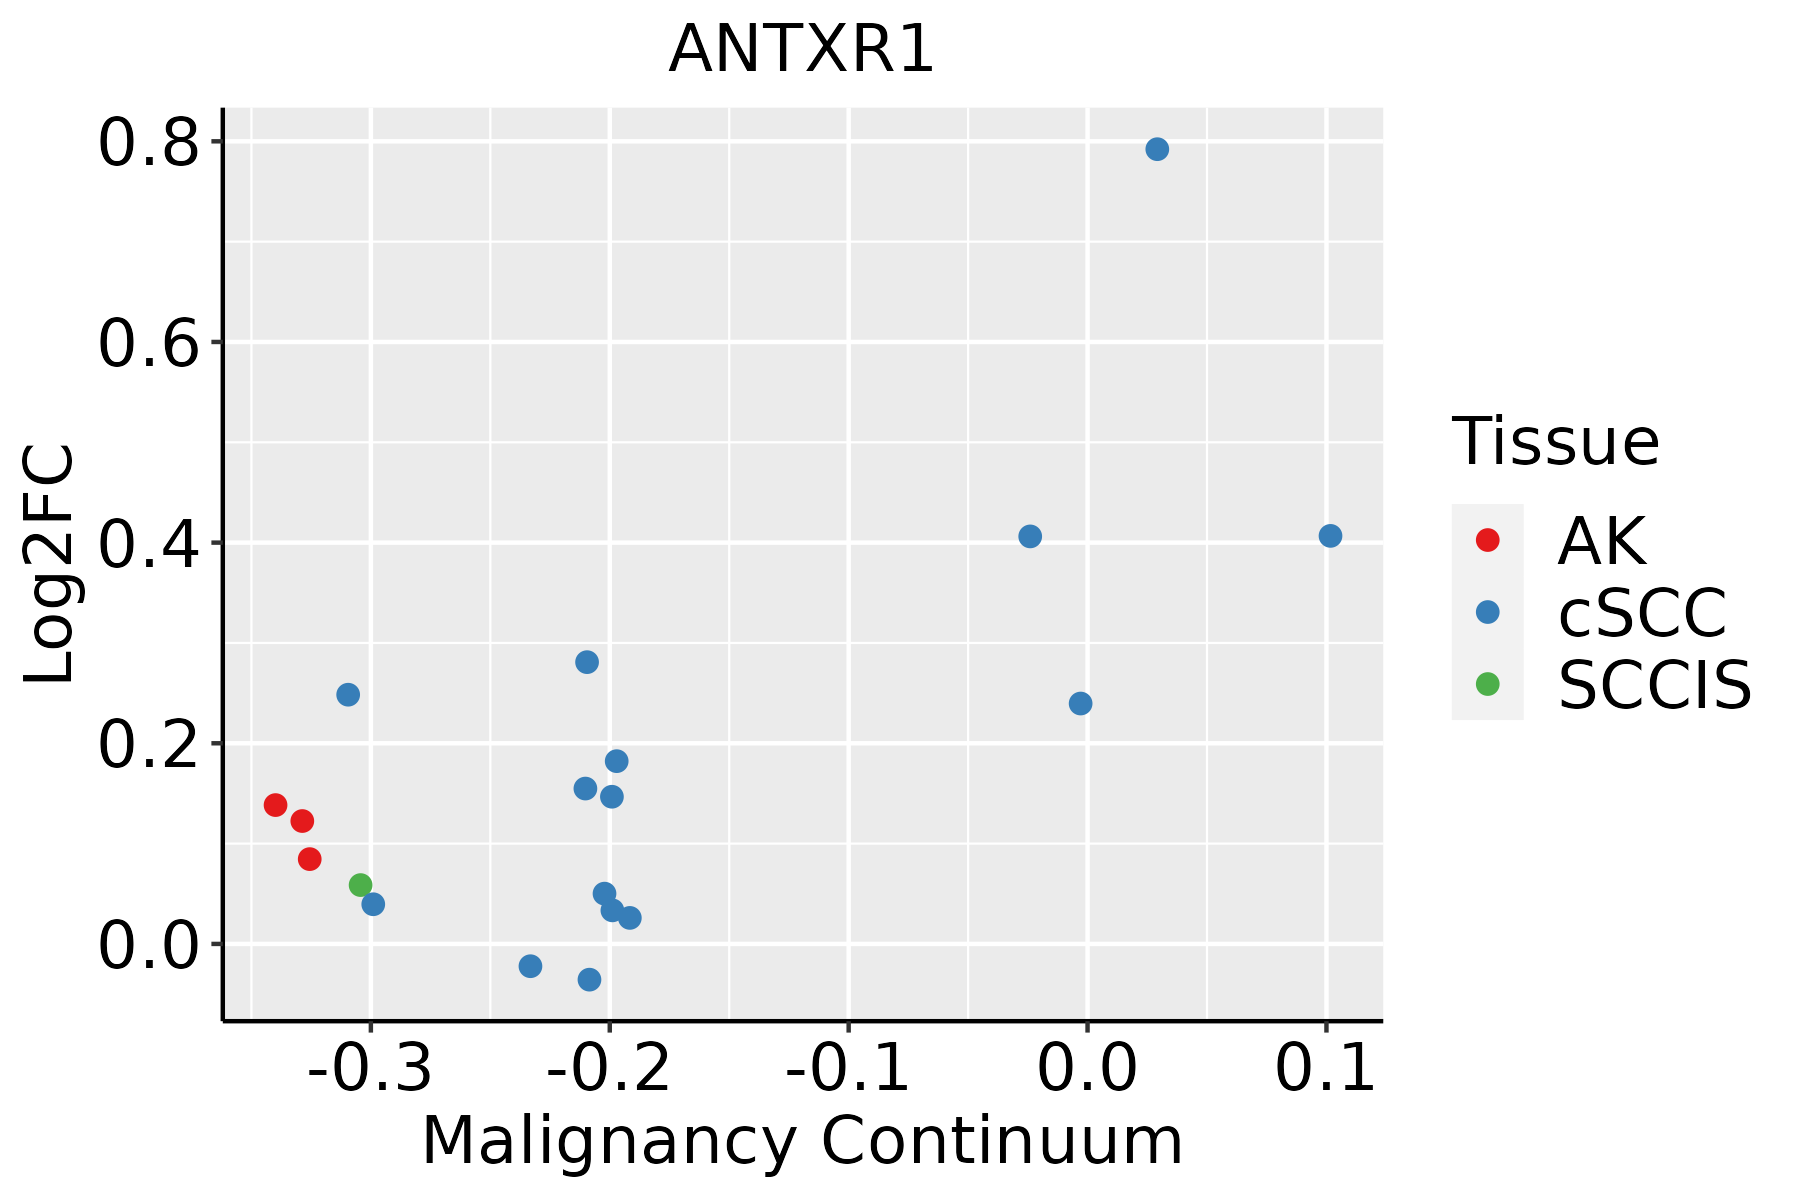 | AK: Actinic keratosis |
| cSCC: Cutaneous squamous cell carcinoma | ||
| SCCIS:squamous cell carcinoma in situ | ||
| Thyroid | 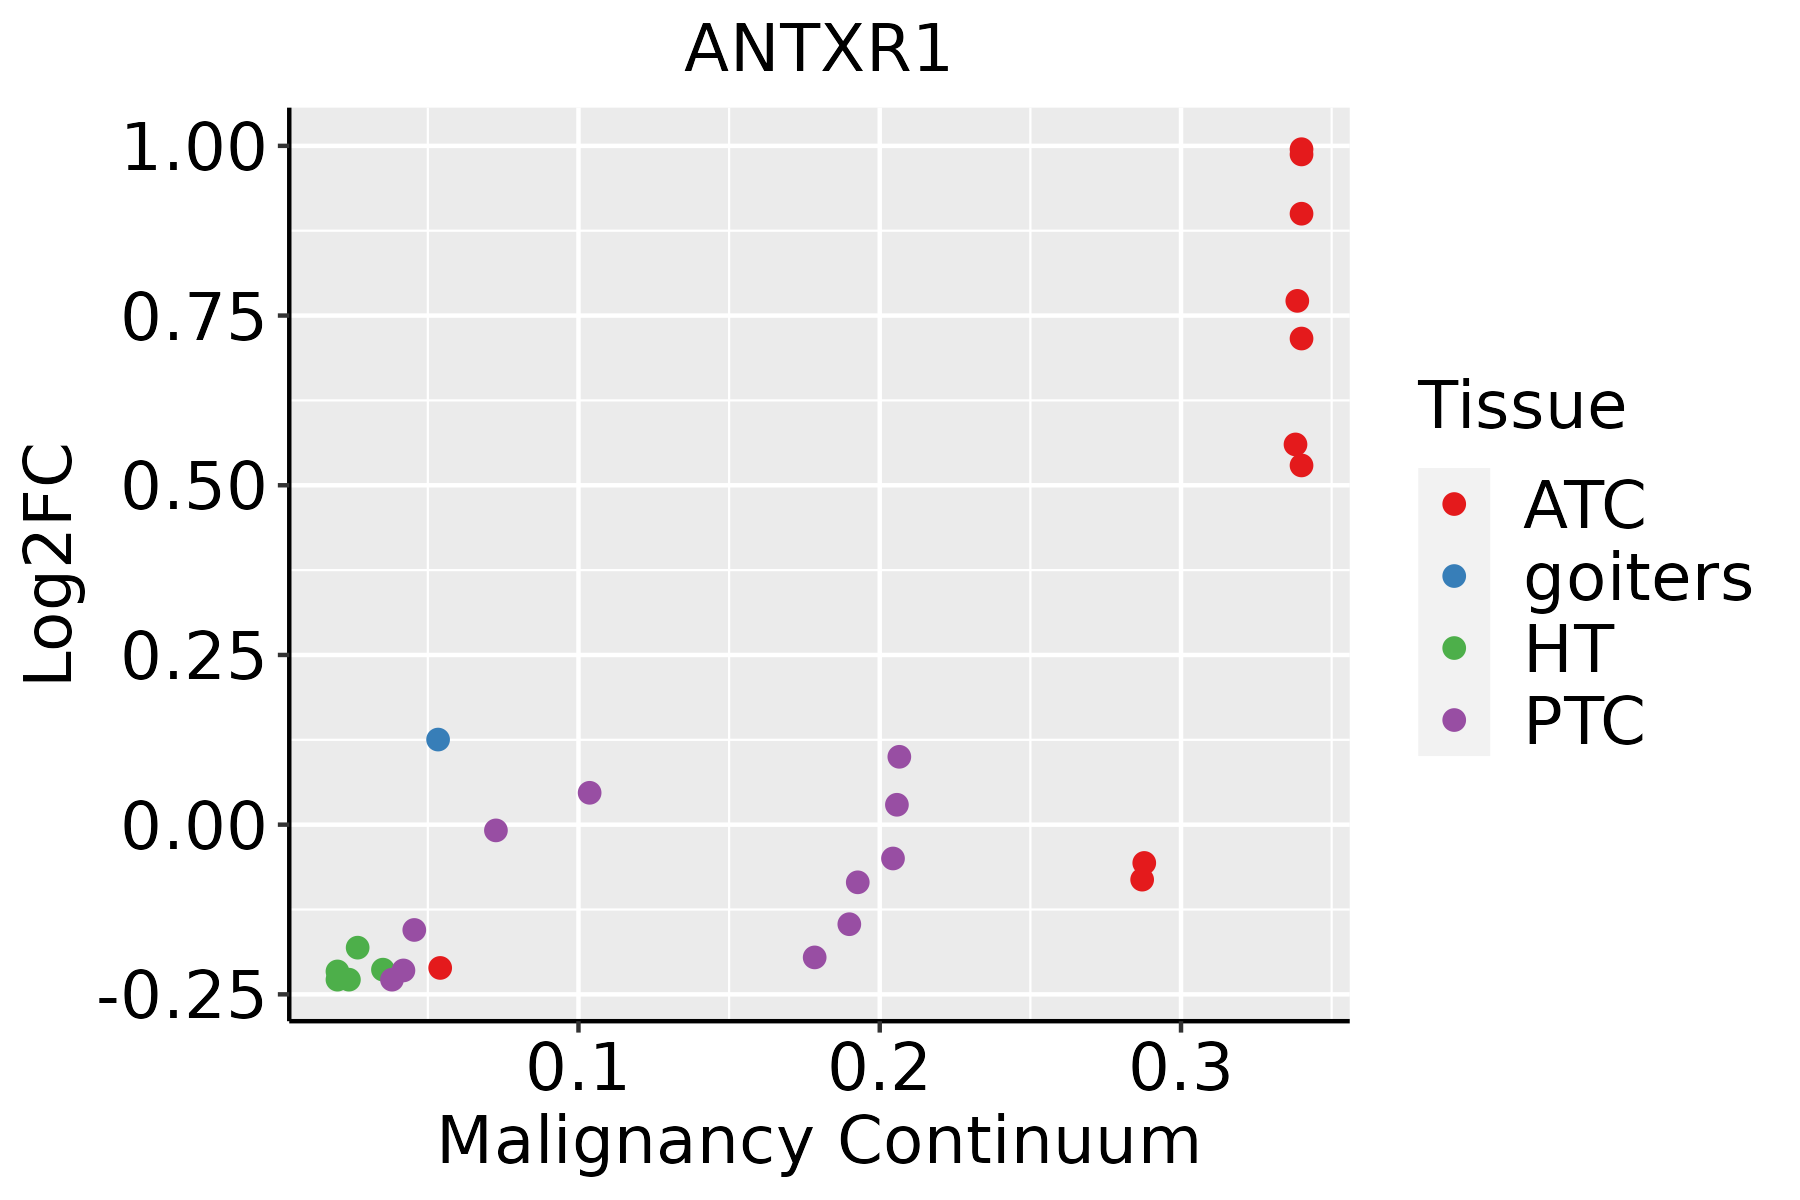 | ATC: Anaplastic thyroid cancer |
| HT: Hashimoto's thyroiditis | ||
| PTC: Papillary thyroid cancer |
| ∗log2FC in expression of this searched gene in stem-like cells from each diseased tissue sample relative to stem-like cells in normal samples in each tissue plotted against the malignancy continuum. Samples are colored based on if they are from different disease stage. |
Top |
Malignant transformation related pathway analysis |
| Find out the enriched GO biological processes and KEGG pathways involved in transition from healthy to precancer to cancer |
| Tissue | Disease Stage | Enriched GO biological Processes |
| Colorectum | AD |  |
| Colorectum | SER |  |
| Colorectum | MSS |  |
| Colorectum | MSI-H |  |
| Colorectum | FAP |  |
| ∗Top 15 enriched GO BP terms are showed in the bar plot of each disease state in each tissue. Each row represents a significant GO biological process which is colored according to the -log10(p.adjust). |
| Page: 1 2 3 4 5 6 7 8 9 |
| GO ID | Tissue | Disease Stage | Description | Gene Ratio | Bg Ratio | pvalue | p.adjust | Count |
| GO:003444618 | Oral cavity | OSCC | substrate adhesion-dependent cell spreading | 59/7305 | 108/18723 | 7.01e-04 | 3.89e-03 | 59 |
| GO:19019986 | Oral cavity | OSCC | toxin transport | 25/7305 | 40/18723 | 2.22e-03 | 1.00e-02 | 25 |
| GO:19030531 | Oral cavity | OSCC | regulation of extracellular matrix organization | 28/7305 | 48/18723 | 5.17e-03 | 2.02e-02 | 28 |
| GO:004586226 | Oral cavity | EOLP | positive regulation of proteolysis | 91/2218 | 372/18723 | 7.08e-12 | 1.15e-09 | 91 |
| GO:005254725 | Oral cavity | EOLP | regulation of peptidase activity | 105/2218 | 461/18723 | 1.86e-11 | 2.79e-09 | 105 |
| GO:003158925 | Oral cavity | EOLP | cell-substrate adhesion | 84/2218 | 363/18723 | 8.71e-10 | 6.29e-08 | 84 |
| GO:001095224 | Oral cavity | EOLP | positive regulation of peptidase activity | 53/2218 | 197/18723 | 5.39e-09 | 2.91e-07 | 53 |
| GO:003153223 | Oral cavity | EOLP | actin cytoskeleton reorganization | 34/2218 | 107/18723 | 3.66e-08 | 1.41e-06 | 34 |
| GO:003444623 | Oral cavity | EOLP | substrate adhesion-dependent cell spreading | 26/2218 | 108/18723 | 2.90e-04 | 2.74e-03 | 26 |
| GO:003019811 | Oral cavity | EOLP | extracellular matrix organization | 52/2218 | 301/18723 | 3.29e-03 | 1.90e-02 | 52 |
| GO:004306211 | Oral cavity | EOLP | extracellular structure organization | 52/2218 | 302/18723 | 3.52e-03 | 2.01e-02 | 52 |
| GO:004522911 | Oral cavity | EOLP | external encapsulating structure organization | 52/2218 | 304/18723 | 4.04e-03 | 2.23e-02 | 52 |
| GO:19012011 | Oral cavity | EOLP | regulation of extracellular matrix assembly | 6/2218 | 16/18723 | 7.66e-03 | 3.66e-02 | 6 |
| GO:003158932 | Oral cavity | NEOLP | cell-substrate adhesion | 93/2005 | 363/18723 | 4.93e-16 | 2.93e-13 | 93 |
| GO:005254733 | Oral cavity | NEOLP | regulation of peptidase activity | 98/2005 | 461/18723 | 1.77e-11 | 2.56e-09 | 98 |
| GO:004586233 | Oral cavity | NEOLP | positive regulation of proteolysis | 80/2005 | 372/18723 | 7.28e-10 | 5.54e-08 | 80 |
| GO:003444633 | Oral cavity | NEOLP | substrate adhesion-dependent cell spreading | 32/2005 | 108/18723 | 5.34e-08 | 2.16e-06 | 32 |
| GO:00301982 | Oral cavity | NEOLP | extracellular matrix organization | 64/2005 | 301/18723 | 5.66e-08 | 2.24e-06 | 64 |
| GO:00430622 | Oral cavity | NEOLP | extracellular structure organization | 64/2005 | 302/18723 | 6.44e-08 | 2.50e-06 | 64 |
| GO:00452292 | Oral cavity | NEOLP | external encapsulating structure organization | 64/2005 | 304/18723 | 8.33e-08 | 3.17e-06 | 64 |
| Page: 1 2 3 4 5 6 7 |
| Pathway ID | Tissue | Disease Stage | Description | Gene Ratio | Bg Ratio | pvalue | p.adjust | qvalue | Count |
| hsa0462122 | Esophagus | ESCC | NOD-like receptor signaling pathway | 116/4205 | 186/8465 | 2.90e-04 | 1.03e-03 | 5.30e-04 | 116 |
| hsa0462132 | Esophagus | ESCC | NOD-like receptor signaling pathway | 116/4205 | 186/8465 | 2.90e-04 | 1.03e-03 | 5.30e-04 | 116 |
| hsa046218 | Oral cavity | OSCC | NOD-like receptor signaling pathway | 108/3704 | 186/8465 | 5.13e-05 | 2.07e-04 | 1.05e-04 | 108 |
| hsa0462113 | Oral cavity | OSCC | NOD-like receptor signaling pathway | 108/3704 | 186/8465 | 5.13e-05 | 2.07e-04 | 1.05e-04 | 108 |
| Page: 1 |
Top |
Cell-cell communication analysis |
| Identification of potential cell-cell interactions between two cell types and their ligand-receptor pairs for different disease states |
| Ligand | Receptor | LRpair | Pathway | Tissue | Disease Stage |
| Page: 1 |
Top |
Single-cell gene regulatory network inference analysis |
| Find out the significant the regulons (TFs) and the target genes of each regulon across cell types for different disease states |
| TF | Cell Type | Tissue | Disease Stage | Target Gene | RSS | Regulon Activity |
| ∗The dot plots of a searched regulon are shown for all cell subpopulations in each disease state of each tissue based on the regulon specific score inferred using pySCENIC and by calculating the average expression. |
| Page: 1 |
Top |
Somatic mutation of malignant transformation related genes |
| Annotation of somatic variants for genes involved in malignant transformation |
| Hugo Symbol | Variant Class | Variant Classification | dbSNP RS | HGVSc | HGVSp | HGVSp Short | SWISSPROT | BIOTYPE | SIFT | PolyPhen | Tumor Sample Barcode | Tissue | Histology | Sex | Age | Stage | Therapy Types | Drugs | Outcome |
| ANTXR1 | SNV | Missense_Mutation | rs201850545 | c.1130C>T | p.Thr377Met | p.T377M | Q9H6X2 | protein_coding | deleterious(0.01) | probably_damaging(0.999) | TCGA-B6-A0I9-01 | Breast | breast invasive carcinoma | Female | <65 | III/IV | Unknown | Unknown | PD |
| ANTXR1 | insertion | In_Frame_Ins | novel | c.490_491insGAAGATATAATGGGGACCAAAACAGCCATGGCCCAGTCCTCA | p.Glu164delinsGlyArgTyrAsnGlyAspGlnAsnSerHisGlyProValLeuLys | p.E164delinsGRYNGDQNSHGPVLK | Q9H6X2 | protein_coding | TCGA-AN-A03X-01 | Breast | breast invasive carcinoma | Female | >=65 | I/II | Unknown | Unknown | SD | ||
| ANTXR1 | deletion | Frame_Shift_Del | novel | c.629delG | p.Gly210AlafsTer7 | p.G210Afs*7 | Q9H6X2 | protein_coding | TCGA-D8-A27V-01 | Breast | breast invasive carcinoma | Female | <65 | I/II | Hormone Therapy | tamoxiphen | SD | ||
| ANTXR1 | SNV | Missense_Mutation | novel | c.1652N>T | p.Arg551Met | p.R551M | Q9H6X2 | protein_coding | deleterious_low_confidence(0.02) | benign(0.041) | TCGA-C5-A1MK-01 | Cervix | cervical & endocervical cancer | Female | >=65 | III/IV | Chemotherapy | carboplatin | PD |
| ANTXR1 | SNV | Missense_Mutation | c.588N>A | p.Asp196Glu | p.D196E | Q9H6X2 | protein_coding | tolerated(0.75) | benign(0.036) | TCGA-EK-A2PM-01 | Cervix | cervical & endocervical cancer | Female | >=65 | I/II | Unknown | Unknown | SD | |
| ANTXR1 | SNV | Missense_Mutation | c.589N>T | p.His197Tyr | p.H197Y | Q9H6X2 | protein_coding | tolerated(0.06) | benign(0.299) | TCGA-EK-A2PM-01 | Cervix | cervical & endocervical cancer | Female | >=65 | I/II | Unknown | Unknown | SD | |
| ANTXR1 | SNV | Missense_Mutation | novel | c.1111N>T | p.Pro371Ser | p.P371S | Q9H6X2 | protein_coding | deleterious(0.03) | probably_damaging(0.981) | TCGA-VS-A94Z-01 | Cervix | cervical & endocervical cancer | Female | <65 | I/II | Chemotherapy | cisplatin | CR |
| ANTXR1 | SNV | Missense_Mutation | c.308G>A | p.Arg103His | p.R103H | Q9H6X2 | protein_coding | deleterious(0.03) | probably_damaging(0.915) | TCGA-AA-3502-01 | Colorectum | colon adenocarcinoma | Male | >=65 | I/II | Unknown | Unknown | SD | |
| ANTXR1 | SNV | Missense_Mutation | rs370351341 | c.1438C>T | p.Arg480Cys | p.R480C | Q9H6X2 | protein_coding | deleterious(0.01) | probably_damaging(0.954) | TCGA-AA-3510-01 | Colorectum | colon adenocarcinoma | Male | >=65 | I/II | Unknown | Unknown | SD |
| ANTXR1 | SNV | Missense_Mutation | rs149800589 | c.1316G>A | p.Arg439Gln | p.R439Q | Q9H6X2 | protein_coding | tolerated(0.27) | benign(0.354) | TCGA-AA-3844-01 | Colorectum | colon adenocarcinoma | Female | >=65 | III/IV | Chemotherapy | capecitabine | PD |
| Page: 1 2 3 4 5 6 7 8 |
Top |
Related drugs of malignant transformation related genes |
| Identification of chemicals and drugs interact with genes involved in malignant transfromation |
| (DGIdb 4.0) |
| Entrez ID | Symbol | Category | Interaction Types | Drug Claim Name | Drug Name | PMIDs |
| Page: 1 |

Copyright 2023-Present -The University of Texas Health Science Center at Houston |