
|
|||||
|
 | |
| |
| |
| |
| |
| |
|
Gene: ANO1 |
Gene summary for ANO1 |
| Gene information | Species | Human | Gene symbol | ANO1 | Gene ID | 55107 |
| Gene name | anoctamin 1 | |
| Gene Alias | DOG1 | |
| Cytomap | 11q13.3 | |
| Gene Type | protein-coding | GO ID | GO:0001678 | UniProtAcc | Q5XXA6 |
Top |
Malignant transformation analysis |
| Identification of the aberrant gene expression in precancerous and cancerous lesions by comparing the gene expression of stem-like cells in diseased tissues with normal stem cells |
| Entrez ID | Symbol | Replicates | Species | Organ | Tissue | Adj P-value | Log2FC | Malignancy |
| 55107 | ANO1 | Tumor | Human | Cervix | CC | 2.51e-34 | 6.66e-01 | 0.1241 |
| 55107 | ANO1 | sample3 | Human | Cervix | CC | 8.31e-47 | 6.71e-01 | 0.1387 |
| 55107 | ANO1 | T3 | Human | Cervix | CC | 8.08e-42 | 6.55e-01 | 0.1389 |
| 55107 | ANO1 | HTA11_2487_2000001011 | Human | Colorectum | SER | 7.90e-11 | 3.54e-01 | -0.1808 |
| 55107 | ANO1 | HTA11_2951_2000001011 | Human | Colorectum | AD | 3.40e-03 | 2.91e-01 | 0.0216 |
| 55107 | ANO1 | HTA11_78_2000001011 | Human | Colorectum | AD | 2.65e-10 | 2.87e-01 | -0.1088 |
| 55107 | ANO1 | HTA11_3361_2000001011 | Human | Colorectum | AD | 2.22e-02 | 1.51e-01 | -0.1207 |
| 55107 | ANO1 | HTA11_866_2000001011 | Human | Colorectum | AD | 2.40e-03 | 2.23e-01 | -0.1001 |
| 55107 | ANO1 | HTA11_7663_2000001011 | Human | Colorectum | SER | 7.76e-07 | 4.13e-01 | 0.0131 |
| 55107 | ANO1 | HTA11_99999970781_79442 | Human | Colorectum | MSS | 2.86e-05 | 1.07e-01 | 0.294 |
| 55107 | ANO1 | LZE2T | Human | Esophagus | ESCC | 1.02e-03 | 7.91e-01 | 0.082 |
| 55107 | ANO1 | LZE4T | Human | Esophagus | ESCC | 4.55e-12 | 4.66e-01 | 0.0811 |
| 55107 | ANO1 | LZE8T | Human | Esophagus | ESCC | 2.13e-02 | 3.03e-01 | 0.067 |
| 55107 | ANO1 | LZE22T | Human | Esophagus | ESCC | 2.72e-04 | 7.72e-01 | 0.068 |
| 55107 | ANO1 | LZE21T | Human | Esophagus | ESCC | 1.22e-02 | 8.05e-01 | 0.0655 |
| 55107 | ANO1 | P2T-E | Human | Esophagus | ESCC | 3.01e-48 | 1.08e+00 | 0.1177 |
| 55107 | ANO1 | P5T-E | Human | Esophagus | ESCC | 1.90e-20 | 3.74e-01 | 0.1327 |
| 55107 | ANO1 | P8T-E | Human | Esophagus | ESCC | 1.49e-03 | 1.15e-01 | 0.0889 |
| 55107 | ANO1 | P11T-E | Human | Esophagus | ESCC | 1.62e-07 | 3.76e-01 | 0.1426 |
| 55107 | ANO1 | P15T-E | Human | Esophagus | ESCC | 2.17e-12 | 5.90e-01 | 0.1149 |
| Page: 1 2 3 4 |
| Tissue | Expression Dynamics | Abbreviation |
| Cervix | 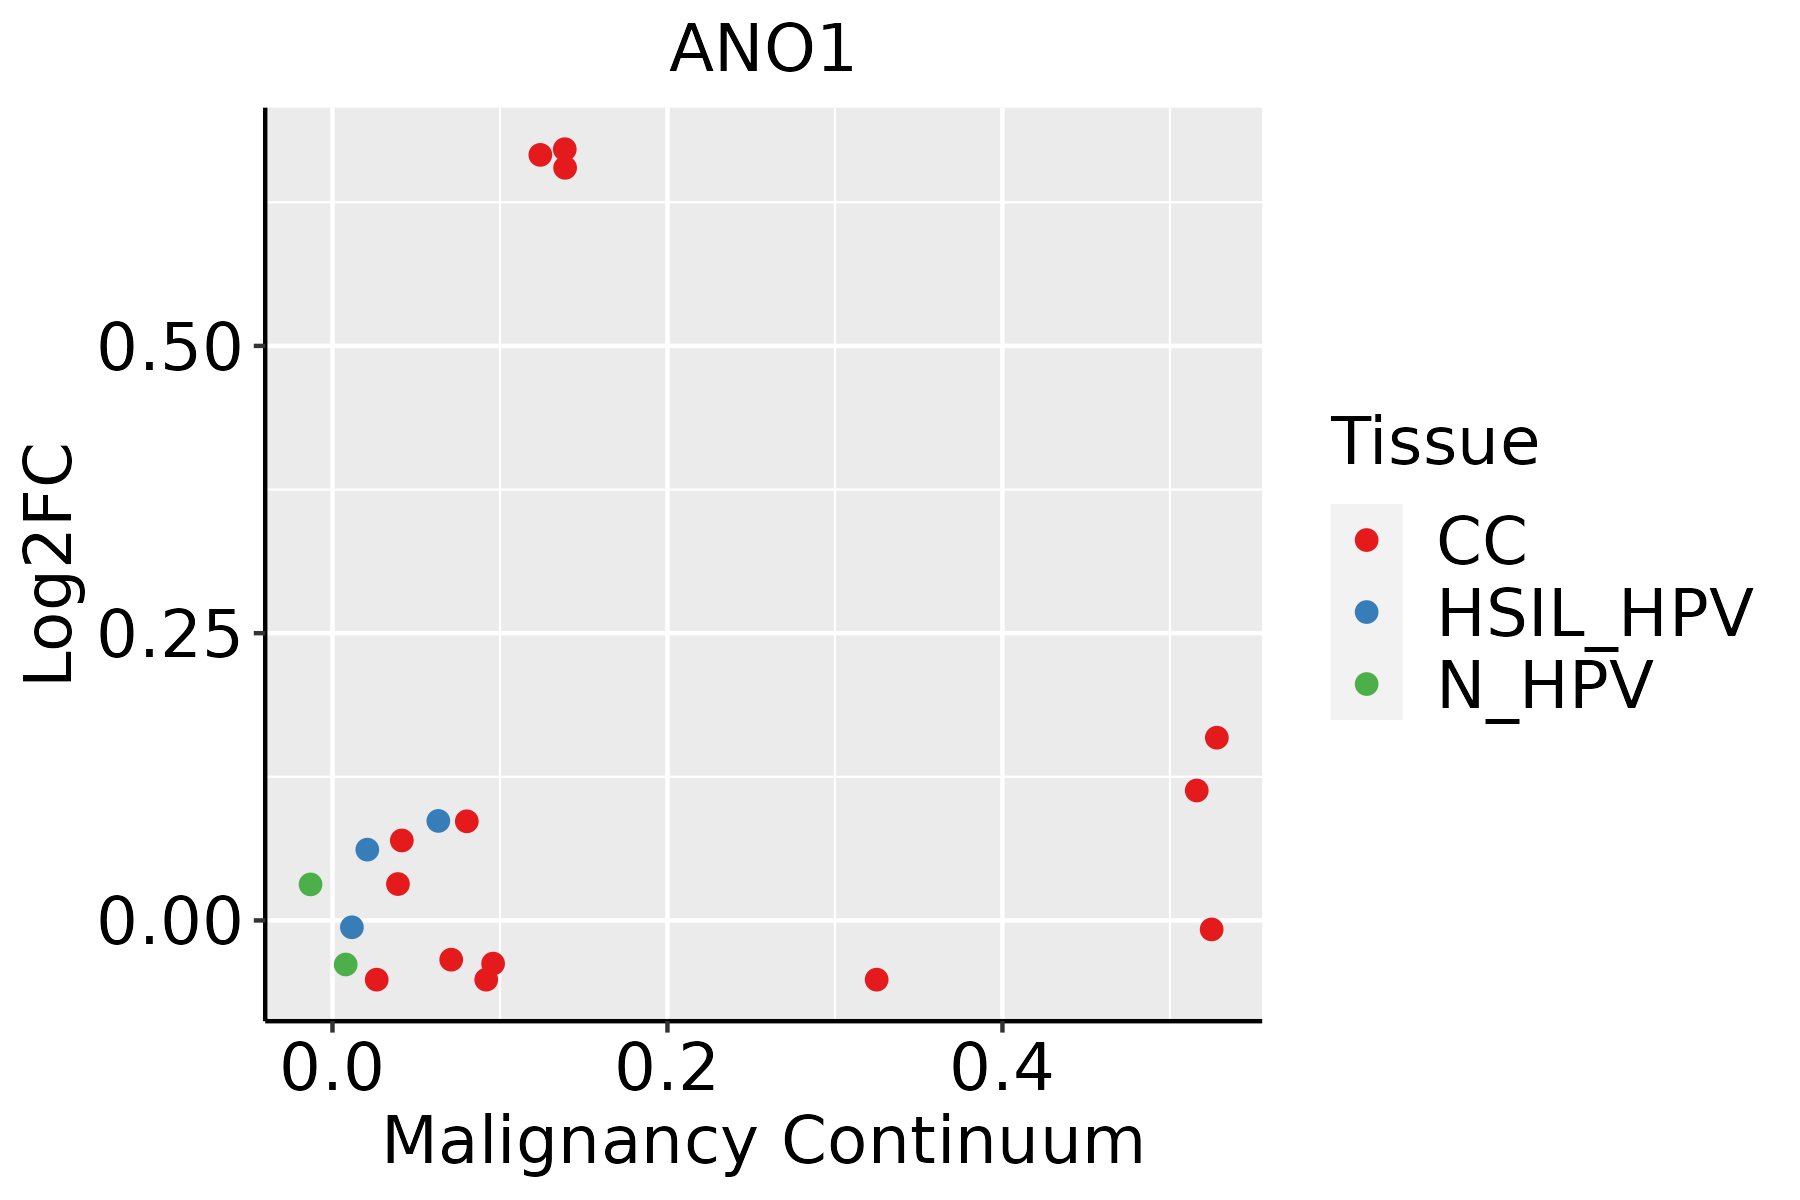 | CC: Cervix cancer |
| HSIL_HPV: HPV-infected high-grade squamous intraepithelial lesions | ||
| N_HPV: HPV-infected normal cervix | ||
| Colorectum (GSE201348) |  | FAP: Familial adenomatous polyposis |
| CRC: Colorectal cancer | ||
| Colorectum (HTA11) |  | AD: Adenomas |
| SER: Sessile serrated lesions | ||
| MSI-H: Microsatellite-high colorectal cancer | ||
| MSS: Microsatellite stable colorectal cancer | ||
| Esophagus | 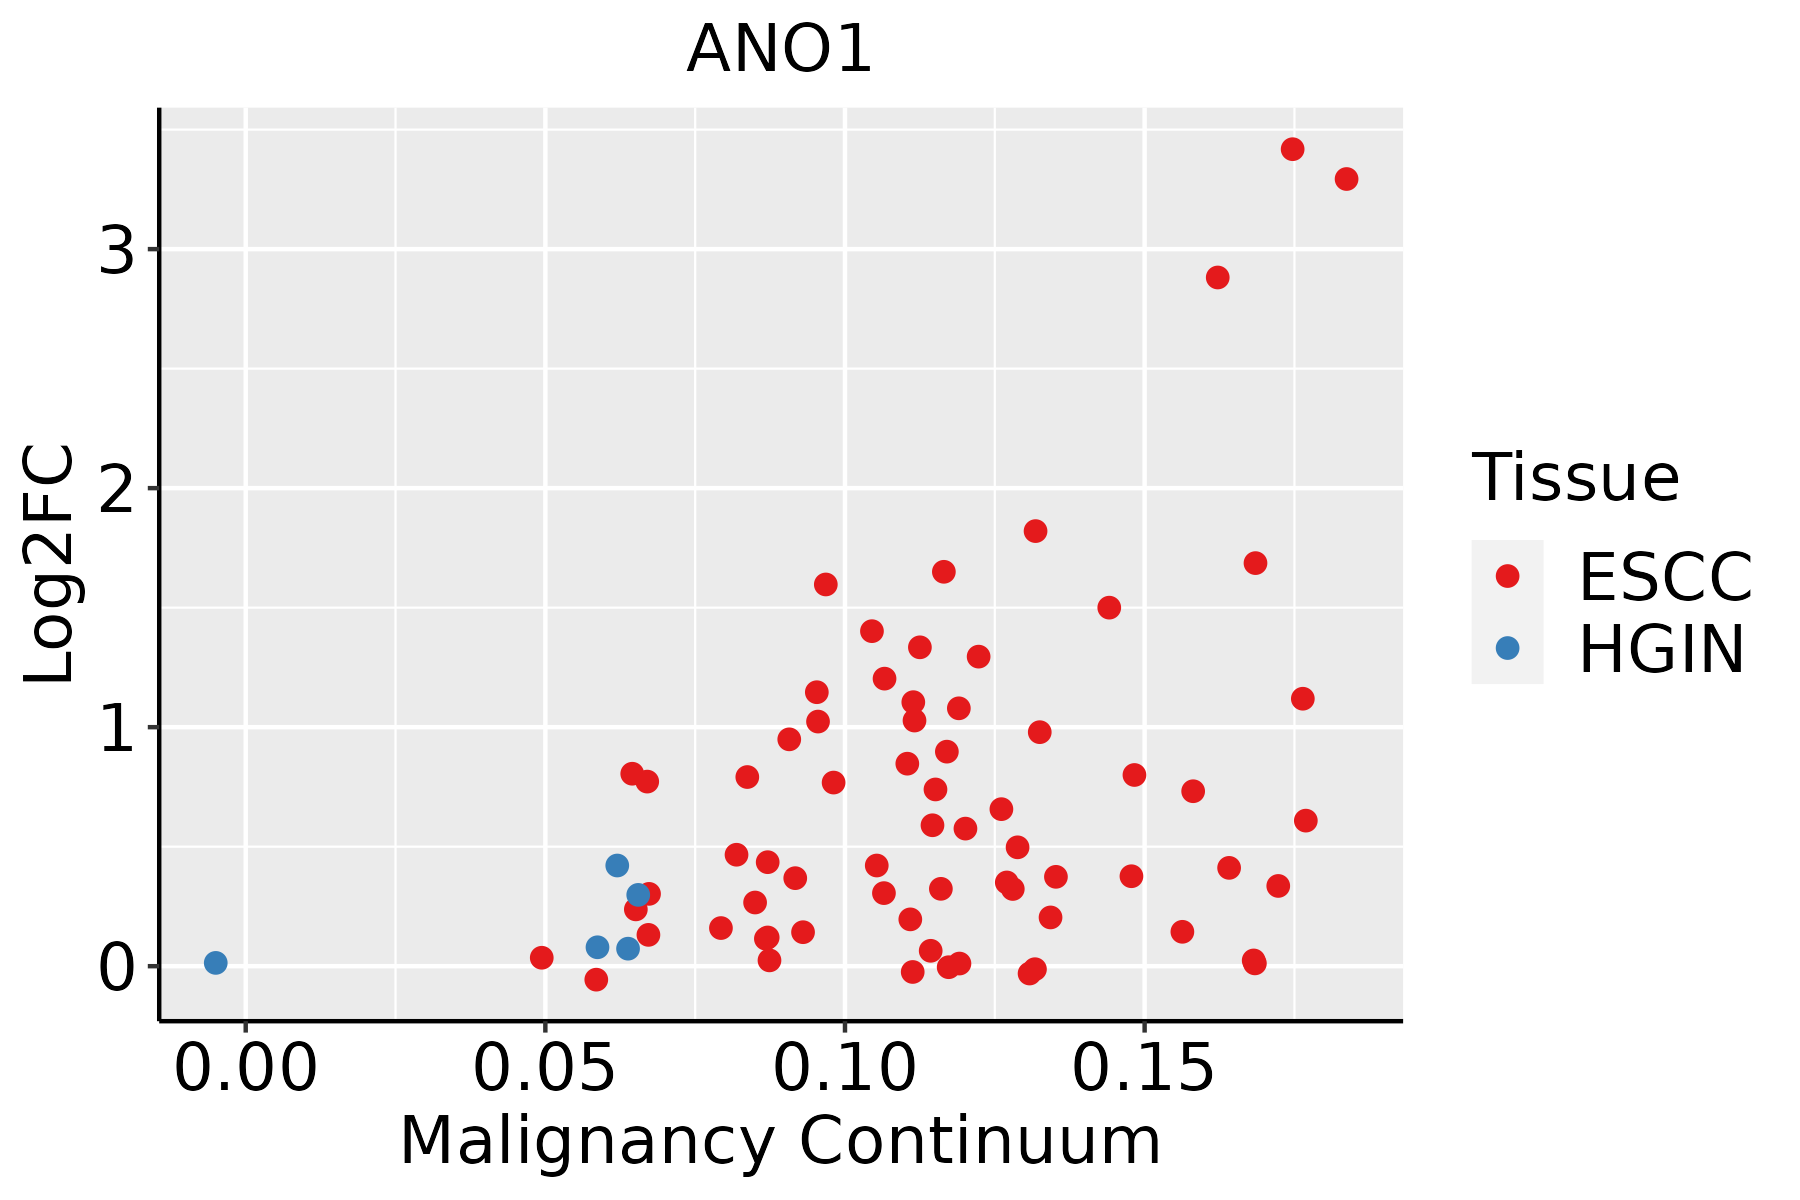 | ESCC: Esophageal squamous cell carcinoma |
| HGIN: High-grade intraepithelial neoplasias | ||
| LGIN: Low-grade intraepithelial neoplasias | ||
| Oral Cavity | 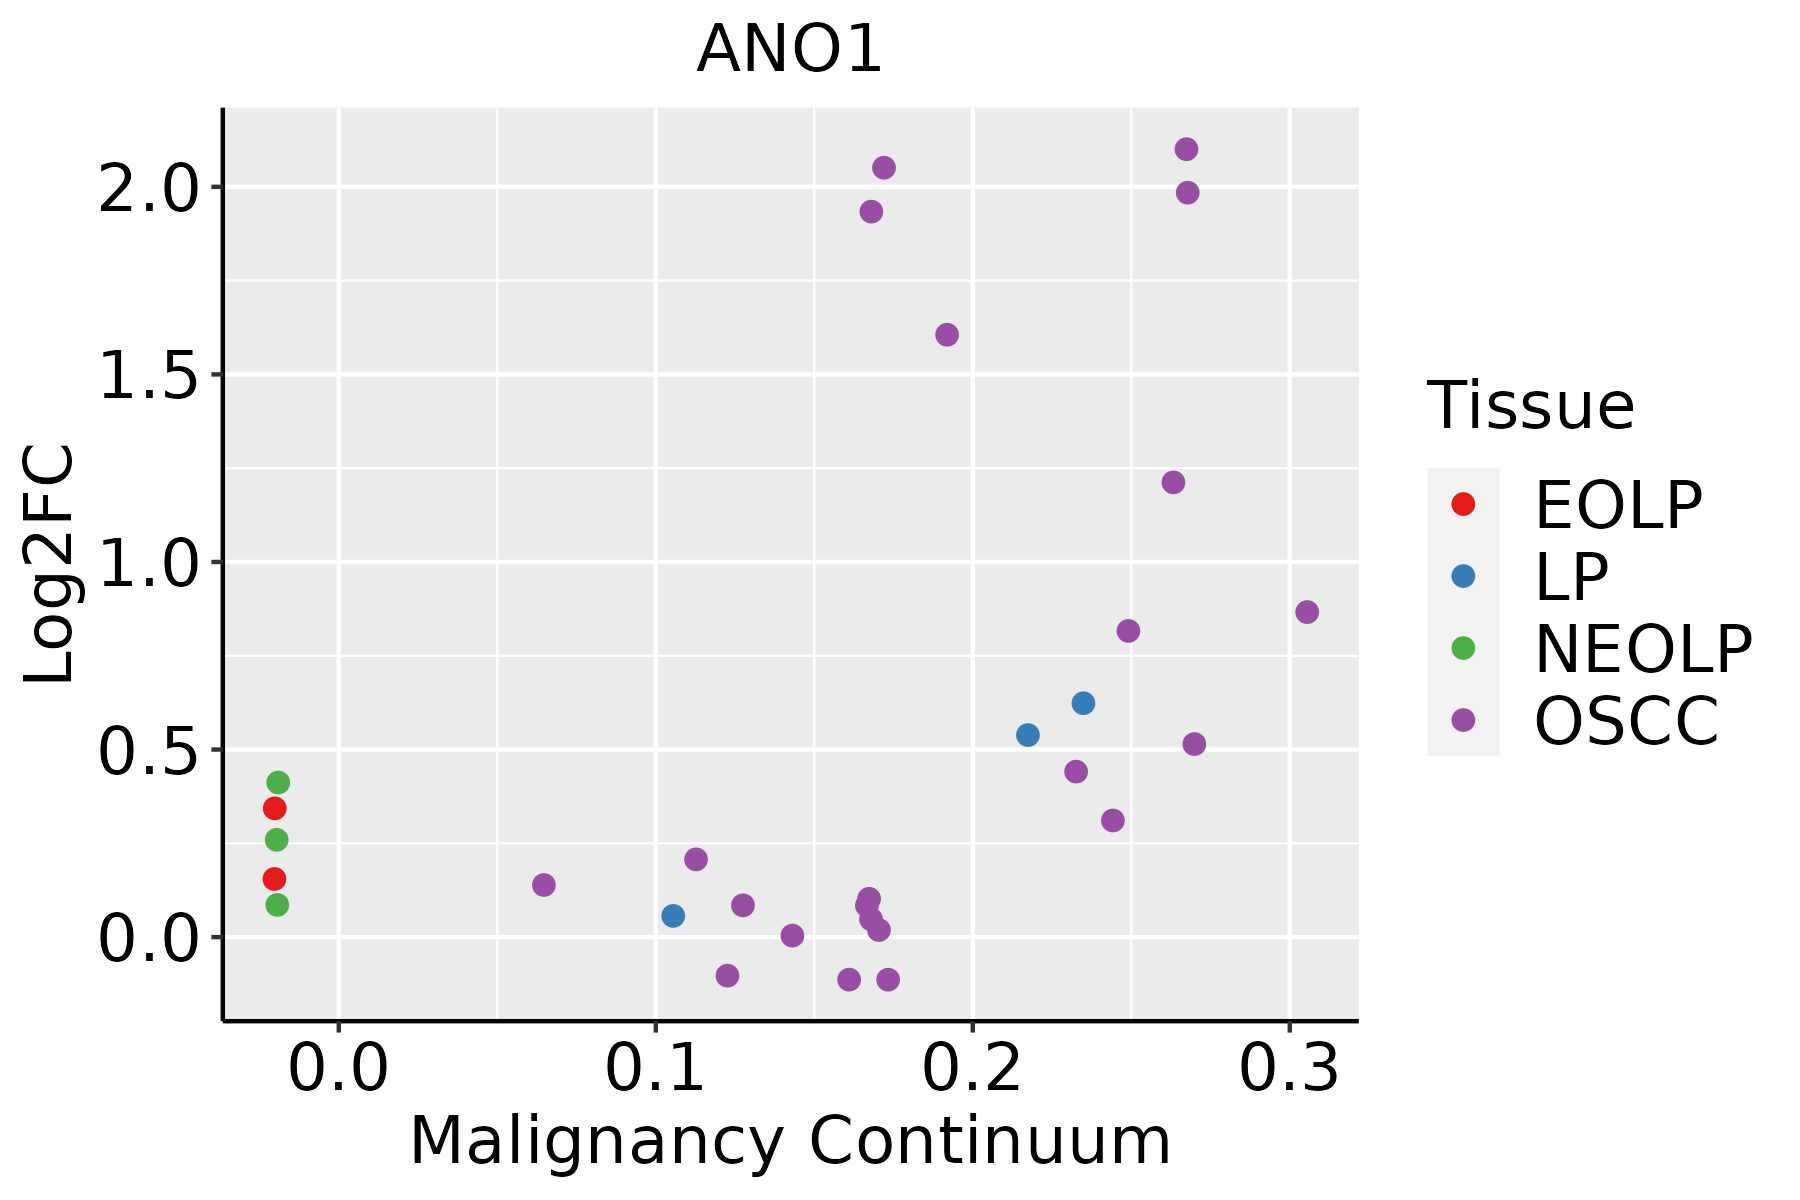 | EOLP: Erosive Oral lichen planus |
| LP: leukoplakia | ||
| NEOLP: Non-erosive oral lichen planus | ||
| OSCC: Oral squamous cell carcinoma |
| ∗log2FC in expression of this searched gene in stem-like cells from each diseased tissue sample relative to stem-like cells in normal samples in each tissue plotted against the malignancy continuum. Samples are colored based on if they are from different disease stage. |
Top |
Malignant transformation related pathway analysis |
| Find out the enriched GO biological processes and KEGG pathways involved in transition from healthy to precancer to cancer |
| Tissue | Disease Stage | Enriched GO biological Processes |
| Colorectum | AD |  |
| Colorectum | SER |  |
| Colorectum | MSS |  |
| Colorectum | MSI-H |  |
| Colorectum | FAP |  |
| ∗Top 15 enriched GO BP terms are showed in the bar plot of each disease state in each tissue. Each row represents a significant GO biological process which is colored according to the -log10(p.adjust). |
| Page: 1 2 3 4 5 6 7 8 9 |
| GO ID | Tissue | Disease Stage | Description | Gene Ratio | Bg Ratio | pvalue | p.adjust | Count |
| GO:0071692 | Colorectum | AD | protein localization to extracellular region | 106/3918 | 368/18723 | 1.86e-04 | 2.49e-03 | 106 |
| GO:0050796 | Colorectum | AD | regulation of insulin secretion | 54/3918 | 165/18723 | 2.60e-04 | 3.25e-03 | 54 |
| GO:0051047 | Colorectum | AD | positive regulation of secretion | 90/3918 | 310/18723 | 4.11e-04 | 4.66e-03 | 90 |
| GO:0030073 | Colorectum | AD | insulin secretion | 61/3918 | 195/18723 | 4.28e-04 | 4.81e-03 | 61 |
| GO:1903532 | Colorectum | AD | positive regulation of secretion by cell | 82/3918 | 282/18723 | 6.85e-04 | 7.00e-03 | 82 |
| GO:0061178 | Colorectum | AD | regulation of insulin secretion involved in cellular response to glucose stimulus | 25/3918 | 64/18723 | 6.98e-04 | 7.10e-03 | 25 |
| GO:0015833 | Colorectum | AD | peptide transport | 77/3918 | 264/18723 | 8.90e-04 | 8.60e-03 | 77 |
| GO:0035773 | Colorectum | AD | insulin secretion involved in cellular response to glucose stimulus | 27/3918 | 73/18723 | 1.17e-03 | 1.05e-02 | 27 |
| GO:0090087 | Colorectum | AD | regulation of peptide transport | 60/3918 | 202/18723 | 1.94e-03 | 1.58e-02 | 60 |
| GO:0030072 | Colorectum | AD | peptide hormone secretion | 68/3918 | 236/18723 | 2.39e-03 | 1.85e-02 | 68 |
| GO:0002791 | Colorectum | AD | regulation of peptide secretion | 59/3918 | 200/18723 | 2.50e-03 | 1.92e-02 | 59 |
| GO:0090276 | Colorectum | AD | regulation of peptide hormone secretion | 58/3918 | 196/18723 | 2.51e-03 | 1.92e-02 | 58 |
| GO:0002790 | Colorectum | AD | peptide secretion | 69/3918 | 242/18723 | 2.97e-03 | 2.22e-02 | 69 |
| GO:0042886 | Colorectum | AD | amide transport | 83/3918 | 301/18723 | 3.37e-03 | 2.46e-02 | 83 |
| GO:0032024 | Colorectum | AD | positive regulation of insulin secretion | 27/3918 | 78/18723 | 3.52e-03 | 2.54e-02 | 27 |
| GO:0050714 | Colorectum | AD | positive regulation of protein secretion | 42/3918 | 137/18723 | 4.64e-03 | 3.16e-02 | 42 |
| GO:0034605 | Colorectum | AD | cellular response to heat | 24/3918 | 69/18723 | 5.35e-03 | 3.52e-02 | 24 |
| GO:0015698 | Colorectum | AD | inorganic anion transport | 52/3918 | 180/18723 | 6.83e-03 | 4.22e-02 | 52 |
| GO:19049511 | Colorectum | SER | positive regulation of establishment of protein localization | 91/2897 | 319/18723 | 1.69e-09 | 1.68e-07 | 91 |
| GO:00512221 | Colorectum | SER | positive regulation of protein transport | 85/2897 | 303/18723 | 1.36e-08 | 1.05e-06 | 85 |
| Page: 1 2 3 4 5 6 7 8 9 10 11 |
| Pathway ID | Tissue | Disease Stage | Description | Gene Ratio | Bg Ratio | pvalue | p.adjust | qvalue | Count |
| Page: 1 |
Top |
Cell-cell communication analysis |
| Identification of potential cell-cell interactions between two cell types and their ligand-receptor pairs for different disease states |
| Ligand | Receptor | LRpair | Pathway | Tissue | Disease Stage |
| Page: 1 |
Top |
Single-cell gene regulatory network inference analysis |
| Find out the significant the regulons (TFs) and the target genes of each regulon across cell types for different disease states |
| TF | Cell Type | Tissue | Disease Stage | Target Gene | RSS | Regulon Activity |
| ∗The dot plots of a searched regulon are shown for all cell subpopulations in each disease state of each tissue based on the regulon specific score inferred using pySCENIC and by calculating the average expression. |
| Page: 1 |
Top |
Somatic mutation of malignant transformation related genes |
| Annotation of somatic variants for genes involved in malignant transformation |
| Hugo Symbol | Variant Class | Variant Classification | dbSNP RS | HGVSc | HGVSp | HGVSp Short | SWISSPROT | BIOTYPE | SIFT | PolyPhen | Tumor Sample Barcode | Tissue | Histology | Sex | Age | Stage | Therapy Types | Drugs | Outcome |
| ANO1 | SNV | Missense_Mutation | c.643N>G | p.Gln215Glu | p.Q215E | Q5XXA6 | protein_coding | tolerated(0.94) | benign(0.007) | TCGA-C8-A27B-01 | Breast | breast invasive carcinoma | Female | <65 | I/II | Chemotherapy | 5-fluorouracil | CR | |
| ANO1 | SNV | Missense_Mutation | c.1812N>C | p.Glu604Asp | p.E604D | Q5XXA6 | protein_coding | tolerated(0.24) | benign(0.261) | TCGA-D8-A1JA-01 | Breast | breast invasive carcinoma | Female | <65 | III/IV | Chemotherapy | adriamycin | PD | |
| ANO1 | SNV | Missense_Mutation | rs201962504 | c.2632G>A | p.Asp878Asn | p.D878N | Q5XXA6 | protein_coding | deleterious(0.02) | possibly_damaging(0.617) | TCGA-S3-AA12-01 | Breast | breast invasive carcinoma | Female | >=65 | III/IV | Hormone Therapy | anastrozole | SD |
| ANO1 | SNV | Missense_Mutation | novel | c.1130N>T | p.Thr377Ile | p.T377I | Q5XXA6 | protein_coding | tolerated(0.18) | possibly_damaging(0.859) | TCGA-2W-A8YY-01 | Cervix | cervical & endocervical cancer | Female | <65 | I/II | Chemotherapy | cisplatin | CR |
| ANO1 | SNV | Missense_Mutation | novel | c.2410N>A | p.Val804Met | p.V804M | Q5XXA6 | protein_coding | deleterious(0) | probably_damaging(0.999) | TCGA-2W-A8YY-01 | Cervix | cervical & endocervical cancer | Female | <65 | I/II | Chemotherapy | cisplatin | CR |
| ANO1 | SNV | Missense_Mutation | rs770219157 | c.2873N>T | p.Pro958Leu | p.P958L | Q5XXA6 | protein_coding | tolerated(0.26) | benign(0.001) | TCGA-2W-A8YY-01 | Cervix | cervical & endocervical cancer | Female | <65 | I/II | Chemotherapy | cisplatin | CR |
| ANO1 | SNV | Missense_Mutation | rs778151682 | c.880N>A | p.Glu294Lys | p.E294K | Q5XXA6 | protein_coding | tolerated(0.07) | benign(0.063) | TCGA-FU-A3HZ-01 | Cervix | cervical & endocervical cancer | Female | <65 | I/II | Chemotherapy | cisplatin | CR |
| ANO1 | SNV | Missense_Mutation | c.1360N>A | p.Pro454Thr | p.P454T | Q5XXA6 | protein_coding | tolerated(0.11) | possibly_damaging(0.898) | TCGA-IR-A3LK-01 | Cervix | cervical & endocervical cancer | Female | >=65 | I/II | Chemotherapy | cisplatin | PD | |
| ANO1 | SNV | Missense_Mutation | rs373835880 | c.2473N>A | p.Gly825Arg | p.G825R | Q5XXA6 | protein_coding | deleterious(0.03) | probably_damaging(1) | TCGA-IR-A3LK-01 | Cervix | cervical & endocervical cancer | Female | >=65 | I/II | Chemotherapy | cisplatin | PD |
| ANO1 | SNV | Missense_Mutation | rs768459625 | c.2140N>A | p.Glu714Lys | p.E714K | Q5XXA6 | protein_coding | deleterious(0.01) | possibly_damaging(0.745) | TCGA-JX-A5QV-01 | Cervix | cervical & endocervical cancer | Female | <65 | I/II | Unknown | Unknown | SD |
| Page: 1 2 3 4 5 6 7 8 9 10 |
Top |
Related drugs of malignant transformation related genes |
| Identification of chemicals and drugs interact with genes involved in malignant transfromation |
| (DGIdb 4.0) |
| Entrez ID | Symbol | Category | Interaction Types | Drug Claim Name | Drug Name | PMIDs |
| 55107 | ANO1 | ION CHANNEL | blocker | 178100996 | ||
| 55107 | ANO1 | ION CHANNEL | blocker | 178100993 | ||
| 55107 | ANO1 | ION CHANNEL | blocker | 178101041 | ||
| 55107 | ANO1 | ION CHANNEL | activator | 135652731 | ||
| 55107 | ANO1 | ION CHANNEL | blocker | 135650716 | ||
| 55107 | ANO1 | ION CHANNEL | blocker | 178100935 | ||
| 55107 | ANO1 | ION CHANNEL | blocker | 53801058 | MIBEFRADIL | |
| 55107 | ANO1 | ION CHANNEL | blocker | 178101136 | ||
| 55107 | ANO1 | ION CHANNEL | blocker | 135650270 | FLUOXETINE | |
| 55107 | ANO1 | ION CHANNEL | blocker | 135650269 |
| Page: 1 2 |

Copyright 2023-Present -The University of Texas Health Science Center at Houston |