
|
|||||
|
 | |
| |
| |
| |
| |
| |
|
Gene: ADRB2 |
Gene summary for ADRB2 |
| Gene information | Species | Human | Gene symbol | ADRB2 | Gene ID | 154 |
| Gene name | adrenoceptor beta 2 | |
| Gene Alias | ADRB2R | |
| Cytomap | 5q32 | |
| Gene Type | protein-coding | GO ID | GO:0000165 | UniProtAcc | P07550 |
Top |
Malignant transformation analysis |
| Identification of the aberrant gene expression in precancerous and cancerous lesions by comparing the gene expression of stem-like cells in diseased tissues with normal stem cells |
| Entrez ID | Symbol | Replicates | Species | Organ | Tissue | Adj P-value | Log2FC | Malignancy |
| 154 | ADRB2 | LZE4T | Human | Esophagus | ESCC | 2.06e-10 | 2.73e-01 | 0.0811 |
| 154 | ADRB2 | LZE8T | Human | Esophagus | ESCC | 2.19e-09 | 5.94e-01 | 0.067 |
| 154 | ADRB2 | LZE20T | Human | Esophagus | ESCC | 8.20e-04 | 2.23e-01 | 0.0662 |
| 154 | ADRB2 | LZE24T | Human | Esophagus | ESCC | 6.97e-15 | 7.92e-01 | 0.0596 |
| 154 | ADRB2 | P1T-E | Human | Esophagus | ESCC | 1.31e-16 | 8.44e-01 | 0.0875 |
| 154 | ADRB2 | P2T-E | Human | Esophagus | ESCC | 7.10e-18 | 4.64e-01 | 0.1177 |
| 154 | ADRB2 | P4T-E | Human | Esophagus | ESCC | 2.38e-02 | 1.46e-01 | 0.1323 |
| 154 | ADRB2 | P5T-E | Human | Esophagus | ESCC | 8.37e-22 | 7.07e-01 | 0.1327 |
| 154 | ADRB2 | P8T-E | Human | Esophagus | ESCC | 3.81e-06 | 2.06e-01 | 0.0889 |
| 154 | ADRB2 | P9T-E | Human | Esophagus | ESCC | 1.64e-08 | 4.06e-01 | 0.1131 |
| 154 | ADRB2 | P10T-E | Human | Esophagus | ESCC | 2.44e-05 | 1.51e-01 | 0.116 |
| 154 | ADRB2 | P11T-E | Human | Esophagus | ESCC | 5.75e-10 | 1.09e+00 | 0.1426 |
| 154 | ADRB2 | P17T-E | Human | Esophagus | ESCC | 1.63e-04 | 3.53e-01 | 0.1278 |
| 154 | ADRB2 | P20T-E | Human | Esophagus | ESCC | 8.67e-13 | 6.04e-01 | 0.1124 |
| 154 | ADRB2 | P21T-E | Human | Esophagus | ESCC | 3.58e-22 | 6.48e-01 | 0.1617 |
| 154 | ADRB2 | P23T-E | Human | Esophagus | ESCC | 5.61e-33 | 1.76e+00 | 0.108 |
| 154 | ADRB2 | P24T-E | Human | Esophagus | ESCC | 1.70e-06 | 2.25e-01 | 0.1287 |
| 154 | ADRB2 | P26T-E | Human | Esophagus | ESCC | 8.59e-11 | 2.98e-01 | 0.1276 |
| 154 | ADRB2 | P27T-E | Human | Esophagus | ESCC | 1.55e-10 | 4.30e-01 | 0.1055 |
| 154 | ADRB2 | P28T-E | Human | Esophagus | ESCC | 4.03e-20 | 5.24e-01 | 0.1149 |
| Page: 1 2 3 4 |
| Tissue | Expression Dynamics | Abbreviation |
| Esophagus | 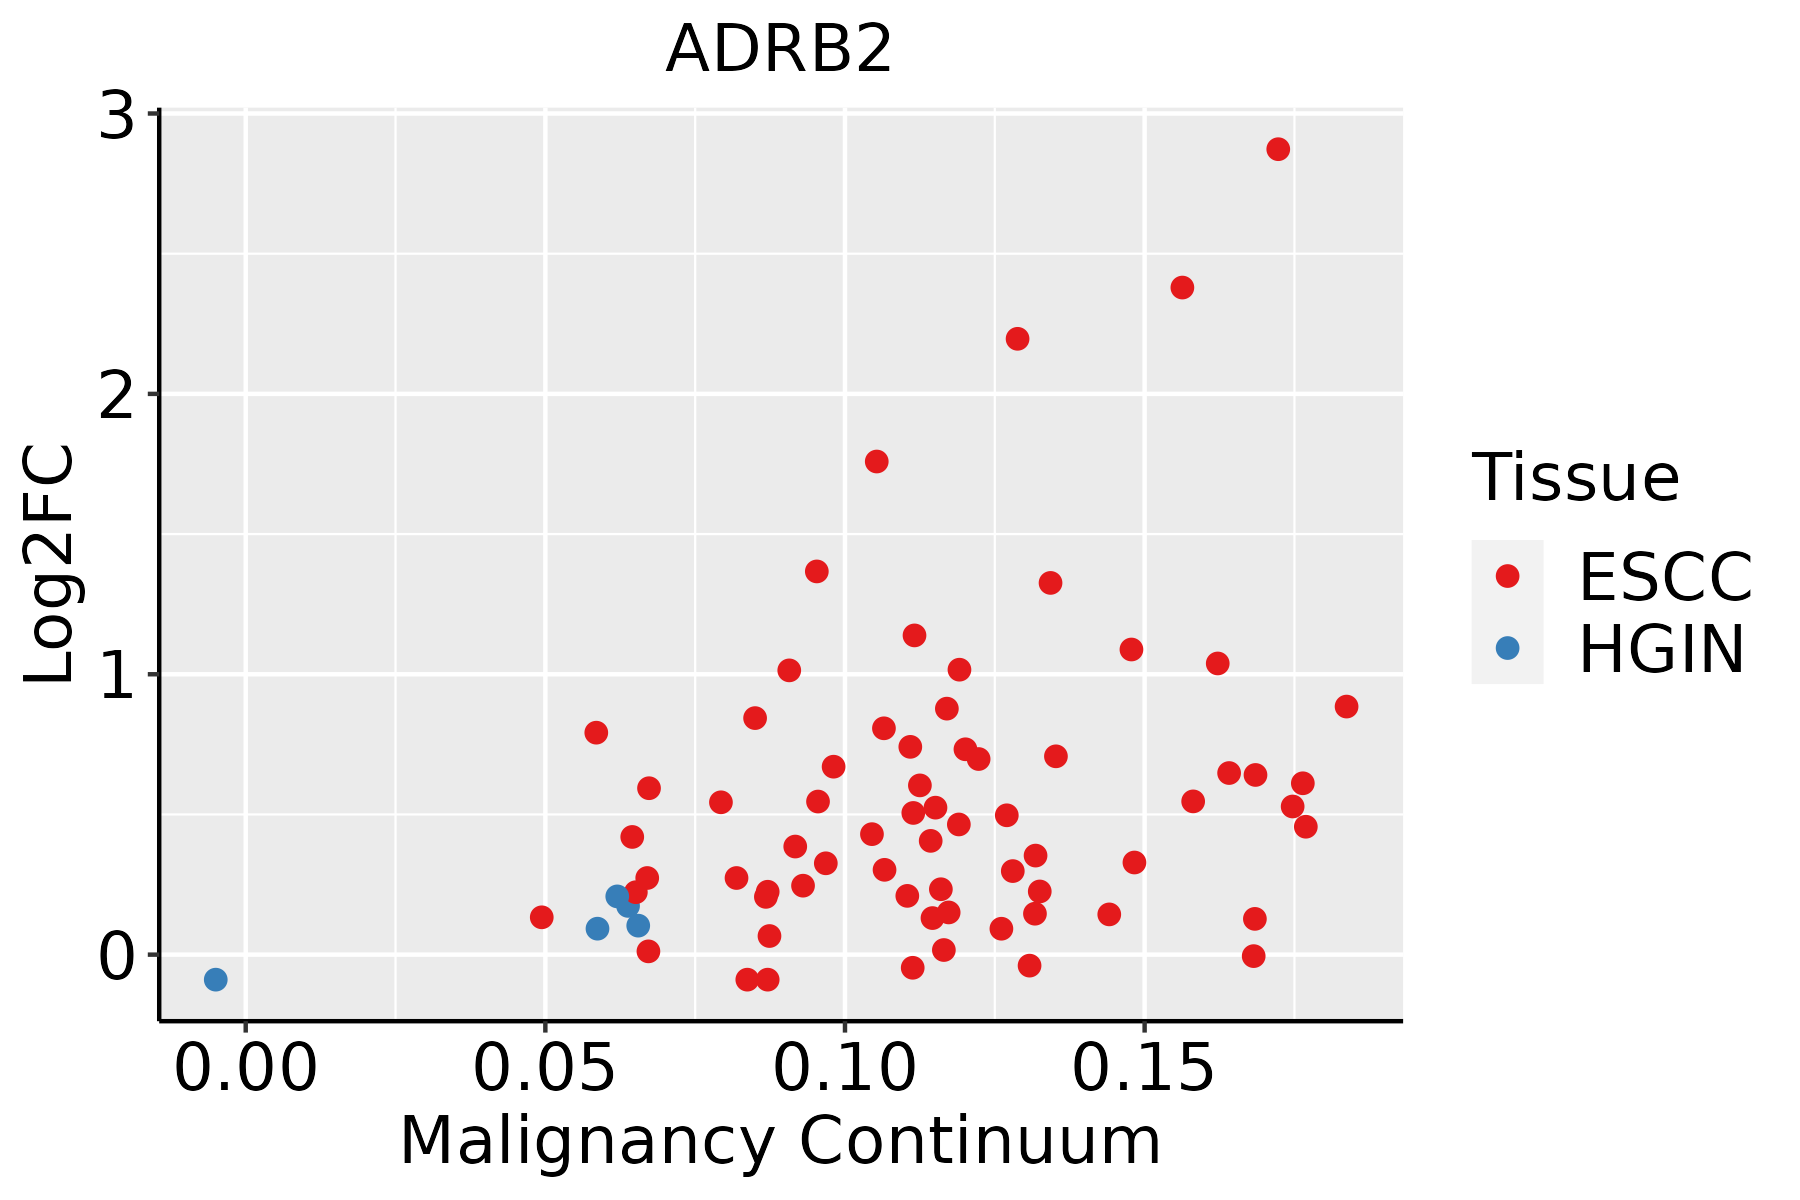 | ESCC: Esophageal squamous cell carcinoma |
| HGIN: High-grade intraepithelial neoplasias | ||
| LGIN: Low-grade intraepithelial neoplasias | ||
| Oral Cavity | 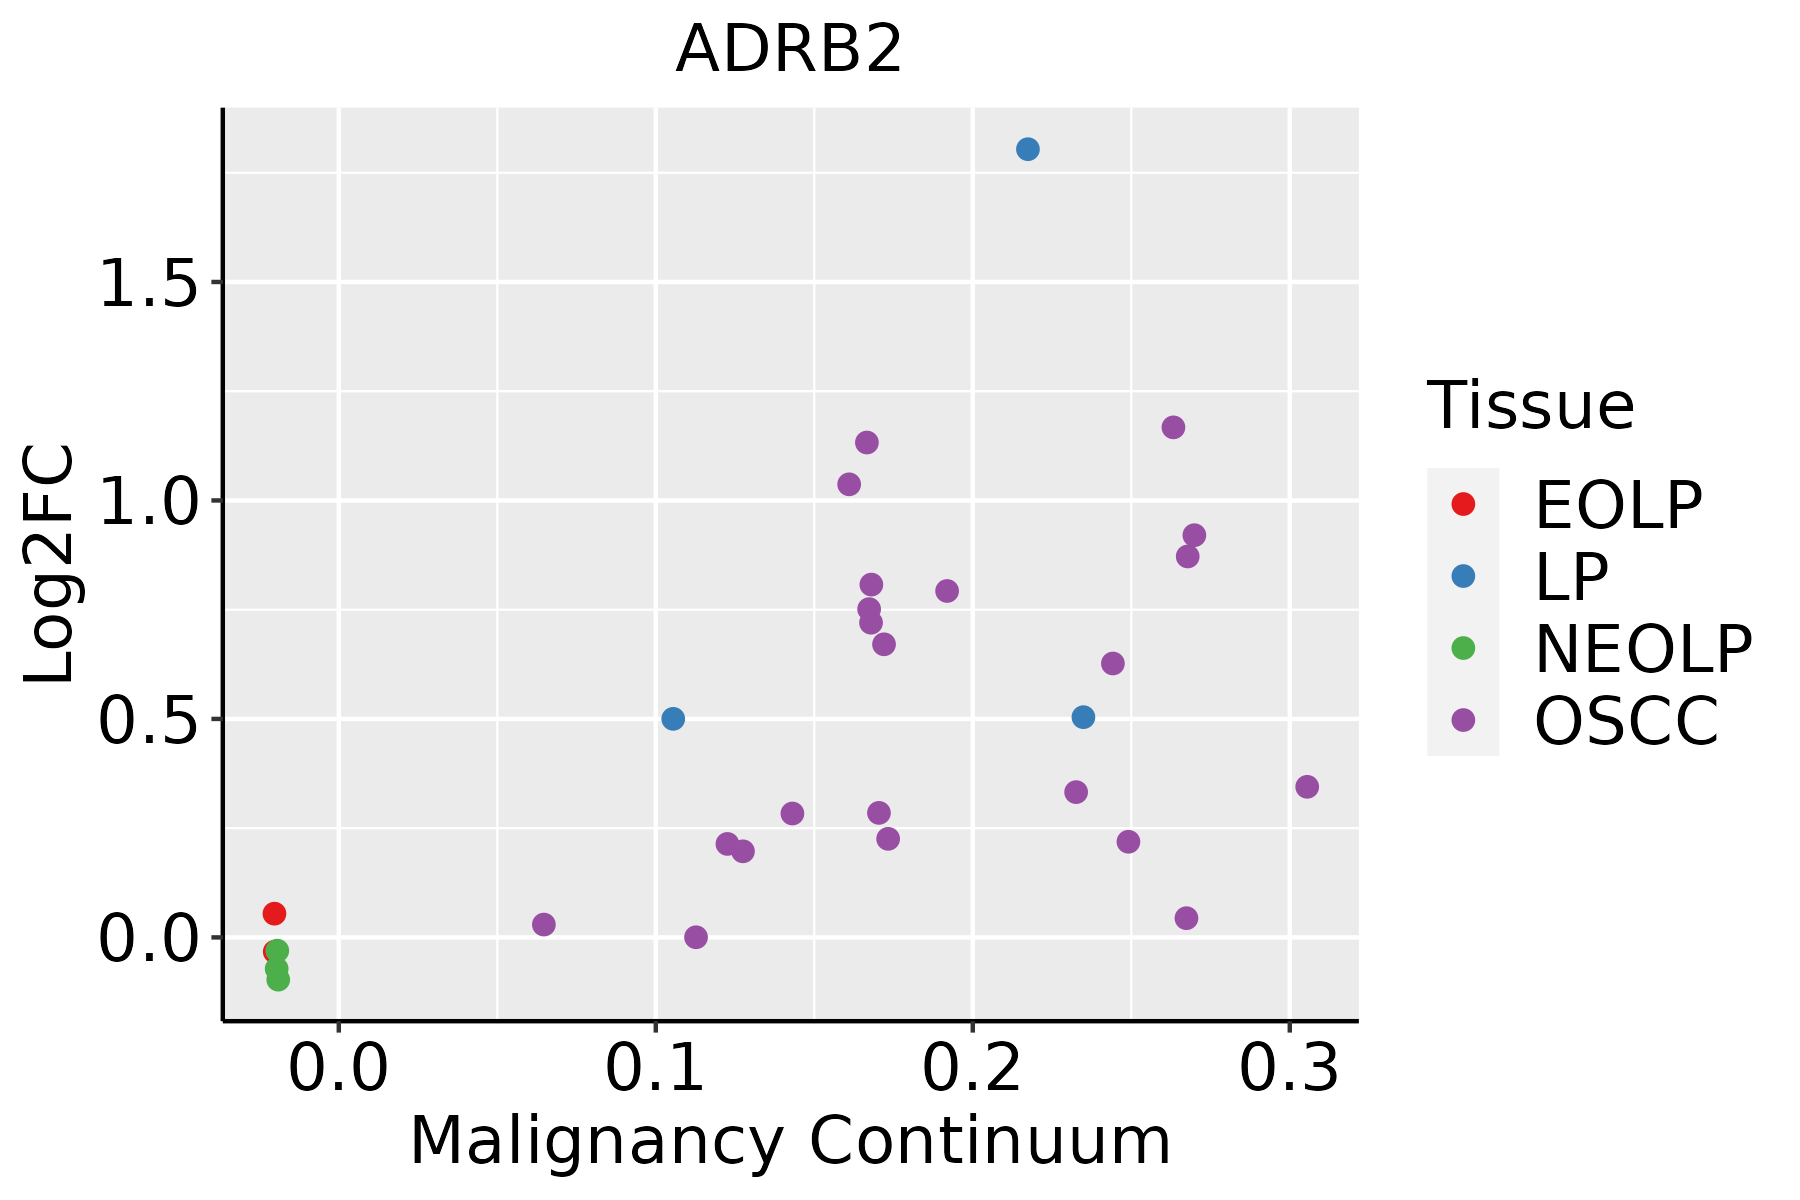 | EOLP: Erosive Oral lichen planus |
| LP: leukoplakia | ||
| NEOLP: Non-erosive oral lichen planus | ||
| OSCC: Oral squamous cell carcinoma | ||
| Skin | 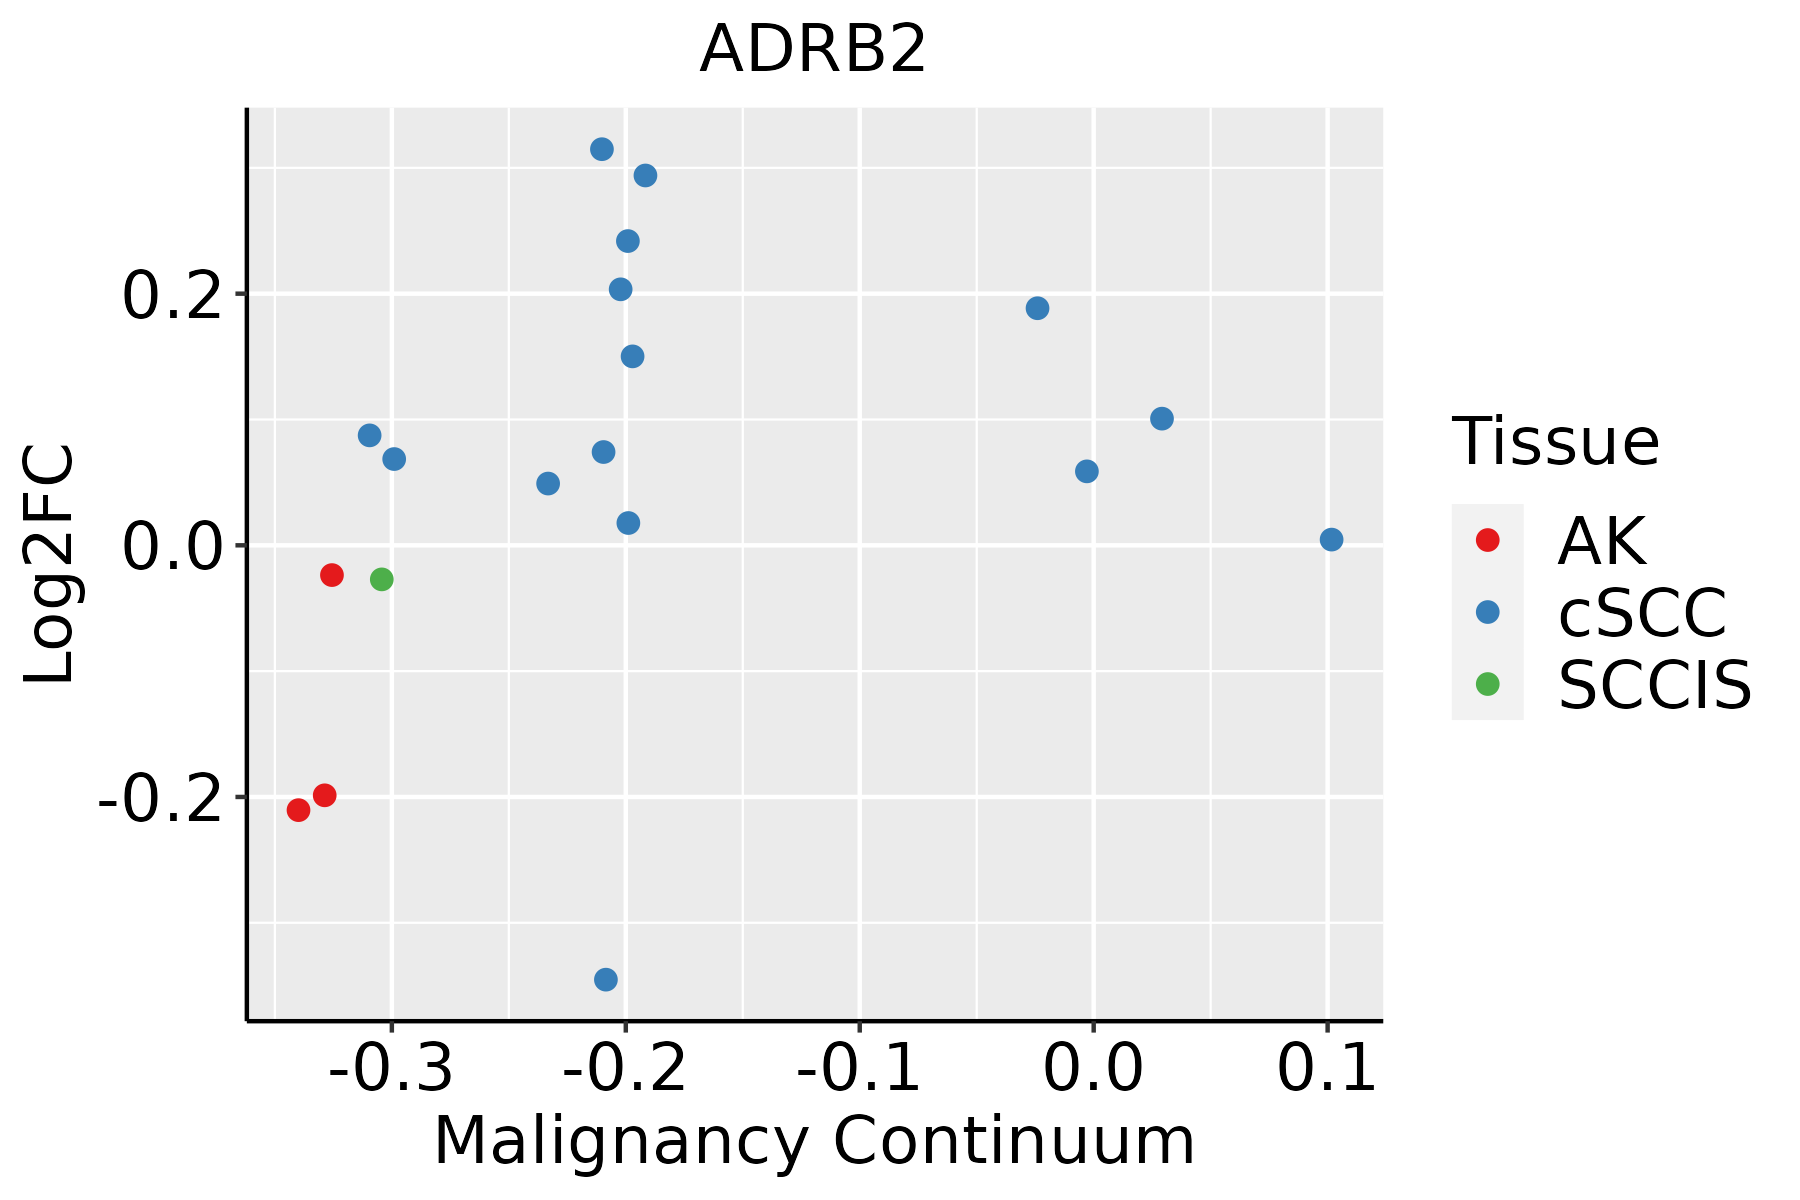 | AK: Actinic keratosis |
| cSCC: Cutaneous squamous cell carcinoma | ||
| SCCIS:squamous cell carcinoma in situ |
| ∗log2FC in expression of this searched gene in stem-like cells from each diseased tissue sample relative to stem-like cells in normal samples in each tissue plotted against the malignancy continuum. Samples are colored based on if they are from different disease stage. |
Top |
Malignant transformation related pathway analysis |
| Find out the enriched GO biological processes and KEGG pathways involved in transition from healthy to precancer to cancer |
| Tissue | Disease Stage | Enriched GO biological Processes |
| Colorectum | AD |  |
| Colorectum | SER |  |
| Colorectum | MSS |  |
| Colorectum | MSI-H |  |
| Colorectum | FAP |  |
| ∗Top 15 enriched GO BP terms are showed in the bar plot of each disease state in each tissue. Each row represents a significant GO biological process which is colored according to the -log10(p.adjust). |
| Page: 1 2 3 4 5 6 7 8 9 |
| GO ID | Tissue | Disease Stage | Description | Gene Ratio | Bg Ratio | pvalue | p.adjust | Count |
| GO:00162417 | Oral cavity | OSCC | regulation of macroautophagy | 96/7305 | 141/18723 | 2.33e-12 | 9.75e-11 | 96 |
| GO:000703410 | Oral cavity | OSCC | vacuolar transport | 103/7305 | 157/18723 | 1.25e-11 | 4.44e-10 | 103 |
| GO:003298410 | Oral cavity | OSCC | protein-containing complex disassembly | 136/7305 | 224/18723 | 3.42e-11 | 1.13e-09 | 136 |
| GO:007190010 | Oral cavity | OSCC | regulation of protein serine/threonine kinase activity | 201/7305 | 359/18723 | 3.90e-11 | 1.27e-09 | 201 |
| GO:004339318 | Oral cavity | OSCC | regulation of protein binding | 121/7305 | 196/18723 | 8.92e-11 | 2.73e-09 | 121 |
| GO:190165316 | Oral cavity | OSCC | cellular response to peptide | 194/7305 | 359/18723 | 4.31e-09 | 9.57e-08 | 194 |
| GO:003166720 | Oral cavity | OSCC | response to nutrient levels | 245/7305 | 474/18723 | 1.02e-08 | 2.10e-07 | 245 |
| GO:00105087 | Oral cavity | OSCC | positive regulation of autophagy | 77/7305 | 124/18723 | 1.59e-07 | 2.61e-06 | 77 |
| GO:00459266 | Oral cavity | OSCC | negative regulation of growth | 135/7305 | 249/18723 | 7.29e-07 | 1.03e-05 | 135 |
| GO:00070418 | Oral cavity | OSCC | lysosomal transport | 69/7305 | 114/18723 | 2.62e-06 | 3.26e-05 | 69 |
| GO:004586016 | Oral cavity | OSCC | positive regulation of protein kinase activity | 194/7305 | 386/18723 | 3.90e-06 | 4.59e-05 | 194 |
| GO:000150310 | Oral cavity | OSCC | ossification | 203/7305 | 408/18723 | 5.54e-06 | 6.19e-05 | 203 |
| GO:003367418 | Oral cavity | OSCC | positive regulation of kinase activity | 228/7305 | 467/18723 | 8.31e-06 | 8.90e-05 | 228 |
| GO:000926616 | Oral cavity | OSCC | response to temperature stimulus | 98/7305 | 178/18723 | 9.78e-06 | 1.03e-04 | 98 |
| GO:00619127 | Oral cavity | OSCC | selective autophagy | 44/7305 | 68/18723 | 1.57e-05 | 1.57e-04 | 44 |
| GO:00320919 | Oral cavity | OSCC | negative regulation of protein binding | 57/7305 | 94/18723 | 1.75e-05 | 1.71e-04 | 57 |
| GO:00719028 | Oral cavity | OSCC | positive regulation of protein serine/threonine kinase activity | 107/7305 | 200/18723 | 2.12e-05 | 2.02e-04 | 107 |
| GO:00454448 | Oral cavity | OSCC | fat cell differentiation | 120/7305 | 229/18723 | 2.48e-05 | 2.32e-04 | 120 |
| GO:000689810 | Oral cavity | OSCC | receptor-mediated endocytosis | 125/7305 | 244/18723 | 6.56e-05 | 5.32e-04 | 125 |
| GO:00973522 | Oral cavity | OSCC | autophagosome maturation | 28/7305 | 40/18723 | 7.00e-05 | 5.60e-04 | 28 |
| Page: 1 2 3 4 5 6 |
| Pathway ID | Tissue | Disease Stage | Description | Gene Ratio | Bg Ratio | pvalue | p.adjust | qvalue | Count |
| Page: 1 |
Top |
Cell-cell communication analysis |
| Identification of potential cell-cell interactions between two cell types and their ligand-receptor pairs for different disease states |
| Ligand | Receptor | LRpair | Pathway | Tissue | Disease Stage |
| Page: 1 |
Top |
Single-cell gene regulatory network inference analysis |
| Find out the significant the regulons (TFs) and the target genes of each regulon across cell types for different disease states |
| TF | Cell Type | Tissue | Disease Stage | Target Gene | RSS | Regulon Activity |
| ∗The dot plots of a searched regulon are shown for all cell subpopulations in each disease state of each tissue based on the regulon specific score inferred using pySCENIC and by calculating the average expression. |
| Page: 1 |
Top |
Somatic mutation of malignant transformation related genes |
| Annotation of somatic variants for genes involved in malignant transformation |
| Hugo Symbol | Variant Class | Variant Classification | dbSNP RS | HGVSc | HGVSp | HGVSp Short | SWISSPROT | BIOTYPE | SIFT | PolyPhen | Tumor Sample Barcode | Tissue | Histology | Sex | Age | Stage | Therapy Types | Drugs | Outcome |
| ADRB2 | SNV | Missense_Mutation | novel | c.312N>A | p.Phe104Leu | p.F104L | P07550 | protein_coding | tolerated(0.06) | benign(0.086) | TCGA-AN-A046-01 | Breast | breast invasive carcinoma | Female | >=65 | I/II | Unknown | Unknown | SD |
| ADRB2 | SNV | Missense_Mutation | c.88G>A | p.Glu30Lys | p.E30K | P07550 | protein_coding | tolerated(0.08) | benign(0.005) | TCGA-C8-A275-01 | Breast | breast invasive carcinoma | Female | <65 | I/II | Unknown | Unknown | SD | |
| ADRB2 | insertion | Frame_Shift_Ins | novel | c.761_762insT | p.His256AlafsTer38 | p.H256Afs*38 | P07550 | protein_coding | TCGA-A8-A07O-01 | Breast | breast invasive carcinoma | Female | <65 | I/II | Chemotherapy | CR | |||
| ADRB2 | insertion | Nonsense_Mutation | novel | c.766_767insCGCCCATATTCTTATGAAAATGTGGACTTTTGGC | p.His256ProfsTer6 | p.H256Pfs*6 | P07550 | protein_coding | TCGA-A8-A07O-01 | Breast | breast invasive carcinoma | Female | <65 | I/II | Chemotherapy | CR | |||
| ADRB2 | SNV | Missense_Mutation | c.136N>A | p.Ala46Thr | p.A46T | P07550 | protein_coding | tolerated(0.28) | benign(0.005) | TCGA-EA-A5O9-01 | Cervix | cervical & endocervical cancer | Female | <65 | I/II | Unknown | Unknown | SD | |
| ADRB2 | insertion | Frame_Shift_Ins | novel | c.270_271insT | p.Ala91CysfsTer23 | p.A91Cfs*23 | P07550 | protein_coding | TCGA-DS-A1OC-01 | Cervix | cervical & endocervical cancer | Female | <65 | I/II | Chemotherapy | gemcitabine | SD | ||
| ADRB2 | SNV | Missense_Mutation | novel | c.324N>G | p.Phe108Leu | p.F108L | P07550 | protein_coding | tolerated(0.71) | benign(0.02) | TCGA-CA-6717-01 | Colorectum | colon adenocarcinoma | Male | <65 | I/II | Chemotherapy | oxaliplatin | CR |
| ADRB2 | SNV | Missense_Mutation | c.355N>A | p.Ala119Thr | p.A119T | P07550 | protein_coding | deleterious(0) | probably_damaging(0.999) | TCGA-CK-5913-01 | Colorectum | colon adenocarcinoma | Female | <65 | I/II | Unknown | Unknown | SD | |
| ADRB2 | SNV | Missense_Mutation | c.905T>C | p.Leu302Pro | p.L302P | P07550 | protein_coding | deleterious(0.03) | possibly_damaging(0.848) | TCGA-F4-6570-01 | Colorectum | colon adenocarcinoma | Female | >=65 | I/II | Unknown | Unknown | SD | |
| ADRB2 | SNV | Missense_Mutation | c.1027N>T | p.Arg343Cys | p.R343C | P07550 | protein_coding | deleterious(0.05) | benign(0.038) | TCGA-G4-6304-01 | Colorectum | colon adenocarcinoma | Female | >=65 | I/II | Chemotherapy | fluorouracil | PD |
| Page: 1 2 3 4 5 6 |
Top |
Related drugs of malignant transformation related genes |
| Identification of chemicals and drugs interact with genes involved in malignant transfromation |
| (DGIdb 4.0) |
| Entrez ID | Symbol | Category | Interaction Types | Drug Claim Name | Drug Name | PMIDs |
| 154 | ADRB2 | KINASE, G PROTEIN COUPLED RECEPTOR, DRUGGABLE GENOME, EXTERNAL SIDE OF PLASMA MEMBRANE | ALPRENOLOL | ALPRENOLOL | ||
| 154 | ADRB2 | KINASE, G PROTEIN COUPLED RECEPTOR, DRUGGABLE GENOME, EXTERNAL SIDE OF PLASMA MEMBRANE | antagonist | 135650031 | LEVOBUNOLOL | |
| 154 | ADRB2 | KINASE, G PROTEIN COUPLED RECEPTOR, DRUGGABLE GENOME, EXTERNAL SIDE OF PLASMA MEMBRANE | agonist | 187051758 | INDACATEROL | |
| 154 | ADRB2 | KINASE, G PROTEIN COUPLED RECEPTOR, DRUGGABLE GENOME, EXTERNAL SIDE OF PLASMA MEMBRANE | agonist | 329968451 | SOLABEGRON | |
| 154 | ADRB2 | KINASE, G PROTEIN COUPLED RECEPTOR, DRUGGABLE GENOME, EXTERNAL SIDE OF PLASMA MEMBRANE | agonist | CHEMBL1200447 | ||
| 154 | ADRB2 | KINASE, G PROTEIN COUPLED RECEPTOR, DRUGGABLE GENOME, EXTERNAL SIDE OF PLASMA MEMBRANE | TA-2005 | CARMOTEROL | ||
| 154 | ADRB2 | KINASE, G PROTEIN COUPLED RECEPTOR, DRUGGABLE GENOME, EXTERNAL SIDE OF PLASMA MEMBRANE | agonist | 135650978 | SALMETEROL | |
| 154 | ADRB2 | KINASE, G PROTEIN COUPLED RECEPTOR, DRUGGABLE GENOME, EXTERNAL SIDE OF PLASMA MEMBRANE | QVA-149 | |||
| 154 | ADRB2 | KINASE, G PROTEIN COUPLED RECEPTOR, DRUGGABLE GENOME, EXTERNAL SIDE OF PLASMA MEMBRANE | agonist | CHEMBL2062258 | ||
| 154 | ADRB2 | KINASE, G PROTEIN COUPLED RECEPTOR, DRUGGABLE GENOME, EXTERNAL SIDE OF PLASMA MEMBRANE | agonist | CHEMBL1200920 | ISOETHARINE HYDROCHLORIDE |
| Page: 1 2 3 4 5 6 7 8 9 10 11 12 13 14 15 16 17 18 19 20 21 22 23 24 25 26 27 28 29 |

Copyright 2023-Present -The University of Texas Health Science Center at Houston |