
|
|||||
|
 | |
| |
| |
| |
| |
| |
|
Gene: ACOT8 |
Gene summary for ACOT8 |
| Gene information | Species | Human | Gene symbol | ACOT8 | Gene ID | 10005 |
| Gene name | acyl-CoA thioesterase 8 | |
| Gene Alias | HNAACTE | |
| Cytomap | 20q13.12 | |
| Gene Type | protein-coding | GO ID | GO:0001676 | UniProtAcc | O14734 |
Top |
Malignant transformation analysis |
| Identification of the aberrant gene expression in precancerous and cancerous lesions by comparing the gene expression of stem-like cells in diseased tissues with normal stem cells |
| Entrez ID | Symbol | Replicates | Species | Organ | Tissue | Adj P-value | Log2FC | Malignancy |
| 10005 | ACOT8 | LZE4T | Human | Esophagus | ESCC | 1.10e-04 | 2.61e-01 | 0.0811 |
| 10005 | ACOT8 | LZE7T | Human | Esophagus | ESCC | 8.78e-04 | 3.93e-01 | 0.0667 |
| 10005 | ACOT8 | LZE20T | Human | Esophagus | ESCC | 5.52e-06 | 3.80e-01 | 0.0662 |
| 10005 | ACOT8 | LZE24T | Human | Esophagus | ESCC | 6.28e-16 | 4.69e-01 | 0.0596 |
| 10005 | ACOT8 | LZE6T | Human | Esophagus | ESCC | 9.29e-05 | 2.88e-01 | 0.0845 |
| 10005 | ACOT8 | P1T-E | Human | Esophagus | ESCC | 4.61e-02 | 3.27e-01 | 0.0875 |
| 10005 | ACOT8 | P2T-E | Human | Esophagus | ESCC | 9.67e-18 | 2.82e-01 | 0.1177 |
| 10005 | ACOT8 | P4T-E | Human | Esophagus | ESCC | 5.81e-23 | 6.53e-01 | 0.1323 |
| 10005 | ACOT8 | P5T-E | Human | Esophagus | ESCC | 4.29e-11 | 2.35e-01 | 0.1327 |
| 10005 | ACOT8 | P8T-E | Human | Esophagus | ESCC | 2.39e-24 | 3.68e-01 | 0.0889 |
| 10005 | ACOT8 | P9T-E | Human | Esophagus | ESCC | 1.35e-04 | 1.77e-01 | 0.1131 |
| 10005 | ACOT8 | P10T-E | Human | Esophagus | ESCC | 6.76e-36 | 5.65e-01 | 0.116 |
| 10005 | ACOT8 | P11T-E | Human | Esophagus | ESCC | 1.54e-10 | 4.15e-01 | 0.1426 |
| 10005 | ACOT8 | P12T-E | Human | Esophagus | ESCC | 1.02e-31 | 4.29e-01 | 0.1122 |
| 10005 | ACOT8 | P15T-E | Human | Esophagus | ESCC | 1.37e-11 | 3.28e-01 | 0.1149 |
| 10005 | ACOT8 | P16T-E | Human | Esophagus | ESCC | 2.45e-28 | 4.37e-01 | 0.1153 |
| 10005 | ACOT8 | P17T-E | Human | Esophagus | ESCC | 4.13e-06 | 3.77e-01 | 0.1278 |
| 10005 | ACOT8 | P19T-E | Human | Esophagus | ESCC | 6.74e-09 | 5.60e-01 | 0.1662 |
| 10005 | ACOT8 | P20T-E | Human | Esophagus | ESCC | 1.04e-25 | 6.06e-01 | 0.1124 |
| 10005 | ACOT8 | P21T-E | Human | Esophagus | ESCC | 2.40e-66 | 1.13e+00 | 0.1617 |
| Page: 1 2 3 4 5 |
| Tissue | Expression Dynamics | Abbreviation |
| Esophagus | 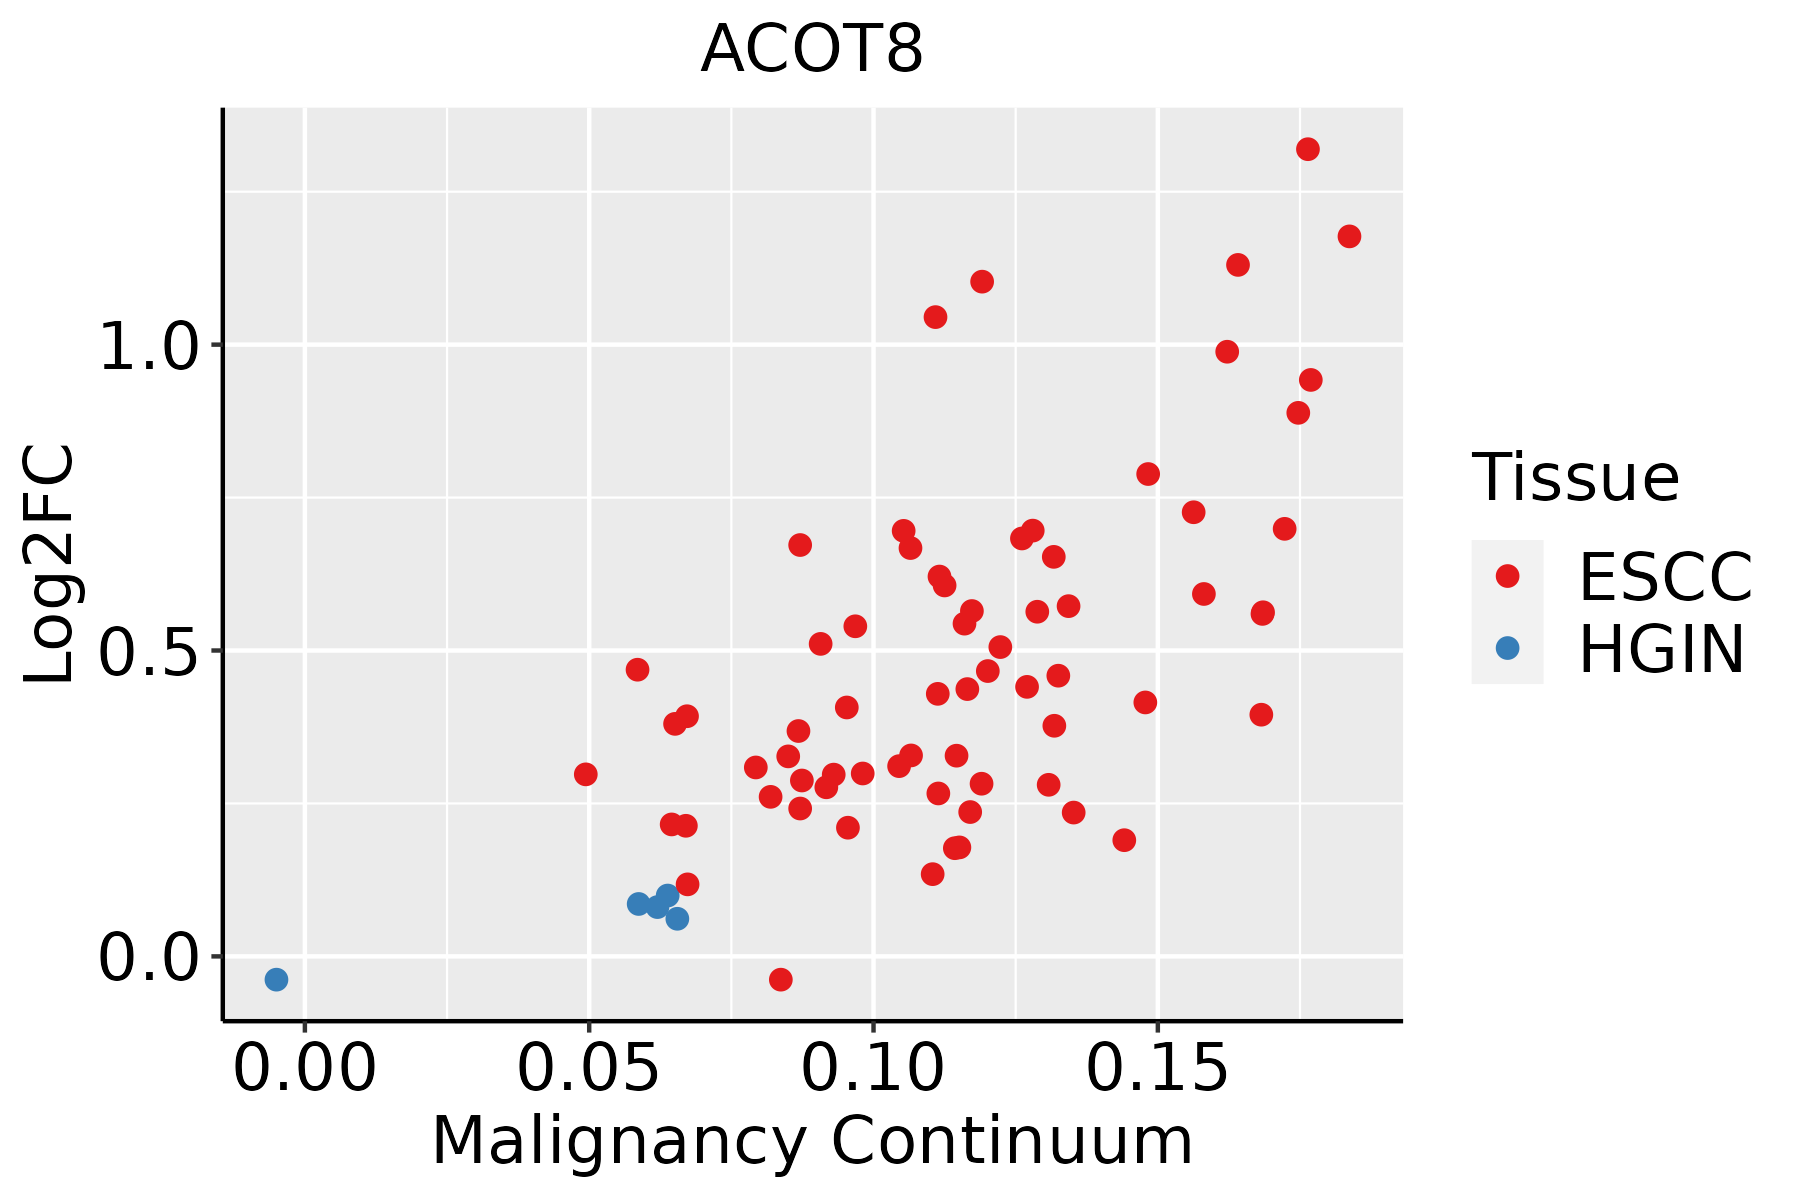 | ESCC: Esophageal squamous cell carcinoma |
| HGIN: High-grade intraepithelial neoplasias | ||
| LGIN: Low-grade intraepithelial neoplasias | ||
| Liver | 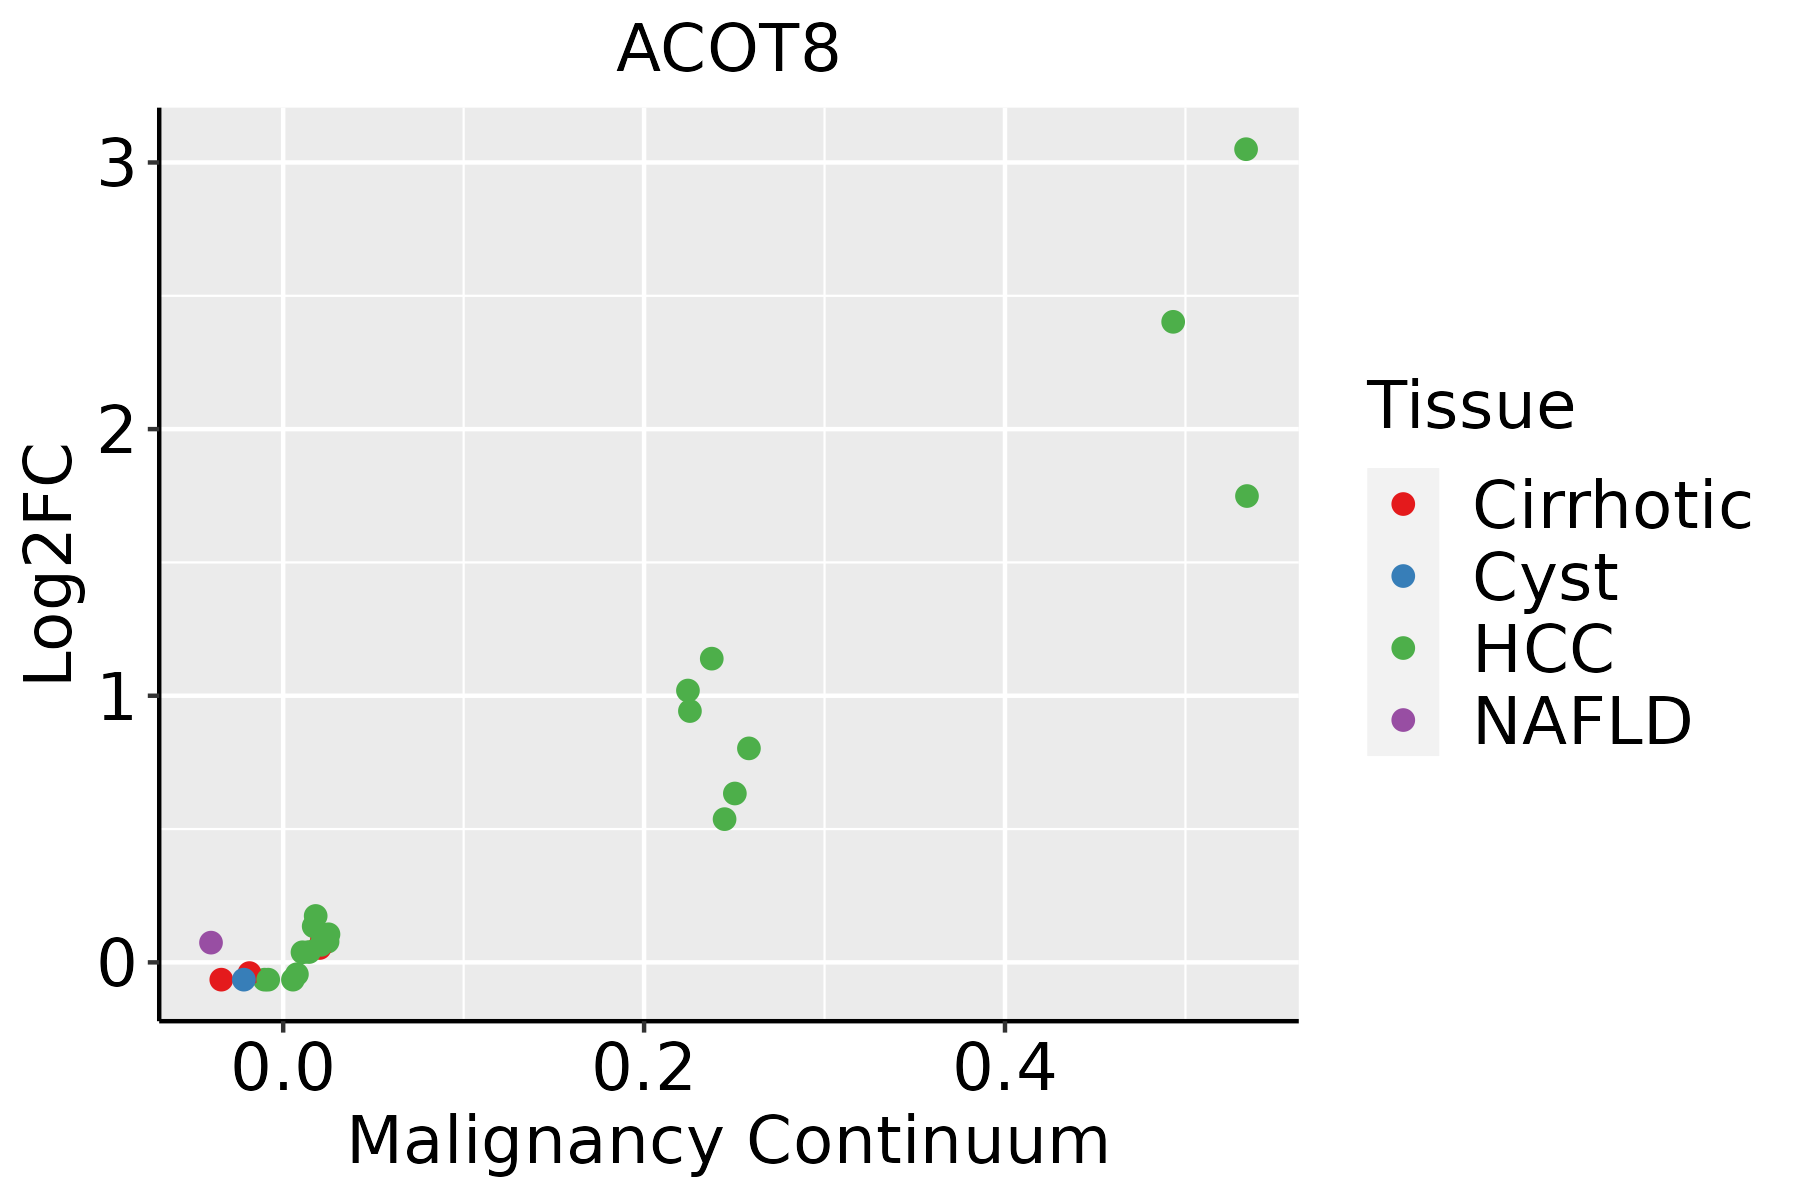 | HCC: Hepatocellular carcinoma |
| NAFLD: Non-alcoholic fatty liver disease | ||
| Oral Cavity | 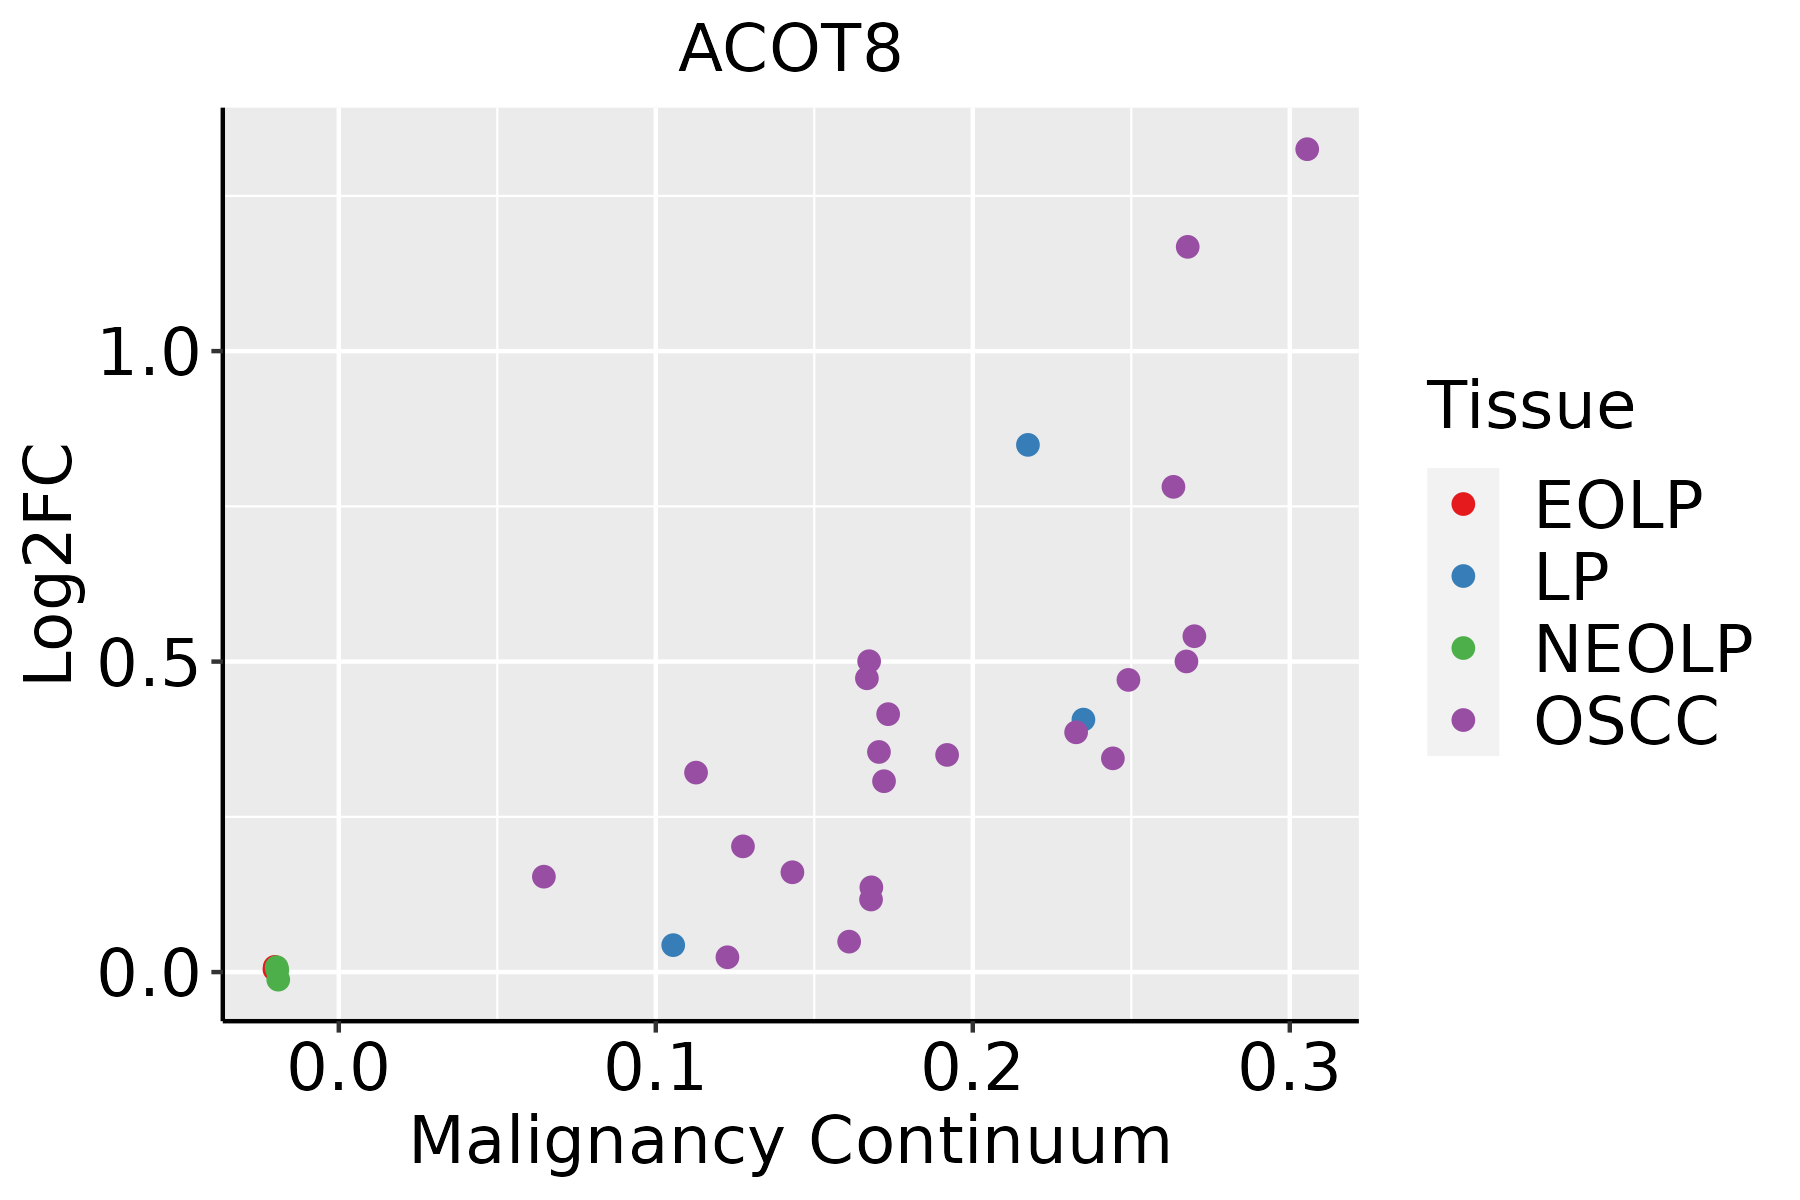 | EOLP: Erosive Oral lichen planus |
| LP: leukoplakia | ||
| NEOLP: Non-erosive oral lichen planus | ||
| OSCC: Oral squamous cell carcinoma | ||
| Skin | 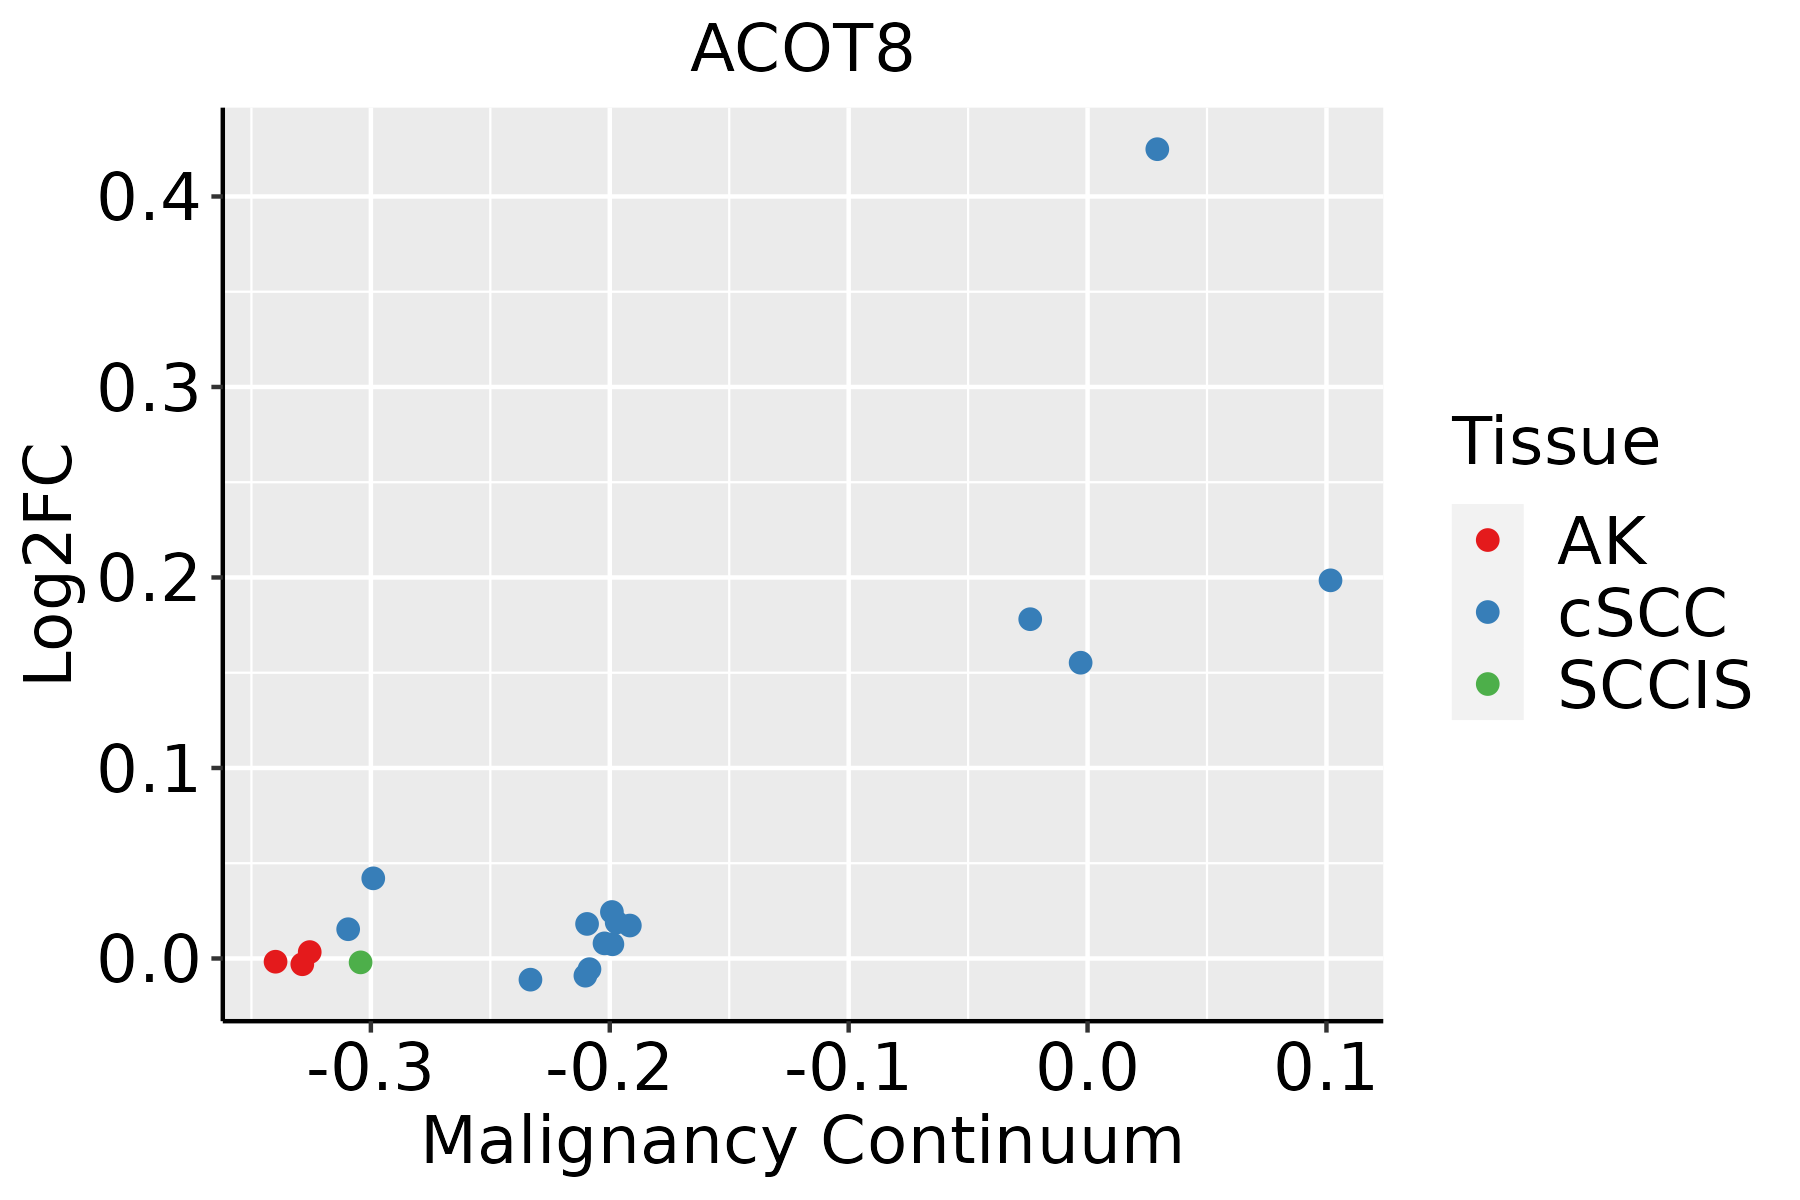 | AK: Actinic keratosis |
| cSCC: Cutaneous squamous cell carcinoma | ||
| SCCIS:squamous cell carcinoma in situ |
| ∗log2FC in expression of this searched gene in stem-like cells from each diseased tissue sample relative to stem-like cells in normal samples in each tissue plotted against the malignancy continuum. Samples are colored based on if they are from different disease stage. |
Top |
Malignant transformation related pathway analysis |
| Find out the enriched GO biological processes and KEGG pathways involved in transition from healthy to precancer to cancer |
| Tissue | Disease Stage | Enriched GO biological Processes |
| Colorectum | AD |  |
| Colorectum | SER |  |
| Colorectum | MSS |  |
| Colorectum | MSI-H |  |
| Colorectum | FAP |  |
| ∗Top 15 enriched GO BP terms are showed in the bar plot of each disease state in each tissue. Each row represents a significant GO biological process which is colored according to the -log10(p.adjust). |
| Page: 1 2 3 4 5 6 7 8 9 |
| GO ID | Tissue | Disease Stage | Description | Gene Ratio | Bg Ratio | pvalue | p.adjust | Count |
| GO:007252122 | Liver | HCC | purine-containing compound metabolic process | 250/7958 | 416/18723 | 2.26e-13 | 1.24e-11 | 250 |
| GO:000616322 | Liver | HCC | purine nucleotide metabolic process | 236/7958 | 396/18723 | 3.59e-12 | 1.62e-10 | 236 |
| GO:004428221 | Liver | HCC | small molecule catabolic process | 225/7958 | 376/18723 | 6.50e-12 | 2.80e-10 | 225 |
| GO:001605421 | Liver | HCC | organic acid catabolic process | 152/7958 | 240/18723 | 5.11e-11 | 1.92e-09 | 152 |
| GO:00463952 | Liver | HCC | carboxylic acid catabolic process | 149/7958 | 236/18723 | 1.11e-10 | 3.87e-09 | 149 |
| GO:00338652 | Liver | HCC | nucleoside bisphosphate metabolic process | 88/7958 | 128/18723 | 1.63e-09 | 4.78e-08 | 88 |
| GO:00338752 | Liver | HCC | ribonucleoside bisphosphate metabolic process | 88/7958 | 128/18723 | 1.63e-09 | 4.78e-08 | 88 |
| GO:00340322 | Liver | HCC | purine nucleoside bisphosphate metabolic process | 88/7958 | 128/18723 | 1.63e-09 | 4.78e-08 | 88 |
| GO:00082022 | Liver | HCC | steroid metabolic process | 188/7958 | 319/18723 | 1.96e-09 | 5.63e-08 | 188 |
| GO:004424222 | Liver | HCC | cellular lipid catabolic process | 134/7958 | 214/18723 | 2.07e-09 | 5.79e-08 | 134 |
| GO:001939522 | Liver | HCC | fatty acid oxidation | 72/7958 | 103/18723 | 1.63e-08 | 3.92e-07 | 72 |
| GO:00436482 | Liver | HCC | dicarboxylic acid metabolic process | 68/7958 | 96/18723 | 1.73e-08 | 4.14e-07 | 68 |
| GO:000906221 | Liver | HCC | fatty acid catabolic process | 70/7958 | 100/18723 | 2.34e-08 | 5.44e-07 | 70 |
| GO:00066372 | Liver | HCC | acyl-CoA metabolic process | 67/7958 | 96/18723 | 5.62e-08 | 1.19e-06 | 67 |
| GO:00353832 | Liver | HCC | thioester metabolic process | 67/7958 | 96/18723 | 5.62e-08 | 1.19e-06 | 67 |
| GO:007233021 | Liver | HCC | monocarboxylic acid biosynthetic process | 129/7958 | 214/18723 | 1.08e-07 | 2.09e-06 | 129 |
| GO:003444021 | Liver | HCC | lipid oxidation | 73/7958 | 108/18723 | 1.17e-07 | 2.25e-06 | 73 |
| GO:007232921 | Liver | HCC | monocarboxylic acid catabolic process | 80/7958 | 122/18723 | 2.18e-07 | 3.91e-06 | 80 |
| GO:000663521 | Liver | HCC | fatty acid beta-oxidation | 52/7958 | 74/18723 | 1.22e-06 | 1.80e-05 | 52 |
| GO:00066942 | Liver | HCC | steroid biosynthetic process | 104/7958 | 173/18723 | 2.13e-06 | 2.91e-05 | 104 |
| Page: 1 2 3 4 5 6 7 |
| Pathway ID | Tissue | Disease Stage | Description | Gene Ratio | Bg Ratio | pvalue | p.adjust | qvalue | Count |
| hsa041467 | Esophagus | ESCC | Peroxisome | 55/4205 | 82/8465 | 1.04e-03 | 3.27e-03 | 1.68e-03 | 55 |
| hsa0414612 | Esophagus | ESCC | Peroxisome | 55/4205 | 82/8465 | 1.04e-03 | 3.27e-03 | 1.68e-03 | 55 |
| hsa041464 | Liver | HCC | Peroxisome | 58/4020 | 82/8465 | 1.57e-05 | 1.05e-04 | 5.85e-05 | 58 |
| hsa001202 | Liver | HCC | Primary bile acid biosynthesis | 14/4020 | 17/8465 | 3.49e-03 | 1.12e-02 | 6.22e-03 | 14 |
| hsa041465 | Liver | HCC | Peroxisome | 58/4020 | 82/8465 | 1.57e-05 | 1.05e-04 | 5.85e-05 | 58 |
| hsa001203 | Liver | HCC | Primary bile acid biosynthesis | 14/4020 | 17/8465 | 3.49e-03 | 1.12e-02 | 6.22e-03 | 14 |
| hsa041466 | Oral cavity | OSCC | Peroxisome | 47/3704 | 82/8465 | 9.01e-03 | 2.01e-02 | 1.03e-02 | 47 |
| hsa0414611 | Oral cavity | OSCC | Peroxisome | 47/3704 | 82/8465 | 9.01e-03 | 2.01e-02 | 1.03e-02 | 47 |
| hsa0414621 | Oral cavity | LP | Peroxisome | 33/2418 | 82/8465 | 1.48e-02 | 4.69e-02 | 3.03e-02 | 33 |
| hsa0414631 | Oral cavity | LP | Peroxisome | 33/2418 | 82/8465 | 1.48e-02 | 4.69e-02 | 3.03e-02 | 33 |
| Page: 1 |
Top |
Cell-cell communication analysis |
| Identification of potential cell-cell interactions between two cell types and their ligand-receptor pairs for different disease states |
| Ligand | Receptor | LRpair | Pathway | Tissue | Disease Stage |
| Page: 1 |
Top |
Single-cell gene regulatory network inference analysis |
| Find out the significant the regulons (TFs) and the target genes of each regulon across cell types for different disease states |
| TF | Cell Type | Tissue | Disease Stage | Target Gene | RSS | Regulon Activity |
| ∗The dot plots of a searched regulon are shown for all cell subpopulations in each disease state of each tissue based on the regulon specific score inferred using pySCENIC and by calculating the average expression. |
| Page: 1 |
Top |
Somatic mutation of malignant transformation related genes |
| Annotation of somatic variants for genes involved in malignant transformation |
| Hugo Symbol | Variant Class | Variant Classification | dbSNP RS | HGVSc | HGVSp | HGVSp Short | SWISSPROT | BIOTYPE | SIFT | PolyPhen | Tumor Sample Barcode | Tissue | Histology | Sex | Age | Stage | Therapy Types | Drugs | Outcome |
| ACOT8 | insertion | Frame_Shift_Ins | novel | c.284_285insC | p.Tyr96ValfsTer58 | p.Y96Vfs*58 | O14734 | protein_coding | TCGA-AQ-A04J-01 | Breast | breast invasive carcinoma | Female | <65 | I/II | Chemotherapy | cytoxan | SD | ||
| ACOT8 | insertion | Nonsense_Mutation | novel | c.282_283insATTTAAAAATAAGGCTGGGGCTGGGTGTGGGGG | p.Val94_Leu95insIleTerLysTerGlyTrpGlyTrpValTrpGly | p.V94_L95insI*K*GWGWVWG | O14734 | protein_coding | TCGA-AQ-A04J-01 | Breast | breast invasive carcinoma | Female | <65 | I/II | Chemotherapy | cytoxan | SD | ||
| ACOT8 | deletion | Frame_Shift_Del | novel | c.199delN | p.Ala67GlnfsTer5 | p.A67Qfs*5 | O14734 | protein_coding | TCGA-D8-A27V-01 | Breast | breast invasive carcinoma | Female | <65 | I/II | Hormone Therapy | tamoxiphen | SD | ||
| ACOT8 | SNV | Missense_Mutation | rs762380579 | c.797N>A | p.Arg266Gln | p.R266Q | O14734 | protein_coding | tolerated(0.05) | probably_damaging(0.999) | TCGA-DG-A2KJ-01 | Cervix | cervical & endocervical cancer | Female | <65 | III/IV | Chemotherapy | cisplatin | SD |
| ACOT8 | SNV | Missense_Mutation | c.103N>C | p.Glu35Gln | p.E35Q | O14734 | protein_coding | deleterious(0) | probably_damaging(0.931) | TCGA-EK-A2RK-01 | Cervix | cervical & endocervical cancer | Female | >=65 | I/II | Unknown | Unknown | SD | |
| ACOT8 | SNV | Missense_Mutation | rs536673262 | c.521C>T | p.Ala174Val | p.A174V | O14734 | protein_coding | tolerated(0.23) | benign(0.054) | TCGA-IR-A3LL-01 | Cervix | cervical & endocervical cancer | Female | <65 | I/II | Chemotherapy | cisplatin | CR |
| ACOT8 | SNV | Missense_Mutation | c.226N>T | p.His76Tyr | p.H76Y | O14734 | protein_coding | tolerated(0.62) | benign(0) | TCGA-AA-3955-01 | Colorectum | colon adenocarcinoma | Male | <65 | III/IV | Chemotherapy | capecitabine | CR | |
| ACOT8 | SNV | Missense_Mutation | novel | c.491A>G | p.Asp164Gly | p.D164G | O14734 | protein_coding | deleterious(0.03) | benign(0.248) | TCGA-AG-A00Y-01 | Colorectum | rectum adenocarcinoma | Male | >=65 | I/II | Unknown | Unknown | PD |
| ACOT8 | SNV | Missense_Mutation | rs536673262 | c.521N>T | p.Ala174Val | p.A174V | O14734 | protein_coding | tolerated(0.23) | benign(0.054) | TCGA-A5-A0G1-01 | Endometrium | uterine corpus endometrioid carcinoma | Female | >=65 | I/II | Unknown | Unknown | SD |
| ACOT8 | SNV | Missense_Mutation | rs747087835 | c.256N>T | p.Arg86Trp | p.R86W | O14734 | protein_coding | deleterious(0) | probably_damaging(0.998) | TCGA-AJ-A3BH-01 | Endometrium | uterine corpus endometrioid carcinoma | Female | Unknown | I/II | Unknown | Unknown | SD |
| Page: 1 2 3 |
Top |
Related drugs of malignant transformation related genes |
| Identification of chemicals and drugs interact with genes involved in malignant transfromation |
| (DGIdb 4.0) |
| Entrez ID | Symbol | Category | Interaction Types | Drug Claim Name | Drug Name | PMIDs |
| Page: 1 |

Copyright 2023-Present -The University of Texas Health Science Center at Houston |