
|
|||||
|
 | |
| |
| |
| |
| |
| |
|
Gene: ACOT11 |
Gene summary for ACOT11 |
| Gene information | Species | Human | Gene symbol | ACOT11 | Gene ID | 26027 |
| Gene name | acyl-CoA thioesterase 11 | |
| Gene Alias | BFIT | |
| Cytomap | 1p32.3 | |
| Gene Type | protein-coding | GO ID | GO:0001659 | UniProtAcc | Q8WXI4 |
Top |
Malignant transformation analysis |
| Identification of the aberrant gene expression in precancerous and cancerous lesions by comparing the gene expression of stem-like cells in diseased tissues with normal stem cells |
| Entrez ID | Symbol | Replicates | Species | Organ | Tissue | Adj P-value | Log2FC | Malignancy |
| 26027 | ACOT11 | HTA11_347_2000001011 | Human | Colorectum | AD | 9.37e-14 | 5.83e-01 | -0.1954 |
| 26027 | ACOT11 | HTA11_99999970781_79442 | Human | Colorectum | MSS | 2.82e-07 | -3.64e-01 | 0.294 |
| 26027 | ACOT11 | F007 | Human | Colorectum | FAP | 2.34e-03 | -4.02e-01 | 0.1176 |
| 26027 | ACOT11 | A002-C-010 | Human | Colorectum | FAP | 1.08e-04 | -2.67e-01 | 0.242 |
| 26027 | ACOT11 | A001-C-207 | Human | Colorectum | FAP | 4.98e-03 | -2.09e-01 | 0.1278 |
| 26027 | ACOT11 | A015-C-203 | Human | Colorectum | FAP | 1.09e-27 | -3.23e-01 | -0.1294 |
| 26027 | ACOT11 | A015-C-204 | Human | Colorectum | FAP | 1.57e-04 | -2.83e-01 | -0.0228 |
| 26027 | ACOT11 | A014-C-040 | Human | Colorectum | FAP | 8.75e-03 | -2.29e-01 | -0.1184 |
| 26027 | ACOT11 | A002-C-201 | Human | Colorectum | FAP | 4.20e-10 | -2.56e-01 | 0.0324 |
| 26027 | ACOT11 | A002-C-203 | Human | Colorectum | FAP | 2.96e-04 | -1.67e-01 | 0.2786 |
| 26027 | ACOT11 | A001-C-119 | Human | Colorectum | FAP | 2.56e-12 | -5.24e-01 | -0.1557 |
| 26027 | ACOT11 | A001-C-108 | Human | Colorectum | FAP | 8.32e-15 | -2.53e-01 | -0.0272 |
| 26027 | ACOT11 | A002-C-205 | Human | Colorectum | FAP | 6.88e-22 | -5.09e-01 | -0.1236 |
| 26027 | ACOT11 | A001-C-104 | Human | Colorectum | FAP | 1.10e-02 | -1.32e-01 | 0.0184 |
| 26027 | ACOT11 | A015-C-005 | Human | Colorectum | FAP | 1.21e-02 | -2.59e-01 | -0.0336 |
| 26027 | ACOT11 | A015-C-006 | Human | Colorectum | FAP | 5.49e-14 | -4.33e-01 | -0.0994 |
| 26027 | ACOT11 | A015-C-106 | Human | Colorectum | FAP | 3.44e-10 | -2.11e-01 | -0.0511 |
| 26027 | ACOT11 | A002-C-114 | Human | Colorectum | FAP | 2.50e-17 | -3.33e-01 | -0.1561 |
| 26027 | ACOT11 | A015-C-104 | Human | Colorectum | FAP | 8.83e-30 | -4.75e-01 | -0.1899 |
| 26027 | ACOT11 | A001-C-014 | Human | Colorectum | FAP | 2.34e-17 | -3.96e-01 | 0.0135 |
| Page: 1 2 3 |
| Tissue | Expression Dynamics | Abbreviation |
| Colorectum (GSE201348) |  | FAP: Familial adenomatous polyposis |
| CRC: Colorectal cancer | ||
| Colorectum (HTA11) |  | AD: Adenomas |
| SER: Sessile serrated lesions | ||
| MSI-H: Microsatellite-high colorectal cancer | ||
| MSS: Microsatellite stable colorectal cancer | ||
| Lung | 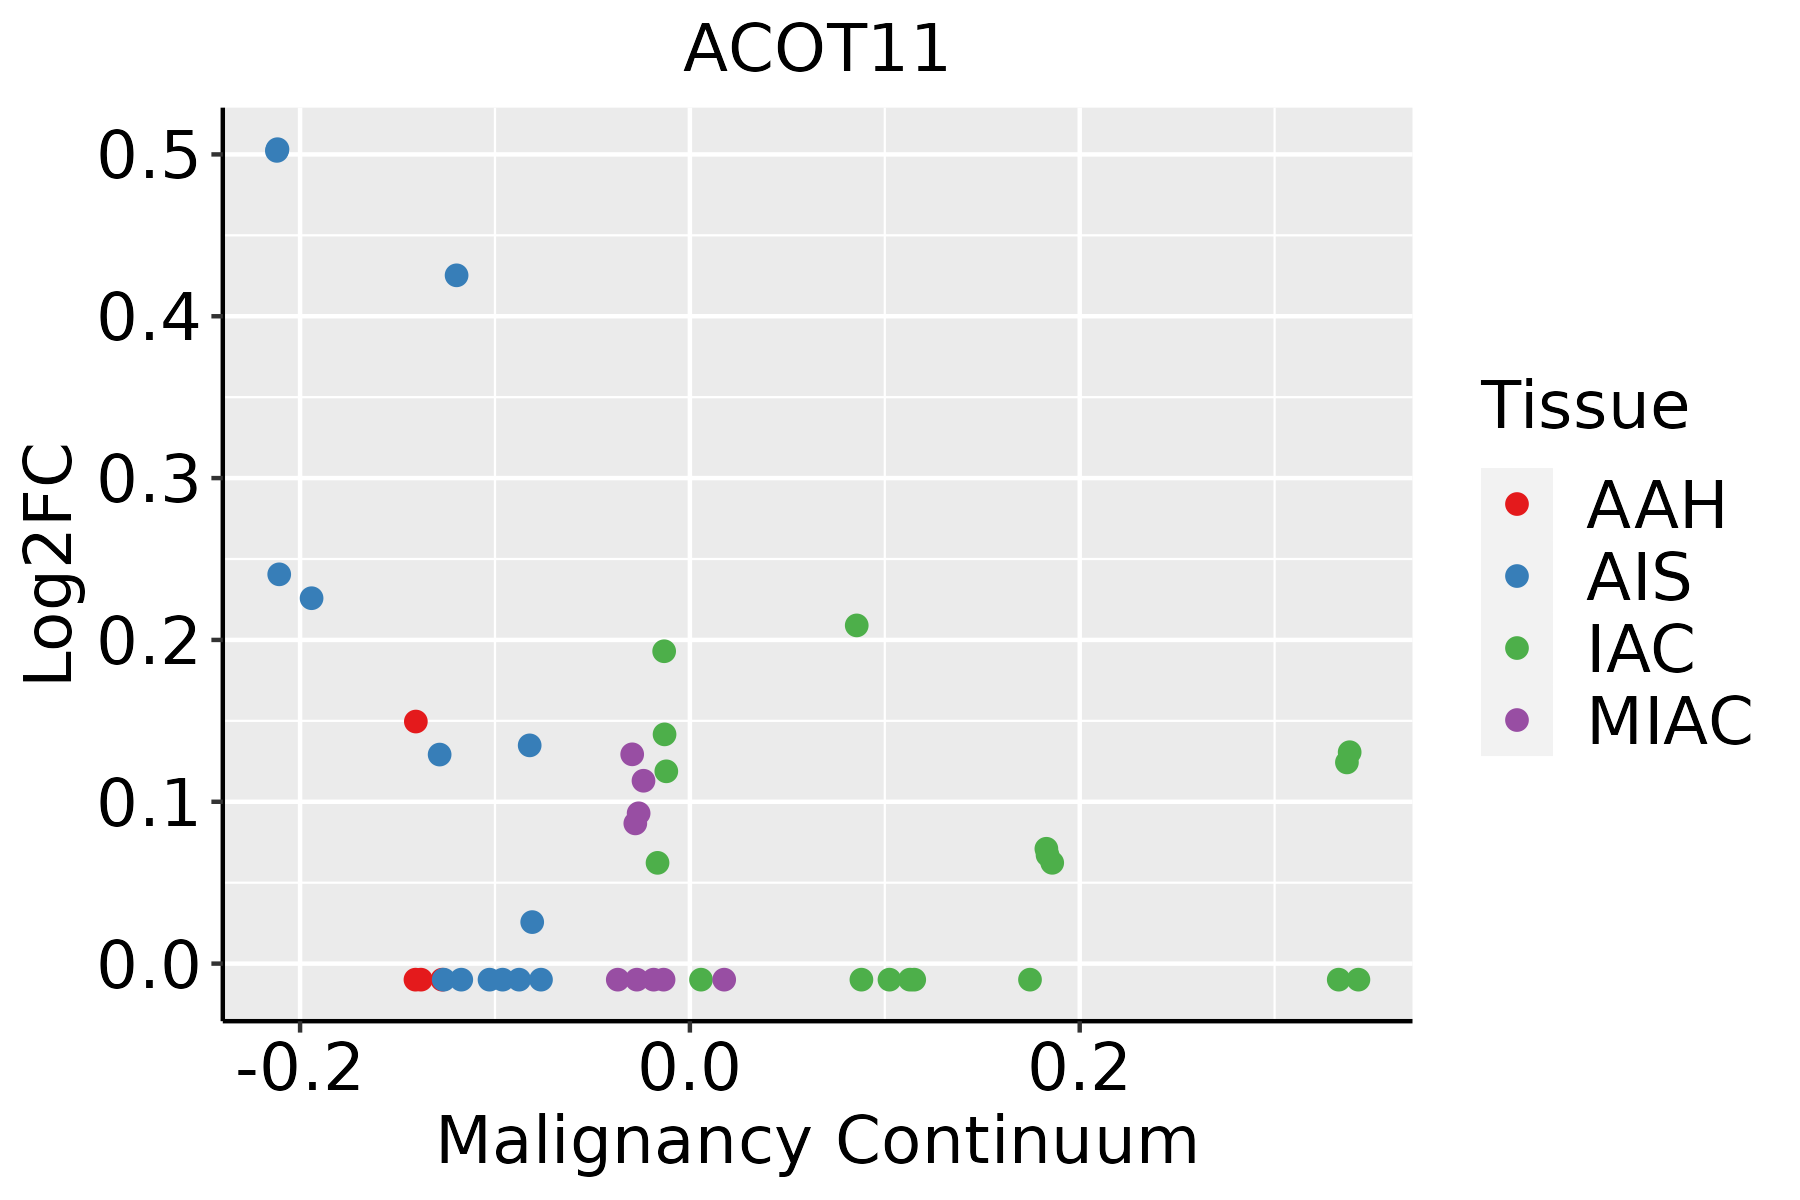 | AAH: Atypical adenomatous hyperplasia |
| AIS: Adenocarcinoma in situ | ||
| IAC: Invasive lung adenocarcinoma | ||
| MIA: Minimally invasive adenocarcinoma | ||
| Oral Cavity | 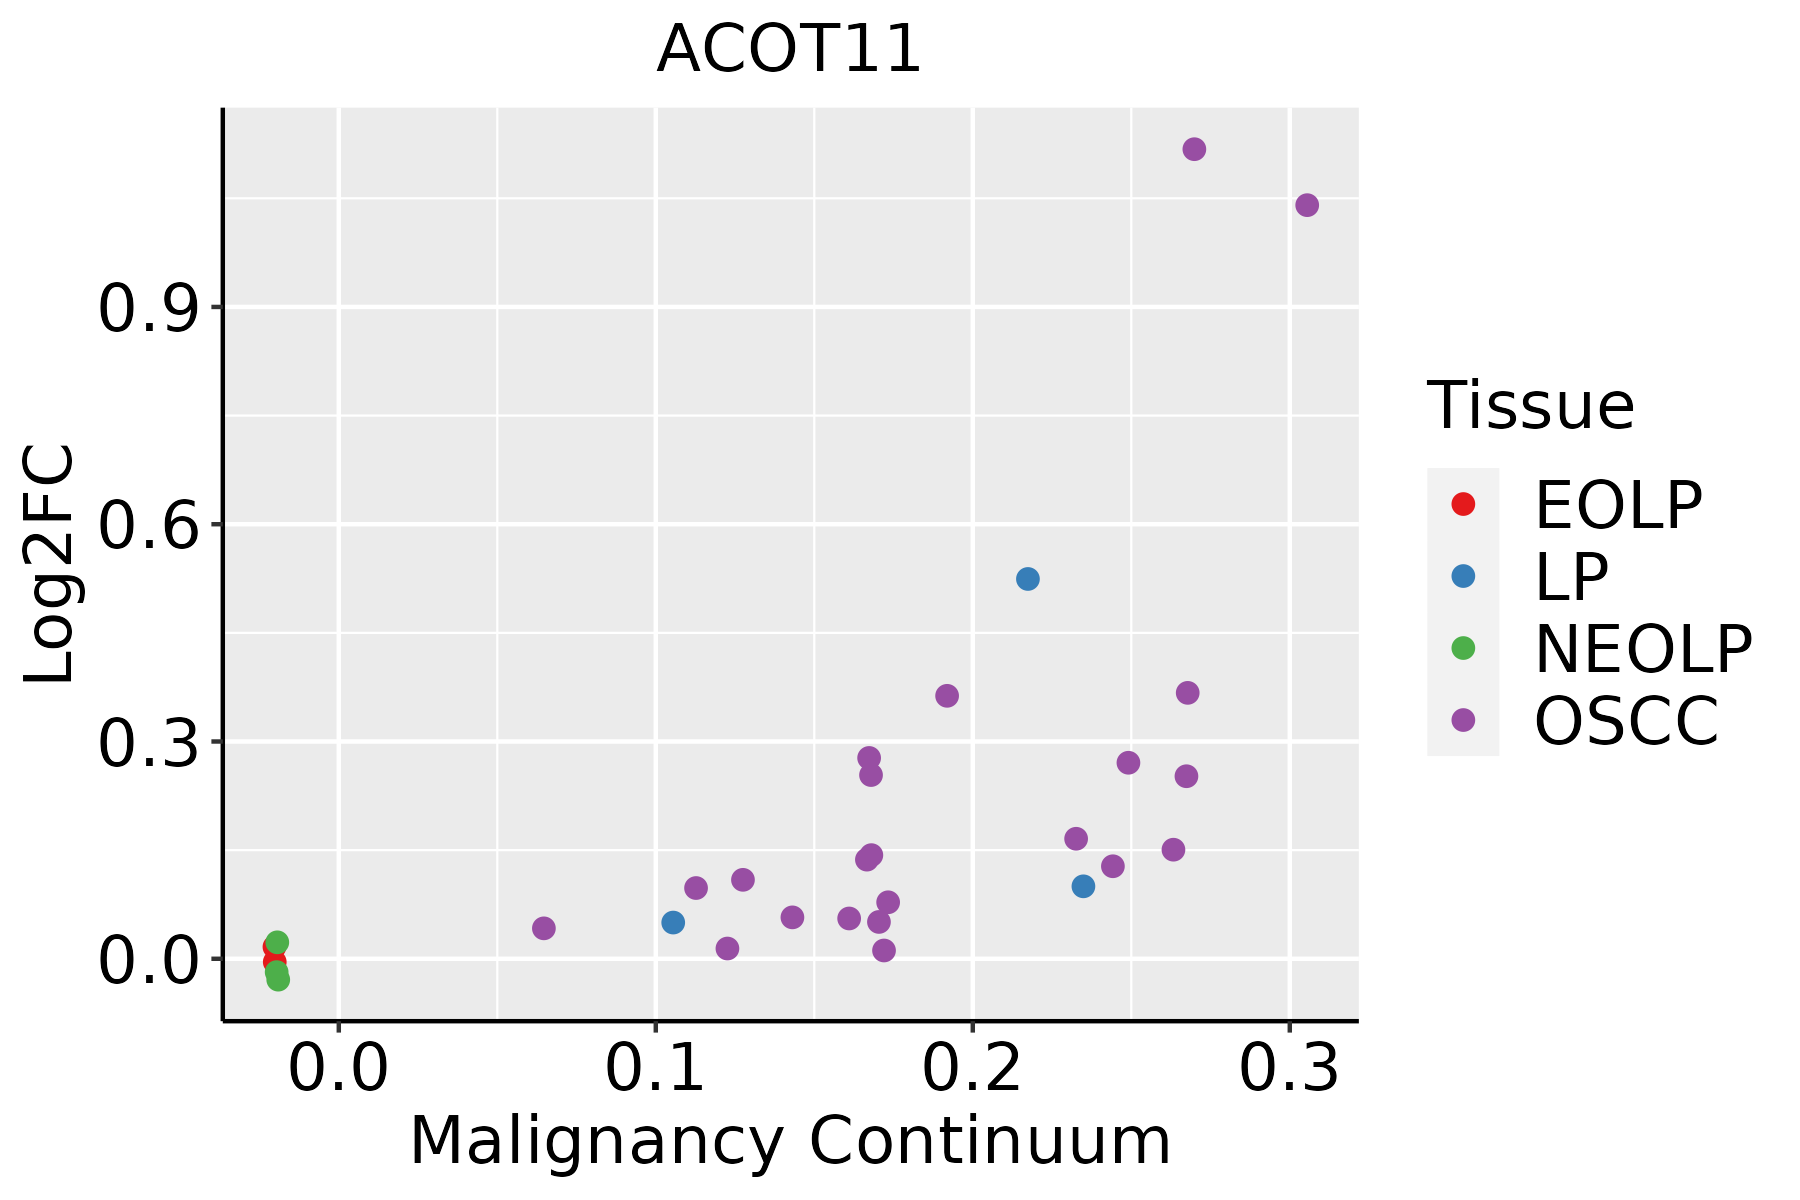 | EOLP: Erosive Oral lichen planus |
| LP: leukoplakia | ||
| NEOLP: Non-erosive oral lichen planus | ||
| OSCC: Oral squamous cell carcinoma | ||
| Thyroid | 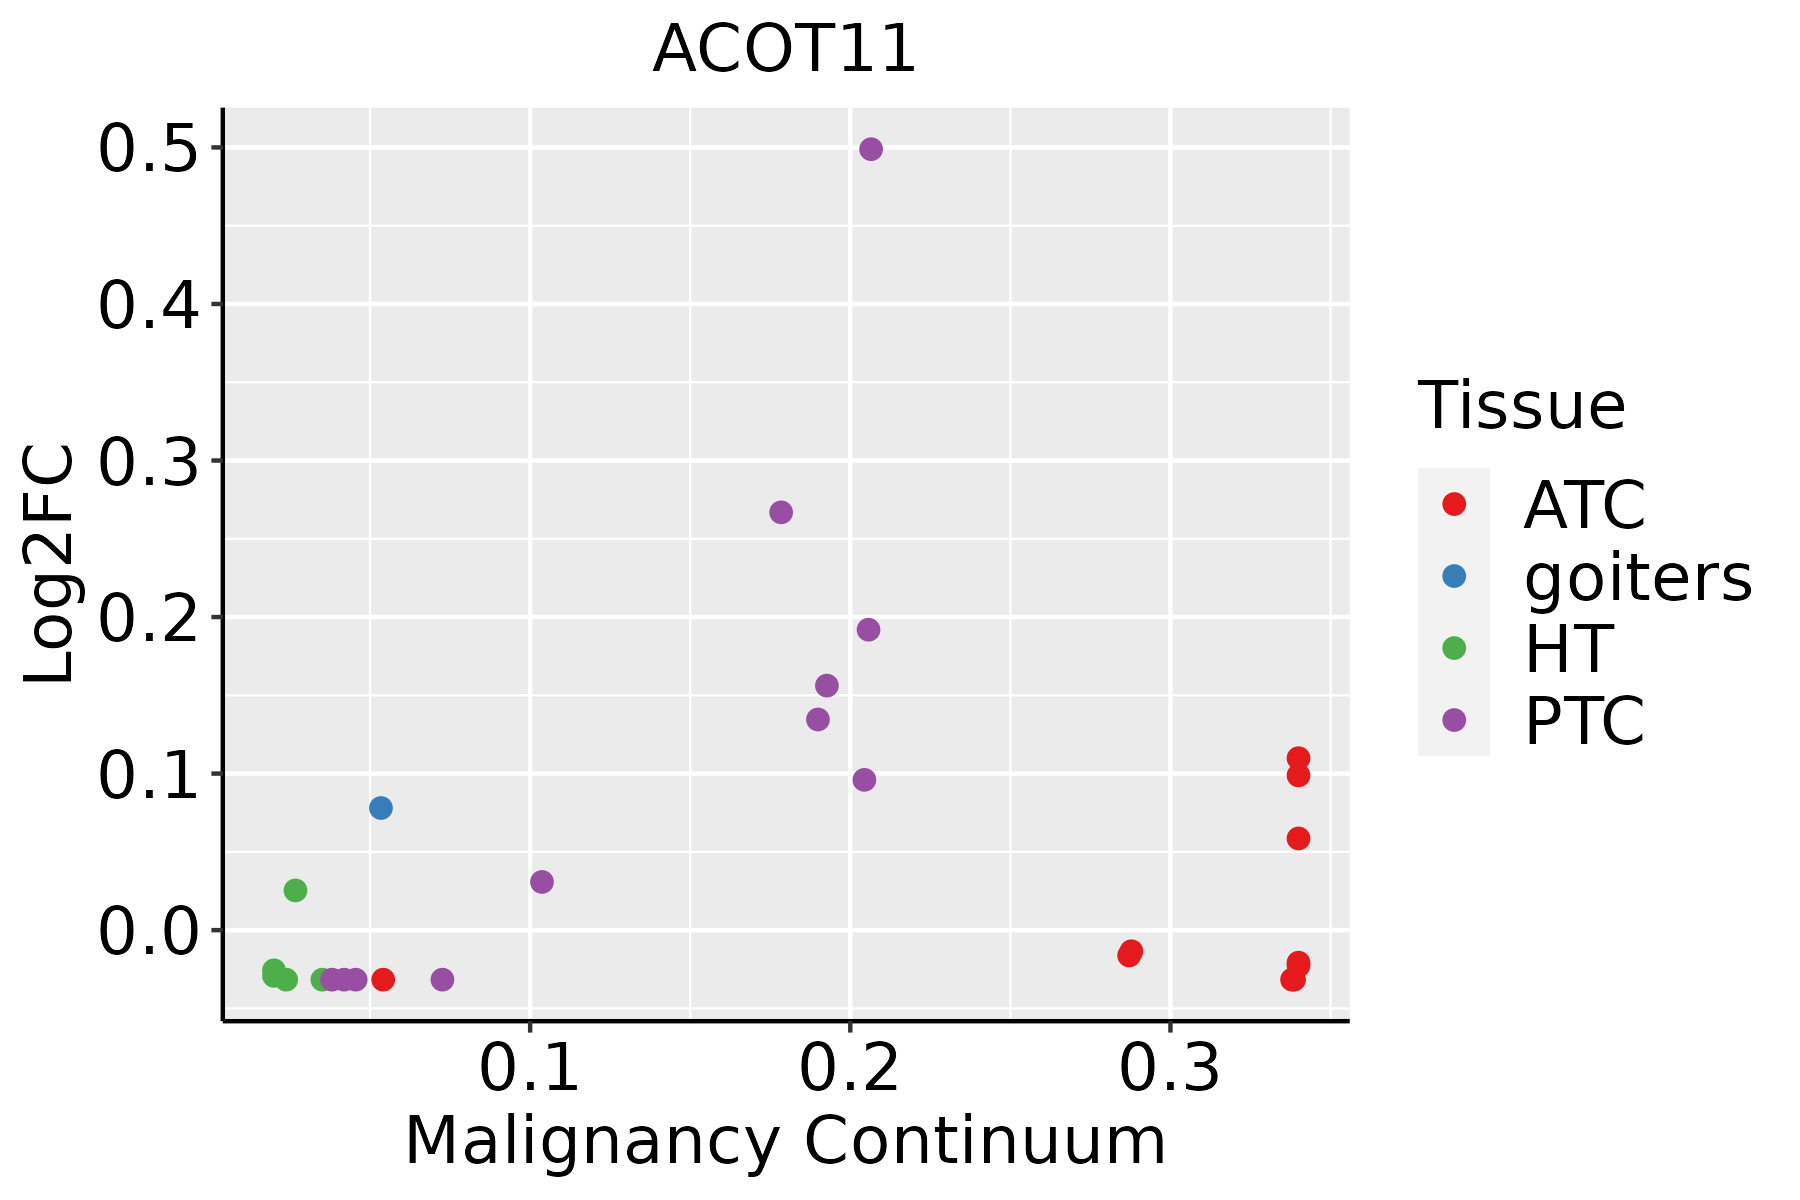 | ATC: Anaplastic thyroid cancer |
| HT: Hashimoto's thyroiditis | ||
| PTC: Papillary thyroid cancer |
| ∗log2FC in expression of this searched gene in stem-like cells from each diseased tissue sample relative to stem-like cells in normal samples in each tissue plotted against the malignancy continuum. Samples are colored based on if they are from different disease stage. |
Top |
Malignant transformation related pathway analysis |
| Find out the enriched GO biological processes and KEGG pathways involved in transition from healthy to precancer to cancer |
| Tissue | Disease Stage | Enriched GO biological Processes |
| Colorectum | AD |  |
| Colorectum | SER |  |
| Colorectum | MSS |  |
| Colorectum | MSI-H |  |
| Colorectum | FAP |  |
| ∗Top 15 enriched GO BP terms are showed in the bar plot of each disease state in each tissue. Each row represents a significant GO biological process which is colored according to the -log10(p.adjust). |
| Page: 1 2 3 4 5 6 7 8 9 |
| GO ID | Tissue | Disease Stage | Description | Gene Ratio | Bg Ratio | pvalue | p.adjust | Count |
| GO:00061635 | Colorectum | CRC | purine nucleotide metabolic process | 78/2078 | 396/18723 | 2.98e-07 | 2.59e-05 | 78 |
| GO:00092594 | Colorectum | CRC | ribonucleotide metabolic process | 75/2078 | 385/18723 | 7.83e-07 | 5.04e-05 | 75 |
| GO:00725215 | Colorectum | CRC | purine-containing compound metabolic process | 79/2078 | 416/18723 | 1.15e-06 | 6.75e-05 | 79 |
| GO:00196934 | Colorectum | CRC | ribose phosphate metabolic process | 75/2078 | 396/18723 | 2.36e-06 | 1.13e-04 | 75 |
| GO:00091175 | Colorectum | CRC | nucleotide metabolic process | 81/2078 | 489/18723 | 1.45e-04 | 2.65e-03 | 81 |
| GO:00067535 | Colorectum | CRC | nucleoside phosphate metabolic process | 81/2078 | 497/18723 | 2.48e-04 | 4.06e-03 | 81 |
| GO:00066314 | Colorectum | CRC | fatty acid metabolic process | 65/2078 | 390/18723 | 5.30e-04 | 7.42e-03 | 65 |
| GO:00016591 | Colorectum | CRC | temperature homeostasis | 32/2078 | 174/18723 | 2.81e-03 | 2.55e-02 | 32 |
| GO:01061062 | Colorectum | CRC | cold-induced thermogenesis | 27/2078 | 144/18723 | 4.38e-03 | 3.47e-02 | 27 |
| GO:01201612 | Colorectum | CRC | regulation of cold-induced thermogenesis | 27/2078 | 144/18723 | 4.38e-03 | 3.47e-02 | 27 |
| GO:000915013 | Lung | AIS | purine ribonucleotide metabolic process | 58/1849 | 368/18723 | 2.33e-04 | 4.68e-03 | 58 |
| GO:000925913 | Lung | AIS | ribonucleotide metabolic process | 59/1849 | 385/18723 | 4.36e-04 | 7.41e-03 | 59 |
| GO:000616313 | Lung | AIS | purine nucleotide metabolic process | 59/1849 | 396/18723 | 8.91e-04 | 1.20e-02 | 59 |
| GO:001969313 | Lung | AIS | ribose phosphate metabolic process | 59/1849 | 396/18723 | 8.91e-04 | 1.20e-02 | 59 |
| GO:007252113 | Lung | AIS | purine-containing compound metabolic process | 61/1849 | 416/18723 | 1.10e-03 | 1.42e-02 | 61 |
| GO:000675318 | Oral cavity | OSCC | nucleoside phosphate metabolic process | 247/7305 | 497/18723 | 6.28e-07 | 8.96e-06 | 247 |
| GO:000911719 | Oral cavity | OSCC | nucleotide metabolic process | 243/7305 | 489/18723 | 7.80e-07 | 1.09e-05 | 243 |
| GO:001969319 | Oral cavity | OSCC | ribose phosphate metabolic process | 199/7305 | 396/18723 | 2.97e-06 | 3.64e-05 | 199 |
| GO:000926616 | Oral cavity | OSCC | response to temperature stimulus | 98/7305 | 178/18723 | 9.78e-06 | 1.03e-04 | 98 |
| GO:000925919 | Oral cavity | OSCC | ribonucleotide metabolic process | 189/7305 | 385/18723 | 3.18e-05 | 2.87e-04 | 189 |
| Page: 1 2 3 4 5 6 |
| Pathway ID | Tissue | Disease Stage | Description | Gene Ratio | Bg Ratio | pvalue | p.adjust | qvalue | Count |
| Page: 1 |
Top |
Cell-cell communication analysis |
| Identification of potential cell-cell interactions between two cell types and their ligand-receptor pairs for different disease states |
| Ligand | Receptor | LRpair | Pathway | Tissue | Disease Stage |
| Page: 1 |
Top |
Single-cell gene regulatory network inference analysis |
| Find out the significant the regulons (TFs) and the target genes of each regulon across cell types for different disease states |
| TF | Cell Type | Tissue | Disease Stage | Target Gene | RSS | Regulon Activity |
| ∗The dot plots of a searched regulon are shown for all cell subpopulations in each disease state of each tissue based on the regulon specific score inferred using pySCENIC and by calculating the average expression. |
| Page: 1 |
Top |
Somatic mutation of malignant transformation related genes |
| Annotation of somatic variants for genes involved in malignant transformation |
| Hugo Symbol | Variant Class | Variant Classification | dbSNP RS | HGVSc | HGVSp | HGVSp Short | SWISSPROT | BIOTYPE | SIFT | PolyPhen | Tumor Sample Barcode | Tissue | Histology | Sex | Age | Stage | Therapy Types | Drugs | Outcome |
| ACOT11 | SNV | Missense_Mutation | rs138502889 | c.1556N>T | p.Thr519Met | p.T519M | Q8WXI4 | protein_coding | deleterious(0.05) | possibly_damaging(0.807) | TCGA-A8-A09Z-01 | Breast | breast invasive carcinoma | Female | >=65 | I/II | Unknown | Unknown | SD |
| ACOT11 | SNV | Missense_Mutation | c.539N>A | p.Arg180His | p.R180H | Q8WXI4 | protein_coding | deleterious(0.01) | probably_damaging(0.996) | TCGA-AN-A0AK-01 | Breast | breast invasive carcinoma | Female | >=65 | I/II | Unknown | Unknown | SD | |
| ACOT11 | SNV | Missense_Mutation | c.457N>G | p.Arg153Gly | p.R153G | Q8WXI4 | protein_coding | tolerated(0.45) | benign(0.006) | TCGA-E2-A150-01 | Breast | breast invasive carcinoma | Female | <65 | I/II | Chemotherapy | doxorubicin | SD | |
| ACOT11 | SNV | Missense_Mutation | novel | c.1299N>G | p.His433Gln | p.H433Q | Q8WXI4 | protein_coding | tolerated(0.57) | benign(0) | TCGA-AA-3939-01 | Colorectum | colon adenocarcinoma | Male | >=65 | I/II | Unknown | Unknown | SD |
| ACOT11 | SNV | Missense_Mutation | rs377475734 | c.1715G>A | p.Arg572His | p.R572H | Q8WXI4 | protein_coding | unknown(0) | TCGA-AA-3977-01 | Colorectum | colon adenocarcinoma | Male | >=65 | I/II | Unknown | Unknown | SD | |
| ACOT11 | SNV | Missense_Mutation | rs372914671 | c.88N>A | p.Gly30Arg | p.G30R | Q8WXI4 | protein_coding | deleterious_low_confidence(0.04) | benign(0.001) | TCGA-AY-6197-01 | Colorectum | colon adenocarcinoma | Male | <65 | I/II | Unknown | Unknown | SD |
| ACOT11 | SNV | Missense_Mutation | rs144192149 | c.910G>A | p.Ala304Thr | p.A304T | Q8WXI4 | protein_coding | deleterious(0.01) | probably_damaging(1) | TCGA-CM-6165-01 | Colorectum | colon adenocarcinoma | Male | >=65 | I/II | Unknown | Unknown | SD |
| ACOT11 | SNV | Missense_Mutation | novel | c.865A>G | p.Asn289Asp | p.N289D | Q8WXI4 | protein_coding | deleterious(0.02) | probably_damaging(1) | TCGA-F5-6814-01 | Colorectum | rectum adenocarcinoma | Male | <65 | I/II | Unknown | Unknown | SD |
| ACOT11 | SNV | Missense_Mutation | rs748574584 | c.904G>A | p.Val302Met | p.V302M | Q8WXI4 | protein_coding | deleterious(0.02) | possibly_damaging(0.907) | TCGA-AJ-A3BH-01 | Endometrium | uterine corpus endometrioid carcinoma | Female | Unknown | I/II | Unknown | Unknown | SD |
| ACOT11 | SNV | Missense_Mutation | rs778640519 | c.1043G>A | p.Arg348Gln | p.R348Q | Q8WXI4 | protein_coding | deleterious(0.03) | probably_damaging(0.999) | TCGA-AJ-A3BH-01 | Endometrium | uterine corpus endometrioid carcinoma | Female | Unknown | I/II | Unknown | Unknown | SD |
| Page: 1 2 3 4 5 6 |
Top |
Related drugs of malignant transformation related genes |
| Identification of chemicals and drugs interact with genes involved in malignant transfromation |
| (DGIdb 4.0) |
| Entrez ID | Symbol | Category | Interaction Types | Drug Claim Name | Drug Name | PMIDs |
| Page: 1 |

Copyright 2023-Present -The University of Texas Health Science Center at Houston |