Schematic overview of the cellular and molecular mechanisms involved in the cancer progression, including the proposed cellular and molecular mechanisms in cancer cells trajectory. AT1: alveolar type 1 cells; AT2: alveolar type 2 cells; AAH: atypical adenomatous hyperplasia; AIS: adenocarcinoma in situ; MIA: minimally invasive adenocarcinoma; IA: invasive adenocarcinoma; EMT: epithelial-mesenchymal transition

Home

Download

Statistics

Help

Contact

Center for Computational Systems Medicine
leaf

Gene summary

leaf

Malignant transformation analysis

leaf

Malignant transformation related pathway analysis

leaf

Cell-cell communication analysis

leaf

Single-cell gene regulatory network inference analysis

leaf

Somatic mutation of malignant transformation related genes

leaf

Related drugs of malignant transformation related genes

Gene: ABR

Gene summary for ABR

check button Gene summary.

Gene informationSpeciesHuman
Gene symbol

ABR

Gene ID

29

Gene nameABR activator of RhoGEF and GTPase
Gene AliasMDB
Cytomap17p13.3
Gene Typeprotein-coding
GO ID

GO:0007154

UniProtAcc

B7Z2X0


Top

Malignant transformation analysis

check button Identification of the aberrant gene expression in precancerous and cancerous lesions by comparing the gene expression of stem-like cells in diseased tissues with normal stem cells
check button Malignant transformation involving gene list.
Entrez IDSymbolReplicatesSpeciesOrganTissueAdj P-valueLog2FCMalignancy
29ABRHTA11_2487_2000001011HumanColorectumSER1.34e-034.32e-01-0.1808
29ABRHTA11_2951_2000001011HumanColorectumAD3.14e-023.36e-010.0216
29ABRHTA11_1938_2000001011HumanColorectumAD8.46e-136.76e-01-0.0811
29ABRHTA11_347_2000001011HumanColorectumAD1.39e-208.89e-01-0.1954
29ABRHTA11_3361_2000001011HumanColorectumAD2.75e-116.03e-01-0.1207
29ABRHTA11_83_2000001011HumanColorectumSER1.54e-199.29e-01-0.1526
29ABRHTA11_696_2000001011HumanColorectumAD8.32e-168.81e-01-0.1464
29ABRHTA11_866_2000001011HumanColorectumAD2.67e-177.56e-01-0.1001
29ABRHTA11_1391_2000001011HumanColorectumAD7.75e-131.07e+00-0.059
29ABRHTA11_2992_2000001011HumanColorectumSER2.97e-033.52e-01-0.1706
29ABRHTA11_546_2000001011HumanColorectumAD1.53e-161.31e+00-0.0842
29ABRHTA11_9341_2000001011HumanColorectumSER1.22e-117.24e-01-0.00410000000000005
29ABRHTA11_7862_2000001011HumanColorectumAD9.44e-054.69e-01-0.0179
29ABRHTA11_4255_2000001011HumanColorectumSER5.61e-167.28e-010.0446
29ABRHTA11_9408_2000001011HumanColorectumAD9.03e-077.17e-010.0451
29ABRHTA11_8622_2000001021HumanColorectumSER6.78e-138.45e-010.0528
29ABRHTA11_7663_2000001011HumanColorectumSER1.65e-141.02e+000.0131
29ABRHTA11_10623_2000001011HumanColorectumAD1.30e-221.22e+00-0.0177
29ABRHTA11_10711_2000001011HumanColorectumAD4.53e-251.12e+000.0338
29ABRHTA11_7696_3000711011HumanColorectumAD7.85e-291.15e+000.0674
Page: 1 2 3 4 5 6 7 

check button Transcriptomic changes along malignancy continuum.
TissueExpression DynamicsAbbreviation
Colorectum (GSE201348)The image shows the transcriptomic changes along malignancy continuum.log2FC in expression of this searched gene in stem-like cells from each diseased tissue sample relative to stem-like cells in normal samples in each tissue plotted against the malignancy continuum. Samples are colored based on if they are from different disease stage.FAP: Familial adenomatous polyposis
CRC: Colorectal cancer
Colorectum (HTA11)The image shows the transcriptomic changes along malignancy continuum.log2FC in expression of this searched gene in stem-like cells from each diseased tissue sample relative to stem-like cells in normal samples in each tissue plotted against the malignancy continuum. Samples are colored based on if they are from different disease stage.AD: Adenomas
SER: Sessile serrated lesions
MSI-H: Microsatellite-high colorectal cancer
MSS: Microsatellite stable colorectal cancer
EndometriumThe image shows the transcriptomic changes along malignancy continuum.log2FC in expression of this searched gene in stem-like cells from each diseased tissue sample relative to stem-like cells in normal samples in each tissue plotted against the malignancy continuum. Samples are colored based on if they are from different disease stage.
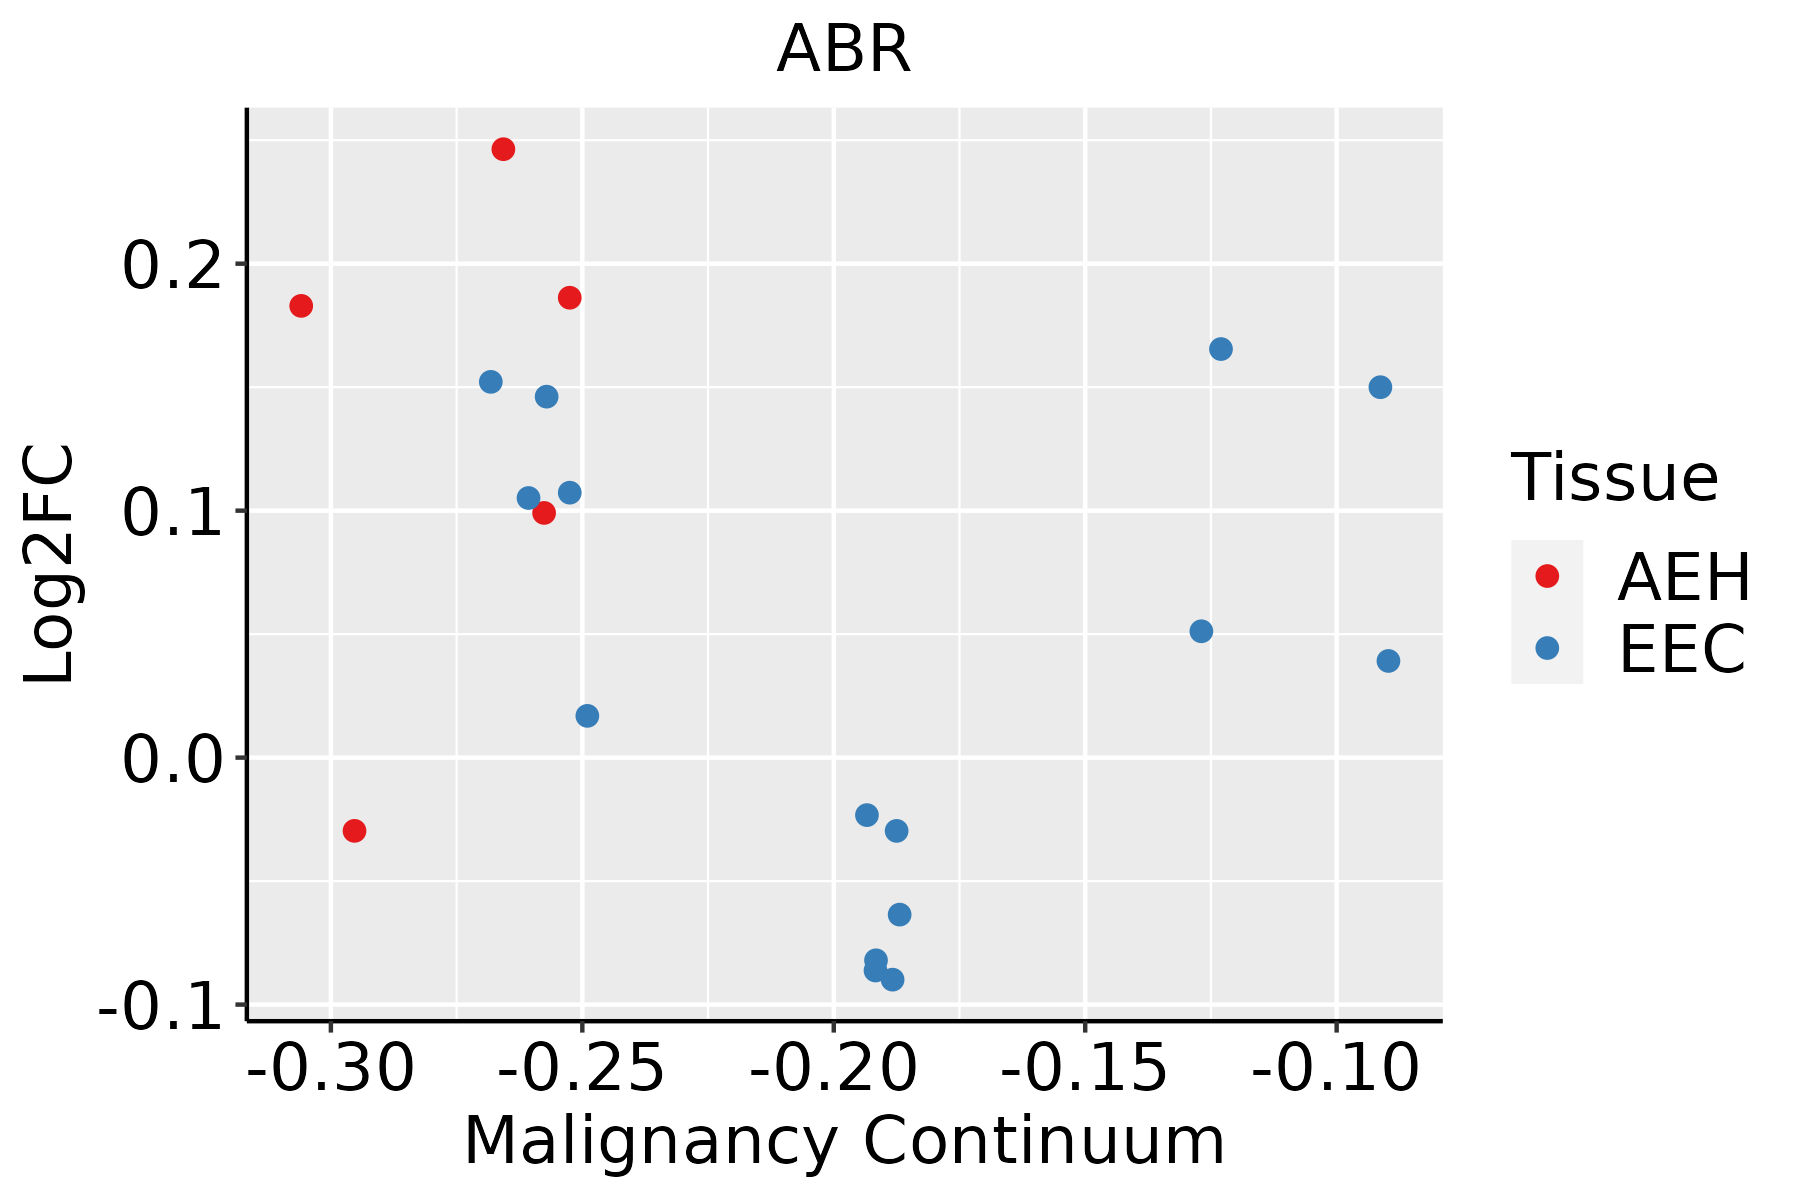
AEH: Atypical endometrial hyperplasia
EEC: Endometrioid Cancer
EsophagusThe image shows the transcriptomic changes along malignancy continuum.log2FC in expression of this searched gene in stem-like cells from each diseased tissue sample relative to stem-like cells in normal samples in each tissue plotted against the malignancy continuum. Samples are colored based on if they are from different disease stage.ESCC: Esophageal squamous cell carcinoma
HGIN: High-grade intraepithelial neoplasias
LGIN: Low-grade intraepithelial neoplasias
LungThe image shows the transcriptomic changes along malignancy continuum.log2FC in expression of this searched gene in stem-like cells from each diseased tissue sample relative to stem-like cells in normal samples in each tissue plotted against the malignancy continuum. Samples are colored based on if they are from different disease stage.
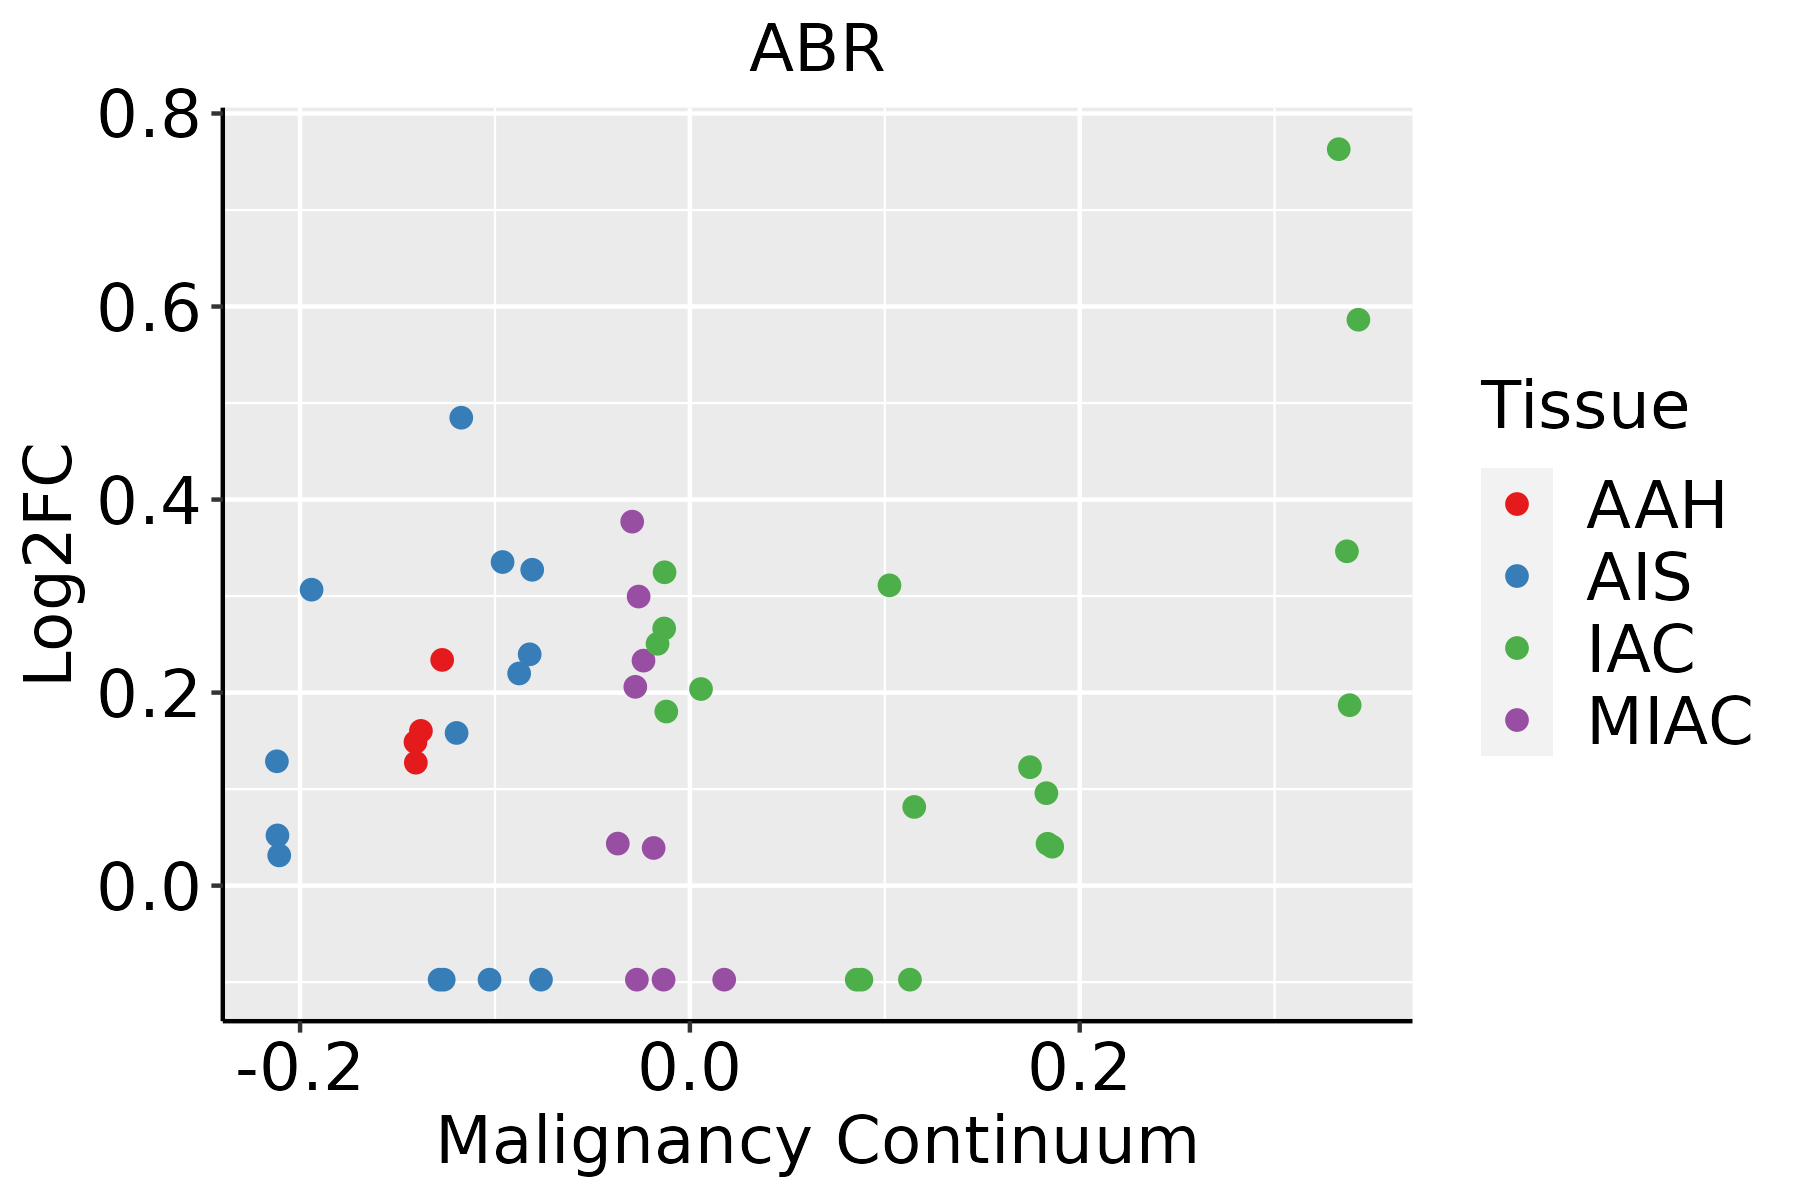
AAH: Atypical adenomatous hyperplasia
AIS: Adenocarcinoma in situ
IAC: Invasive lung adenocarcinoma
MIA: Minimally invasive adenocarcinoma
ProstateThe image shows the transcriptomic changes along malignancy continuum.log2FC in expression of this searched gene in stem-like cells from each diseased tissue sample relative to stem-like cells in normal samples in each tissue plotted against the malignancy continuum. Samples are colored based on if they are from different disease stage.
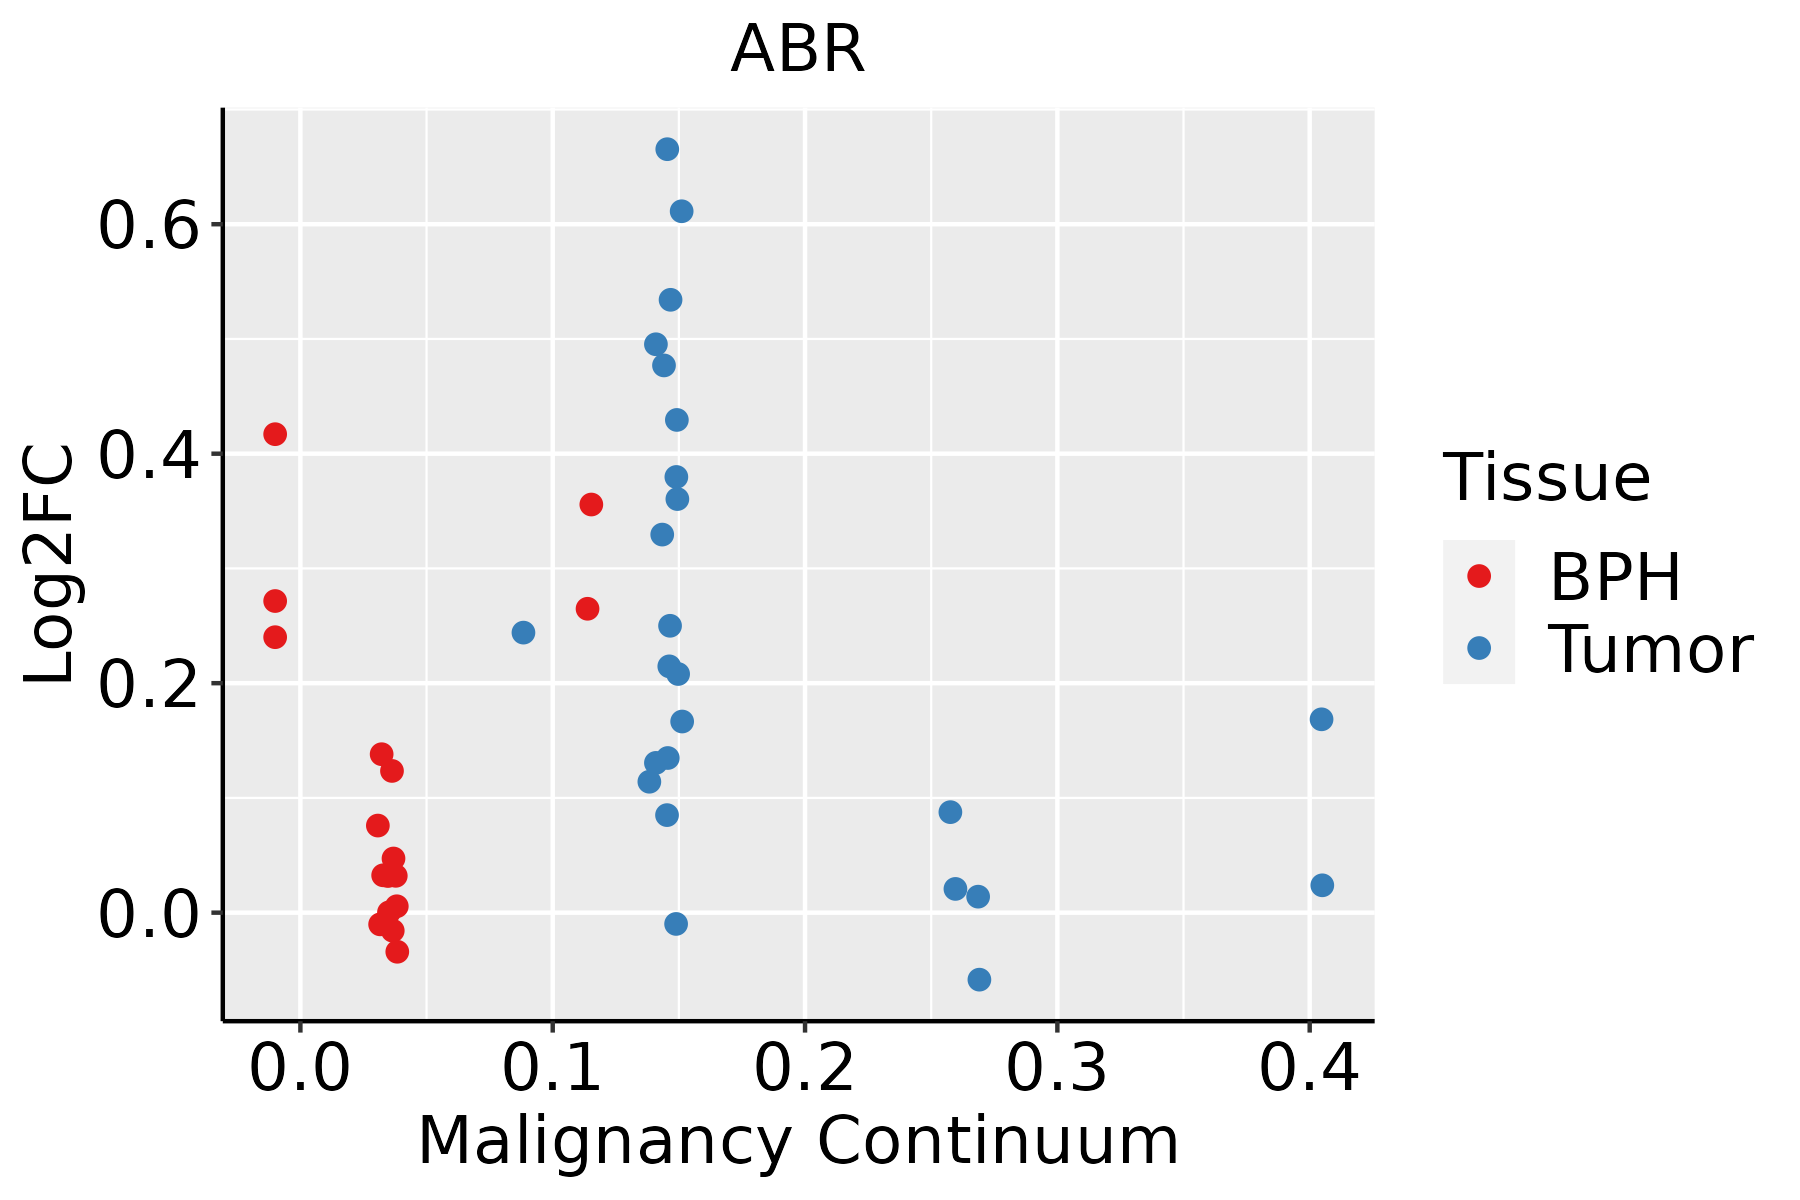
BPH: Benign Prostatic Hyperplasia
∗log2FC in expression of this searched gene in stem-like cells from each diseased tissue sample relative to stem-like cells in normal samples in each tissue plotted against the malignancy continuum. Samples are colored based on if they are from different disease stage.

Top

Malignant transformation related pathway analysis

check buttonFind out the enriched GO biological processes and KEGG pathways involved in transition from healthy to precancer to cancer
check button Figure of enriched GO biological processes.
TissueDisease StageEnriched GO biological Processes
ColorectumADGO analysis - Figure of enriched GO biological processes: Top 15 enriched GO BP terms are showed in the bar plot of each disease state in each tissue. Each row represents a significant GO biological process which is colored according to the -log10(p.adjust).
ColorectumSERGO analysis - Figure of enriched GO biological processes: Top 15 enriched GO BP terms are showed in the bar plot of each disease state in each tissue. Each row represents a significant GO biological process which is colored according to the -log10(p.adjust).
ColorectumMSSGO analysis - Figure of enriched GO biological processes: Top 15 enriched GO BP terms are showed in the bar plot of each disease state in each tissue. Each row represents a significant GO biological process which is colored according to the -log10(p.adjust).
ColorectumMSI-HGO analysis - Figure of enriched GO biological processes: Top 15 enriched GO BP terms are showed in the bar plot of each disease state in each tissue. Each row represents a significant GO biological process which is colored according to the -log10(p.adjust).
ColorectumFAPGO analysis - Figure of enriched GO biological processes: Top 15 enriched GO BP terms are showed in the bar plot of each disease state in each tissue. Each row represents a significant GO biological process which is colored according to the -log10(p.adjust).
∗Top 15 enriched GO BP terms are showed in the bar plot of each disease state in each tissue. Each row represents a significant GO biological process which is colored according to the -log10(p.adjust).
Page: 1 2 3 4 5 6 7 8 9 

check button Enriched GO biological processes.
GO IDTissueDisease StageDescriptionGene RatioBg Ratiopvaluep.adjustCount
GO:00096363ColorectumFAPresponse to toxic substance53/2622262/187233.35e-032.46e-0253
GO:0090630ColorectumFAPactivation of GTPase activity27/2622115/187234.23e-032.90e-0227
GO:00156981ColorectumFAPinorganic anion transport38/2622180/187235.73e-033.67e-0238
GO:00510563ColorectumCRCregulation of small GTPase mediated signal transduction69/2078302/187233.34e-099.08e-0769
GO:00430874ColorectumCRCregulation of GTPase activity69/2078348/187231.11e-066.69e-0569
GO:00435473ColorectumCRCpositive regulation of GTPase activity49/2078255/187238.67e-051.77e-0349
GO:0050804ColorectumCRCmodulation of chemical synaptic transmission70/2078439/187231.15e-031.33e-0270
GO:0099177ColorectumCRCregulation of trans-synaptic signaling70/2078440/187231.23e-031.38e-0270
GO:005105612EndometriumEECregulation of small GTPase mediated signal transduction61/2168302/187239.42e-062.08e-0461
GO:004308712EndometriumEECregulation of GTPase activity67/2168348/187231.84e-053.43e-0467
GO:004354712EndometriumEECpositive regulation of GTPase activity50/2168255/187231.26e-041.66e-0350
GO:009063012EndometriumEECactivation of GTPase activity23/2168115/187236.04e-033.57e-0223
GO:003297027EsophagusHGINregulation of actin filament-based process77/2587397/187231.14e-031.39e-0277
GO:0032970111EsophagusESCCregulation of actin filament-based process231/8552397/187232.91e-074.20e-06231
GO:003432918EsophagusESCCcell junction assembly227/8552420/187233.06e-041.83e-03227
GO:004308715EsophagusESCCregulation of GTPase activity183/8552348/187235.34e-032.00e-02183
GO:0060021EsophagusESCCroof of mouth development50/855285/187231.00e-023.42e-0250
GO:005105610EsophagusESCCregulation of small GTPase mediated signal transduction157/8552302/187231.55e-024.98e-02157
GO:003297012LiverCirrhoticregulation of actin filament-based process152/4634397/187231.12e-095.00e-08152
GO:003297022LiverHCCregulation of actin filament-based process222/7958397/187233.81e-088.30e-07222
Page: 1 2 3 4 5 6 

check button Enriched KEGG pathways.
Pathway IDTissueDisease StageDescriptionGene RatioBg Ratiopvaluep.adjustqvalueCount
Page: 1 

Top

Cell-cell communication analysis

check buttonIdentification of potential cell-cell interactions between two cell types and their ligand-receptor pairs for different disease states
LigandReceptorLRpairPathwayTissueDisease Stage
Page: 1 

Top

Single-cell gene regulatory network inference analysis

check buttonFind out the significant the regulons (TFs) and the target genes of each regulon across cell types for different disease states
TFCell TypeTissueDisease StageTarget GeneRSSRegulon Activity
∗The dot plots of a searched regulon are shown for all cell subpopulations in each disease state of each tissue based on the regulon specific score inferred using pySCENIC and by calculating the average expression.
Page: 1 

Top

Somatic mutation of malignant transformation related genes

check buttonAnnotation of somatic variants for genes involved in malignant transformation
Hugo SymbolVariant ClassVariant ClassificationdbSNP RSHGVScHGVSpHGVSp ShortSWISSPROTBIOTYPESIFTPolyPhenTumor Sample BarcodeTissueHistologySexAgeStageTherapy TypesDrugsOutcome
ABRSNVMissense_Mutationc.1535C>Tp.Ser512Phep.S512FQ12979protein_codingdeleterious(0.04)probably_damaging(0.996)TCGA-A8-A09G-01Breastbreast invasive carcinomaFemale>=65III/IVUnknownUnknownSD
ABRSNVMissense_Mutationc.1535N>Gp.Ser512Cysp.S512CQ12979protein_codingdeleterious(0)probably_damaging(0.996)TCGA-AC-A23H-01Breastbreast invasive carcinomaFemale>=65I/IIUnknownUnknownPD
ABRSNVMissense_Mutationc.1650N>Tp.Lys550Asnp.K550NQ12979protein_codingtolerated(0.97)benign(0.005)TCGA-AN-A0FT-01Breastbreast invasive carcinomaFemale<65I/IIUnknownUnknownSD
ABRSNVMissense_Mutationc.370N>Ap.Ala124Thrp.A124TQ12979protein_codingdeleterious(0)possibly_damaging(0.763)TCGA-AN-A0FV-01Breastbreast invasive carcinomaFemale<65I/IIUnknownUnknownSD
ABRSNVMissense_Mutationc.2482A>Tp.Met828Leup.M828LQ12979protein_codingtolerated(0.14)benign(0.074)TCGA-D8-A1XK-01Breastbreast invasive carcinomaFemale<65I/IIChemotherapydoxorubicine+cyclophosphamideSD
ABRSNVMissense_Mutationnovelc.85N>Cp.Tyr29Hisp.Y29HQ12979protein_codingdeleterious_low_confidence(0.01)possibly_damaging(0.797)TCGA-D8-A1XQ-01Breastbreast invasive carcinomaFemale>=65I/IIUnknownUnknownSD
ABRdeletionFrame_Shift_Delnovelc.555delNp.Ala186ArgfsTer32p.A186Rfs*32Q12979protein_codingTCGA-D8-A27V-01Breastbreast invasive carcinomaFemale<65I/IIHormone TherapytamoxiphenSD
ABRSNVMissense_Mutationnovelc.1076N>Tp.Ser359Phep.S359FQ12979protein_codingtolerated(0.17)possibly_damaging(0.601)TCGA-2W-A8YY-01Cervixcervical & endocervical cancerFemale<65I/IIChemotherapycisplatinCR
ABRSNVMissense_Mutationc.1742N>Cp.Lys581Thrp.K581TQ12979protein_codingdeleterious(0.01)possibly_damaging(0.719)TCGA-BI-A0VS-01Cervixcervical & endocervical cancerFemale<65I/IIUnknownUnknownSD
ABRSNVMissense_Mutationc.2051N>Gp.Ile684Argp.I684RQ12979protein_codingdeleterious(0)possibly_damaging(0.616)TCGA-FU-A3HZ-01Cervixcervical & endocervical cancerFemale<65I/IIChemotherapycisplatinCR
Page: 1 2 3 4 5 6 7 8 9 10 11 

Top

Related drugs of malignant transformation related genes

check buttonIdentification of chemicals and drugs interact with genes involved in malignant transfromation
(DGIdb 4.0)
Entrez IDSymbolCategoryInteraction TypesDrug Claim NameDrug NamePMIDs
Page: 1