
|
|||||
|
 | |
| |
| |
| |
| |
| |
|
Gene: ABCA3 |
Gene summary for ABCA3 |
| Gene information | Species | Human | Gene symbol | ABCA3 | Gene ID | 21 |
| Gene name | ATP binding cassette subfamily A member 3 | |
| Gene Alias | ABC-C | |
| Cytomap | 16p13.3 | |
| Gene Type | protein-coding | GO ID | GO:0001894 | UniProtAcc | Q4LE27 |
Top |
Malignant transformation analysis |
| Identification of the aberrant gene expression in precancerous and cancerous lesions by comparing the gene expression of stem-like cells in diseased tissues with normal stem cells |
| Entrez ID | Symbol | Replicates | Species | Organ | Tissue | Adj P-value | Log2FC | Malignancy |
| 21 | ABCA3 | HCC2 | Human | Liver | HCC | 6.01e-05 | 2.88e+00 | 0.5341 |
| 21 | ABCA3 | S014 | Human | Liver | HCC | 5.03e-13 | 4.34e-01 | 0.2254 |
| 21 | ABCA3 | S015 | Human | Liver | HCC | 4.36e-06 | 2.86e-01 | 0.2375 |
| 21 | ABCA3 | S016 | Human | Liver | HCC | 5.69e-13 | 3.98e-01 | 0.2243 |
| 21 | ABCA3 | S027 | Human | Liver | HCC | 3.48e-08 | 5.20e-01 | 0.2446 |
| 21 | ABCA3 | S028 | Human | Liver | HCC | 2.19e-15 | 5.11e-01 | 0.2503 |
| 21 | ABCA3 | S029 | Human | Liver | HCC | 9.53e-10 | 2.85e-01 | 0.2581 |
| 21 | ABCA3 | TD9 | Human | Lung | IAC | 3.53e-05 | -1.37e-01 | 0.088 |
| 21 | ABCA3 | RNA-P10T2-P10T2-1 | Human | Lung | AAH | 1.33e-03 | 2.85e-02 | -0.1271 |
| 21 | ABCA3 | RNA-P10T2-P10T2-2 | Human | Lung | AAH | 1.18e-08 | 3.08e-02 | -0.1406 |
| 21 | ABCA3 | RNA-P10T2-P10T2-3 | Human | Lung | AAH | 1.09e-03 | -1.37e-01 | -0.1408 |
| 21 | ABCA3 | RNA-P10T2-P10T2-4 | Human | Lung | AAH | 9.91e-08 | 2.80e-01 | -0.138 |
| 21 | ABCA3 | RNA-P17T-P17T-6 | Human | Lung | IAC | 8.59e-04 | -6.42e-01 | 0.3385 |
| 21 | ABCA3 | RNA-P25T1-P25T1-1 | Human | Lung | AIS | 1.01e-11 | 1.33e-01 | -0.2116 |
| 21 | ABCA3 | RNA-P25T1-P25T1-2 | Human | Lung | AIS | 2.91e-06 | 1.40e-02 | -0.1941 |
| 21 | ABCA3 | RNA-P25T1-P25T1-3 | Human | Lung | AIS | 1.34e-03 | -2.12e-02 | -0.2107 |
| 21 | ABCA3 | RNA-P25T1-P25T1-4 | Human | Lung | AIS | 1.93e-11 | 1.28e-01 | -0.2119 |
| 21 | ABCA3 | RNA-P3T-P3T-1 | Human | Lung | IAC | 1.49e-02 | -8.37e-01 | 0.1829 |
| 21 | ABCA3 | RNA-P3T-P3T-4 | Human | Lung | IAC | 1.32e-03 | -7.56e-01 | 0.1859 |
| 21 | ABCA3 | RNA-P6T2-P6T2-1 | Human | Lung | IAC | 1.08e-11 | -1.77e-01 | -0.0166 |
| Page: 1 2 |
| Tissue | Expression Dynamics | Abbreviation |
| Liver |  | HCC: Hepatocellular carcinoma |
| NAFLD: Non-alcoholic fatty liver disease | ||
| Lung | 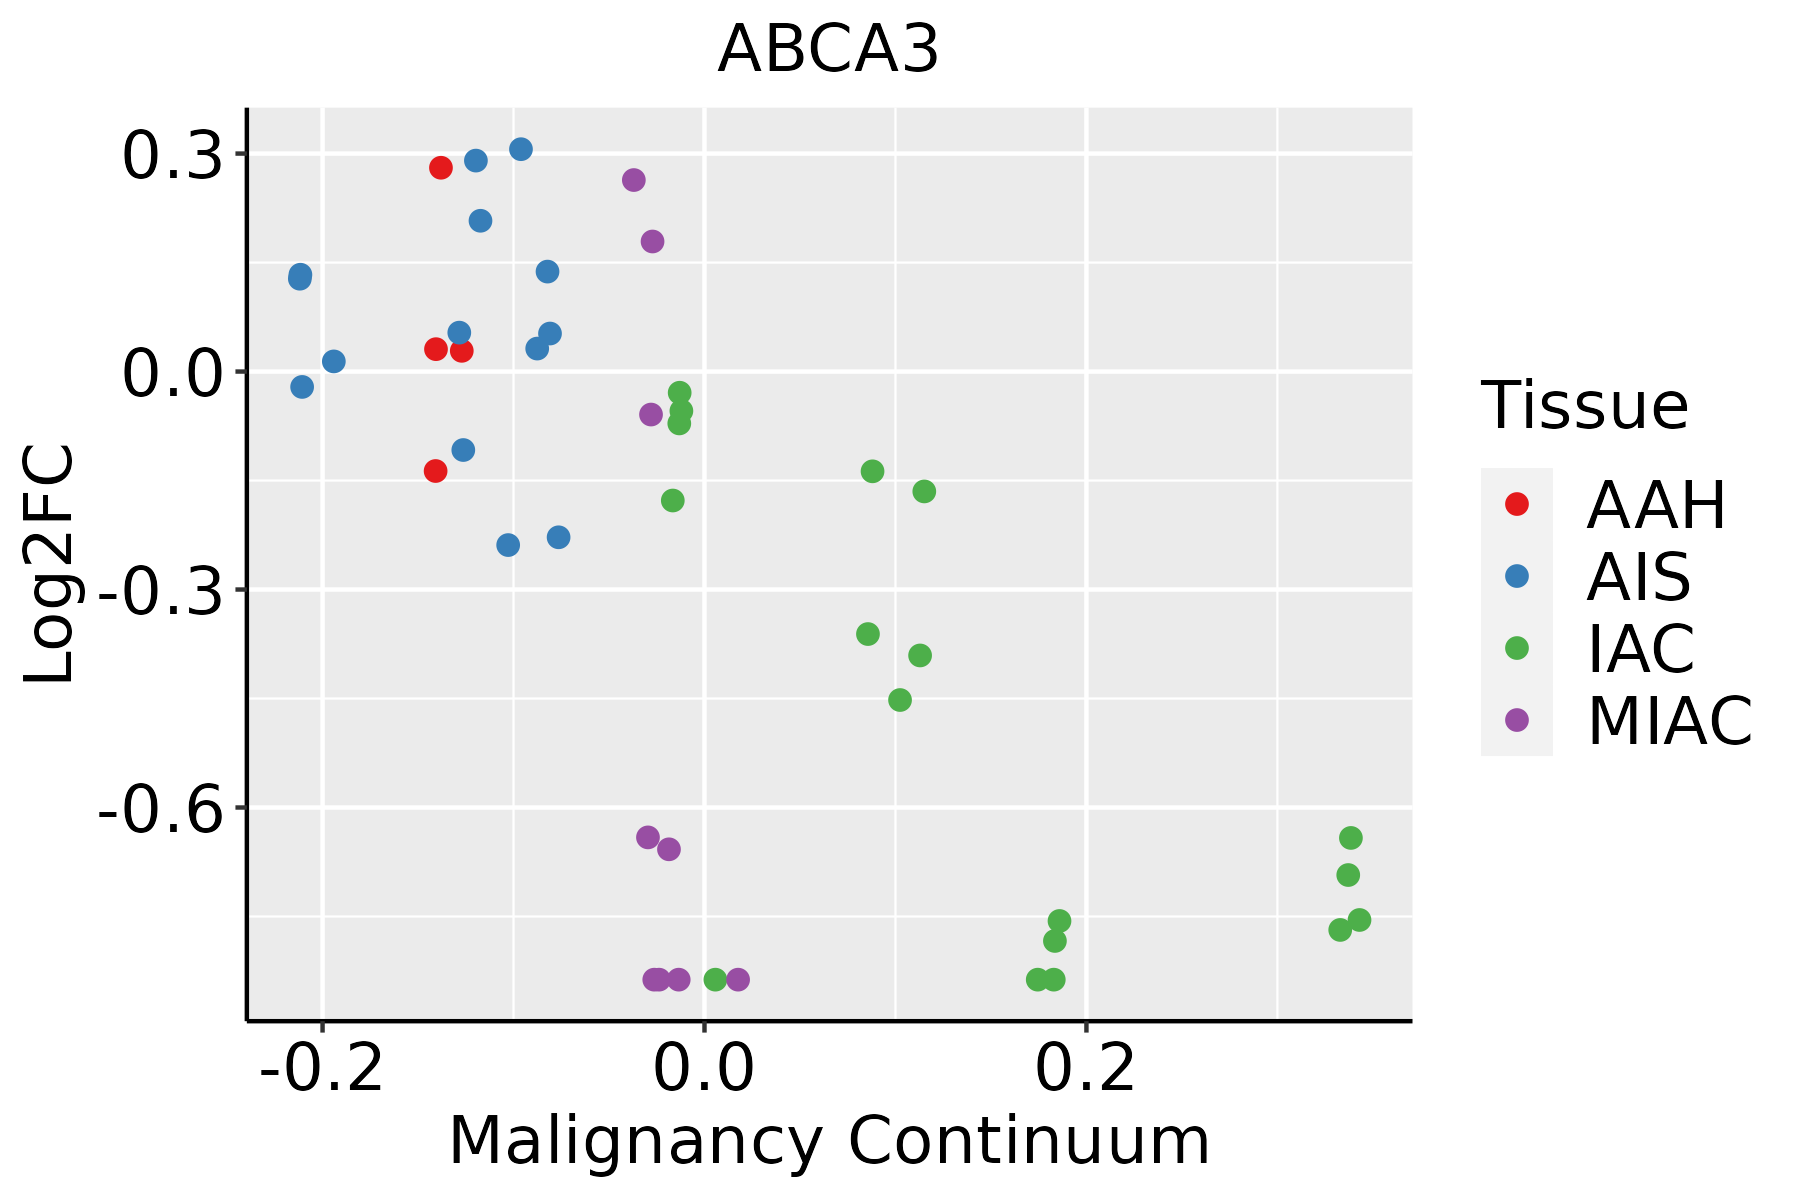 | AAH: Atypical adenomatous hyperplasia |
| AIS: Adenocarcinoma in situ | ||
| IAC: Invasive lung adenocarcinoma | ||
| MIA: Minimally invasive adenocarcinoma |
| ∗log2FC in expression of this searched gene in stem-like cells from each diseased tissue sample relative to stem-like cells in normal samples in each tissue plotted against the malignancy continuum. Samples are colored based on if they are from different disease stage. |
Top |
Malignant transformation related pathway analysis |
| Find out the enriched GO biological processes and KEGG pathways involved in transition from healthy to precancer to cancer |
| Tissue | Disease Stage | Enriched GO biological Processes |
| Colorectum | AD |  |
| Colorectum | SER |  |
| Colorectum | MSS |  |
| Colorectum | MSI-H |  |
| Colorectum | FAP |  |
| ∗Top 15 enriched GO BP terms are showed in the bar plot of each disease state in each tissue. Each row represents a significant GO biological process which is colored according to the -log10(p.adjust). |
| Page: 1 2 3 4 5 6 7 8 9 |
| GO ID | Tissue | Disease Stage | Description | Gene Ratio | Bg Ratio | pvalue | p.adjust | Count |
| GO:003032412 | Lung | AIS | lung development | 29/1849 | 177/18723 | 4.48e-03 | 3.97e-02 | 29 |
| GO:00464701 | Lung | AIS | phosphatidylcholine metabolic process | 15/1849 | 74/18723 | 5.25e-03 | 4.49e-02 | 15 |
| GO:001591411 | Lung | AIS | phospholipid transport | 18/1849 | 96/18723 | 5.64e-03 | 4.76e-02 | 18 |
| GO:003032312 | Lung | AIS | respiratory tube development | 29/1849 | 181/18723 | 6.16e-03 | 4.98e-02 | 29 |
| GO:00488752 | Lung | AAH | chemical homeostasis within a tissue | 7/613 | 14/18723 | 1.10e-07 | 6.77e-05 | 7 |
| GO:00431292 | Lung | AAH | surfactant homeostasis | 6/613 | 12/18723 | 9.39e-07 | 3.07e-04 | 6 |
| GO:01501722 | Lung | AAH | regulation of phosphatidylcholine metabolic process | 4/613 | 10/18723 | 2.04e-04 | 1.13e-02 | 4 |
| GO:000189422 | Lung | AAH | tissue homeostasis | 21/613 | 268/18723 | 2.12e-04 | 1.16e-02 | 21 |
| GO:006024912 | Lung | AAH | anatomical structure homeostasis | 23/613 | 314/18723 | 2.89e-04 | 1.45e-02 | 23 |
| GO:003133422 | Lung | AAH | positive regulation of protein-containing complex assembly | 17/613 | 237/18723 | 2.15e-03 | 4.66e-02 | 17 |
| Page: 1 2 3 |
| Pathway ID | Tissue | Disease Stage | Description | Gene Ratio | Bg Ratio | pvalue | p.adjust | qvalue | Count |
| Page: 1 |
Top |
Cell-cell communication analysis |
| Identification of potential cell-cell interactions between two cell types and their ligand-receptor pairs for different disease states |
| Ligand | Receptor | LRpair | Pathway | Tissue | Disease Stage |
| Page: 1 |
Top |
Single-cell gene regulatory network inference analysis |
| Find out the significant the regulons (TFs) and the target genes of each regulon across cell types for different disease states |
| TF | Cell Type | Tissue | Disease Stage | Target Gene | RSS | Regulon Activity |
| ∗The dot plots of a searched regulon are shown for all cell subpopulations in each disease state of each tissue based on the regulon specific score inferred using pySCENIC and by calculating the average expression. |
| Page: 1 |
Top |
Somatic mutation of malignant transformation related genes |
| Annotation of somatic variants for genes involved in malignant transformation |
| Hugo Symbol | Variant Class | Variant Classification | dbSNP RS | HGVSc | HGVSp | HGVSp Short | SWISSPROT | BIOTYPE | SIFT | PolyPhen | Tumor Sample Barcode | Tissue | Histology | Sex | Age | Stage | Therapy Types | Drugs | Outcome |
| ABCA3 | SNV | Missense_Mutation | novel | c.1649N>C | p.Arg550Thr | p.R550T | Q99758 | protein_coding | deleterious(0) | benign(0.039) | TCGA-A2-A0CR-01 | Breast | breast invasive carcinoma | Female | <65 | I/II | Chemotherapy | adriamycin | CR |
| ABCA3 | SNV | Missense_Mutation | c.3043N>C | p.Glu1015Gln | p.E1015Q | Q99758 | protein_coding | tolerated(0.06) | possibly_damaging(0.549) | TCGA-A2-A0D0-01 | Breast | breast invasive carcinoma | Female | <65 | I/II | Chemotherapy | cytoxan | SD | |
| ABCA3 | SNV | Missense_Mutation | c.1915C>G | p.Gln639Glu | p.Q639E | Q99758 | protein_coding | tolerated(0.65) | benign(0.003) | TCGA-A8-A07R-01 | Breast | breast invasive carcinoma | Female | >=65 | III/IV | Ancillary | zoledronic | SD | |
| ABCA3 | SNV | Missense_Mutation | c.4178N>T | p.Arg1393Leu | p.R1393L | Q99758 | protein_coding | tolerated(0.62) | benign(0.051) | TCGA-A8-A09Z-01 | Breast | breast invasive carcinoma | Female | >=65 | I/II | Unknown | Unknown | SD | |
| ABCA3 | SNV | Missense_Mutation | c.3455N>G | p.Ser1152Cys | p.S1152C | Q99758 | protein_coding | tolerated(0.12) | benign(0.03) | TCGA-AC-A23H-01 | Breast | breast invasive carcinoma | Female | >=65 | I/II | Unknown | Unknown | PD | |
| ABCA3 | SNV | Missense_Mutation | c.3205N>T | p.His1069Tyr | p.H1069Y | Q99758 | protein_coding | deleterious(0.01) | benign(0) | TCGA-AC-A23H-01 | Breast | breast invasive carcinoma | Female | >=65 | I/II | Unknown | Unknown | PD | |
| ABCA3 | SNV | Missense_Mutation | c.1444N>G | p.Gln482Glu | p.Q482E | Q99758 | protein_coding | deleterious(0.01) | possibly_damaging(0.49) | TCGA-AC-A23H-01 | Breast | breast invasive carcinoma | Female | >=65 | I/II | Unknown | Unknown | PD | |
| ABCA3 | SNV | Missense_Mutation | novel | c.3157N>T | p.Ala1053Ser | p.A1053S | Q99758 | protein_coding | tolerated(0.45) | benign(0.086) | TCGA-AR-A250-01 | Breast | breast invasive carcinoma | Female | <65 | I/II | Chemotherapy | doxorubicin | SD |
| ABCA3 | SNV | Missense_Mutation | c.1339N>C | p.Phe447Leu | p.F447L | Q99758 | protein_coding | tolerated(0.26) | benign(0.282) | TCGA-AR-A251-01 | Breast | breast invasive carcinoma | Female | <65 | III/IV | Chemotherapy | doxorubicin | SD | |
| ABCA3 | SNV | Missense_Mutation | c.674A>G | p.Tyr225Cys | p.Y225C | Q99758 | protein_coding | deleterious(0) | probably_damaging(0.943) | TCGA-D8-A1XK-01 | Breast | breast invasive carcinoma | Female | <65 | I/II | Chemotherapy | doxorubicine+cyclophosphamide | SD |
| Page: 1 2 3 4 5 6 7 8 9 10 11 12 13 14 15 16 |
Top |
Related drugs of malignant transformation related genes |
| Identification of chemicals and drugs interact with genes involved in malignant transfromation |
| (DGIdb 4.0) |
| Entrez ID | Symbol | Category | Interaction Types | Drug Claim Name | Drug Name | PMIDs |
| Page: 1 |

Copyright 2023-Present -The University of Texas Health Science Center at Houston |