
|
|||||
|
 | |
| |
| |
| |
| |
| |
|
Gene: WDR1 |
Gene summary for WDR1 |
| Gene information | Species | Human | Gene symbol | WDR1 | Gene ID | 9948 |
| Gene name | WD repeat domain 1 | |
| Gene Alias | AIP1 | |
| Cytomap | 4p16.1 | |
| Gene Type | protein-coding | GO ID | GO:0000902 | UniProtAcc | O75083 |
Top |
Malignant transformation analysis |
| Identification of the aberrant gene expression in precancerous and cancerous lesions by comparing the gene expression of stem-like cells in diseased tissues with normal stem cells |
| Entrez ID | Symbol | Replicates | Species | Organ | Tissue | Adj P-value | Log2FC | Malignancy |
| 9948 | WDR1 | HTA11_2487_2000001011 | Human | Colorectum | SER | 3.50e-12 | 7.03e-01 | -0.1808 |
| 9948 | WDR1 | HTA11_1938_2000001011 | Human | Colorectum | AD | 5.16e-12 | 7.43e-01 | -0.0811 |
| 9948 | WDR1 | HTA11_78_2000001011 | Human | Colorectum | AD | 2.16e-09 | 5.47e-01 | -0.1088 |
| 9948 | WDR1 | HTA11_347_2000001011 | Human | Colorectum | AD | 1.84e-26 | 7.52e-01 | -0.1954 |
| 9948 | WDR1 | HTA11_411_2000001011 | Human | Colorectum | SER | 1.94e-10 | 1.37e+00 | -0.2602 |
| 9948 | WDR1 | HTA11_2112_2000001011 | Human | Colorectum | SER | 1.18e-05 | 8.15e-01 | -0.2196 |
| 9948 | WDR1 | HTA11_3361_2000001011 | Human | Colorectum | AD | 3.25e-02 | 4.03e-01 | -0.1207 |
| 9948 | WDR1 | HTA11_83_2000001011 | Human | Colorectum | SER | 2.23e-05 | 6.57e-01 | -0.1526 |
| 9948 | WDR1 | HTA11_696_2000001011 | Human | Colorectum | AD | 2.50e-17 | 6.21e-01 | -0.1464 |
| 9948 | WDR1 | HTA11_866_2000001011 | Human | Colorectum | AD | 1.94e-05 | 2.52e-01 | -0.1001 |
| 9948 | WDR1 | HTA11_1391_2000001011 | Human | Colorectum | AD | 1.98e-15 | 8.14e-01 | -0.059 |
| 9948 | WDR1 | HTA11_2992_2000001011 | Human | Colorectum | SER | 3.65e-09 | 1.11e+00 | -0.1706 |
| 9948 | WDR1 | HTA11_5212_2000001011 | Human | Colorectum | AD | 1.39e-06 | 7.70e-01 | -0.2061 |
| 9948 | WDR1 | HTA11_7862_2000001011 | Human | Colorectum | AD | 1.04e-02 | 3.81e-01 | -0.0179 |
| 9948 | WDR1 | HTA11_866_3004761011 | Human | Colorectum | AD | 9.23e-09 | 4.61e-01 | 0.096 |
| 9948 | WDR1 | HTA11_10623_2000001011 | Human | Colorectum | AD | 4.16e-02 | 4.75e-01 | -0.0177 |
| 9948 | WDR1 | HTA11_6801_2000001011 | Human | Colorectum | SER | 1.82e-05 | 8.33e-01 | 0.0171 |
| 9948 | WDR1 | HTA11_7696_3000711011 | Human | Colorectum | AD | 1.66e-10 | 4.19e-01 | 0.0674 |
| 9948 | WDR1 | HTA11_99999970781_79442 | Human | Colorectum | MSS | 8.51e-15 | 4.73e-01 | 0.294 |
| 9948 | WDR1 | HTA11_99999965104_69814 | Human | Colorectum | MSS | 8.57e-10 | 5.91e-01 | 0.281 |
| Page: 1 2 3 4 5 6 7 8 |
| Tissue | Expression Dynamics | Abbreviation |
| Colorectum (GSE201348) |  | FAP: Familial adenomatous polyposis |
| CRC: Colorectal cancer | ||
| Colorectum (HTA11) |  | AD: Adenomas |
| SER: Sessile serrated lesions | ||
| MSI-H: Microsatellite-high colorectal cancer | ||
| MSS: Microsatellite stable colorectal cancer | ||
| Esophagus |  | ESCC: Esophageal squamous cell carcinoma |
| HGIN: High-grade intraepithelial neoplasias | ||
| LGIN: Low-grade intraepithelial neoplasias | ||
| Liver | 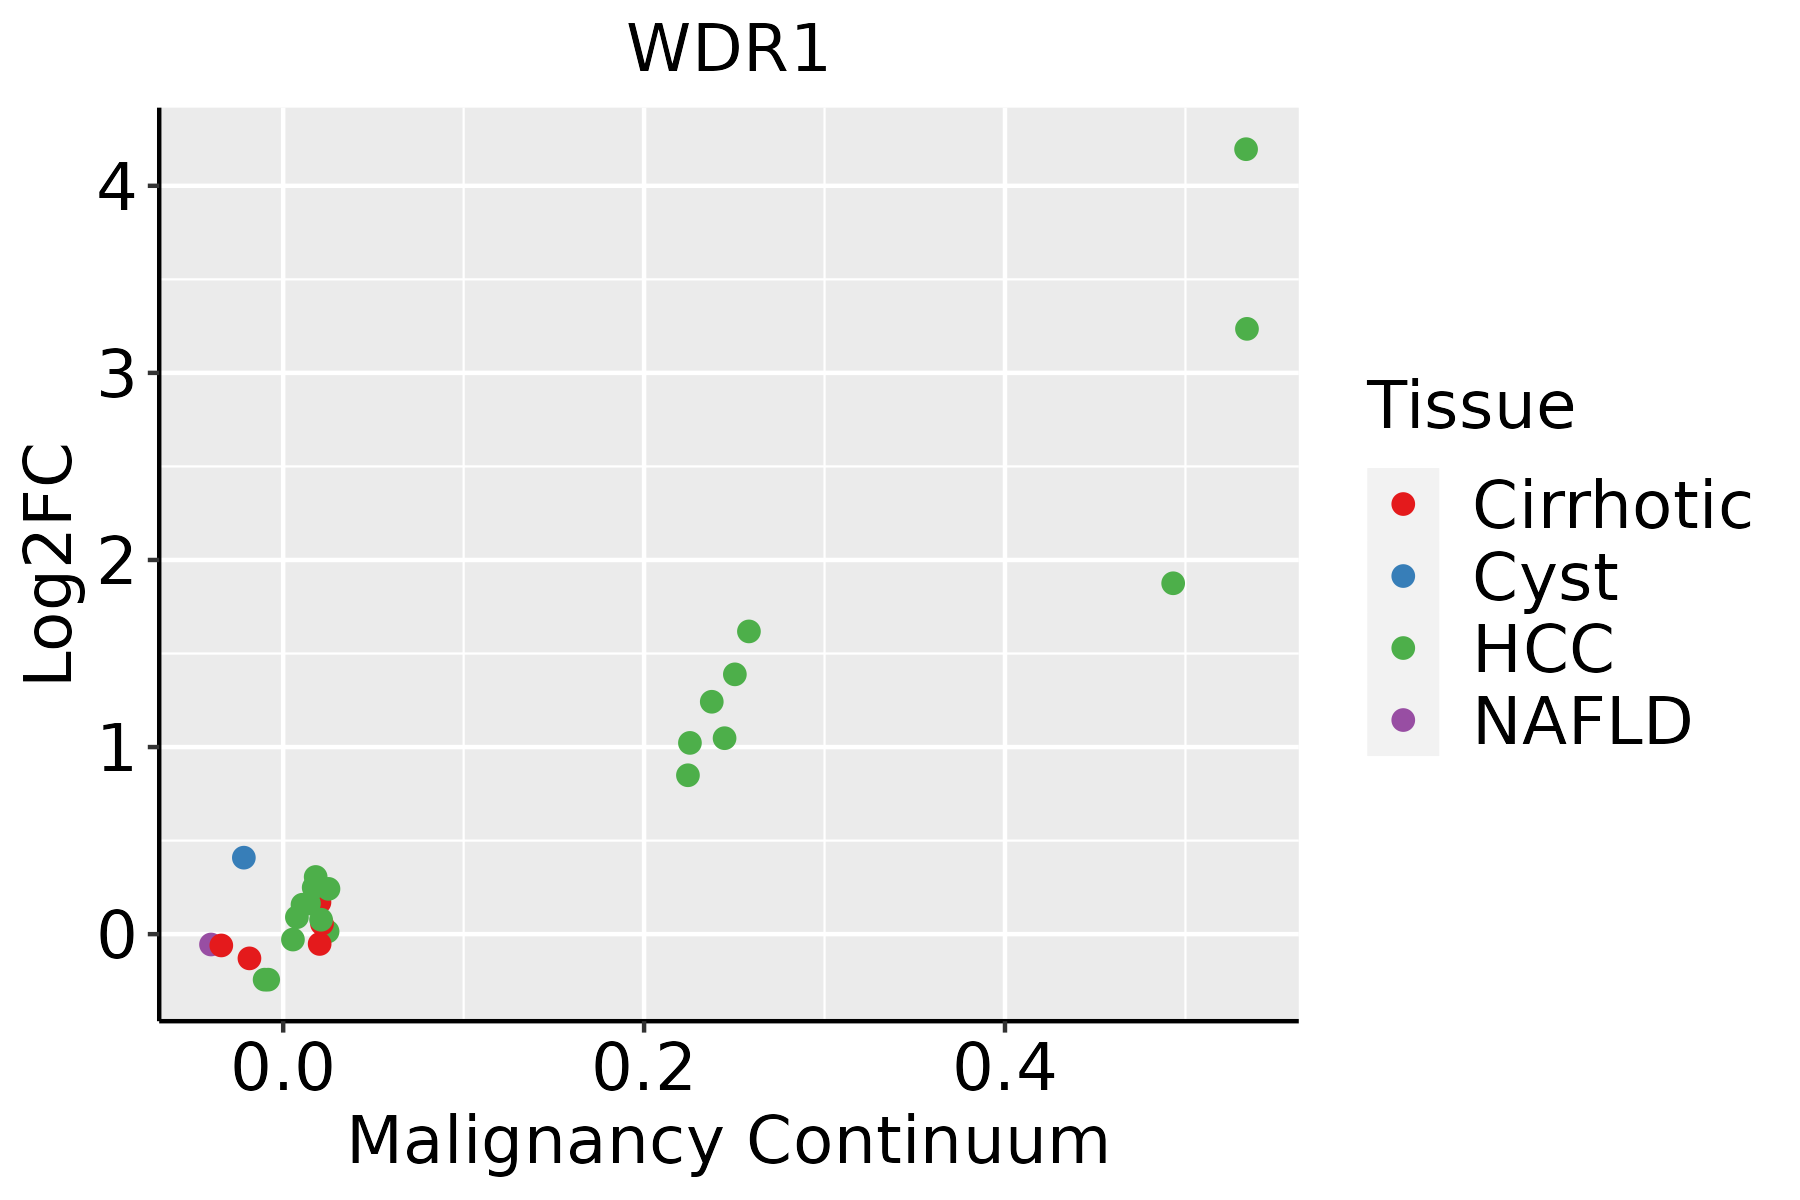 | HCC: Hepatocellular carcinoma |
| NAFLD: Non-alcoholic fatty liver disease | ||
| Oral Cavity | 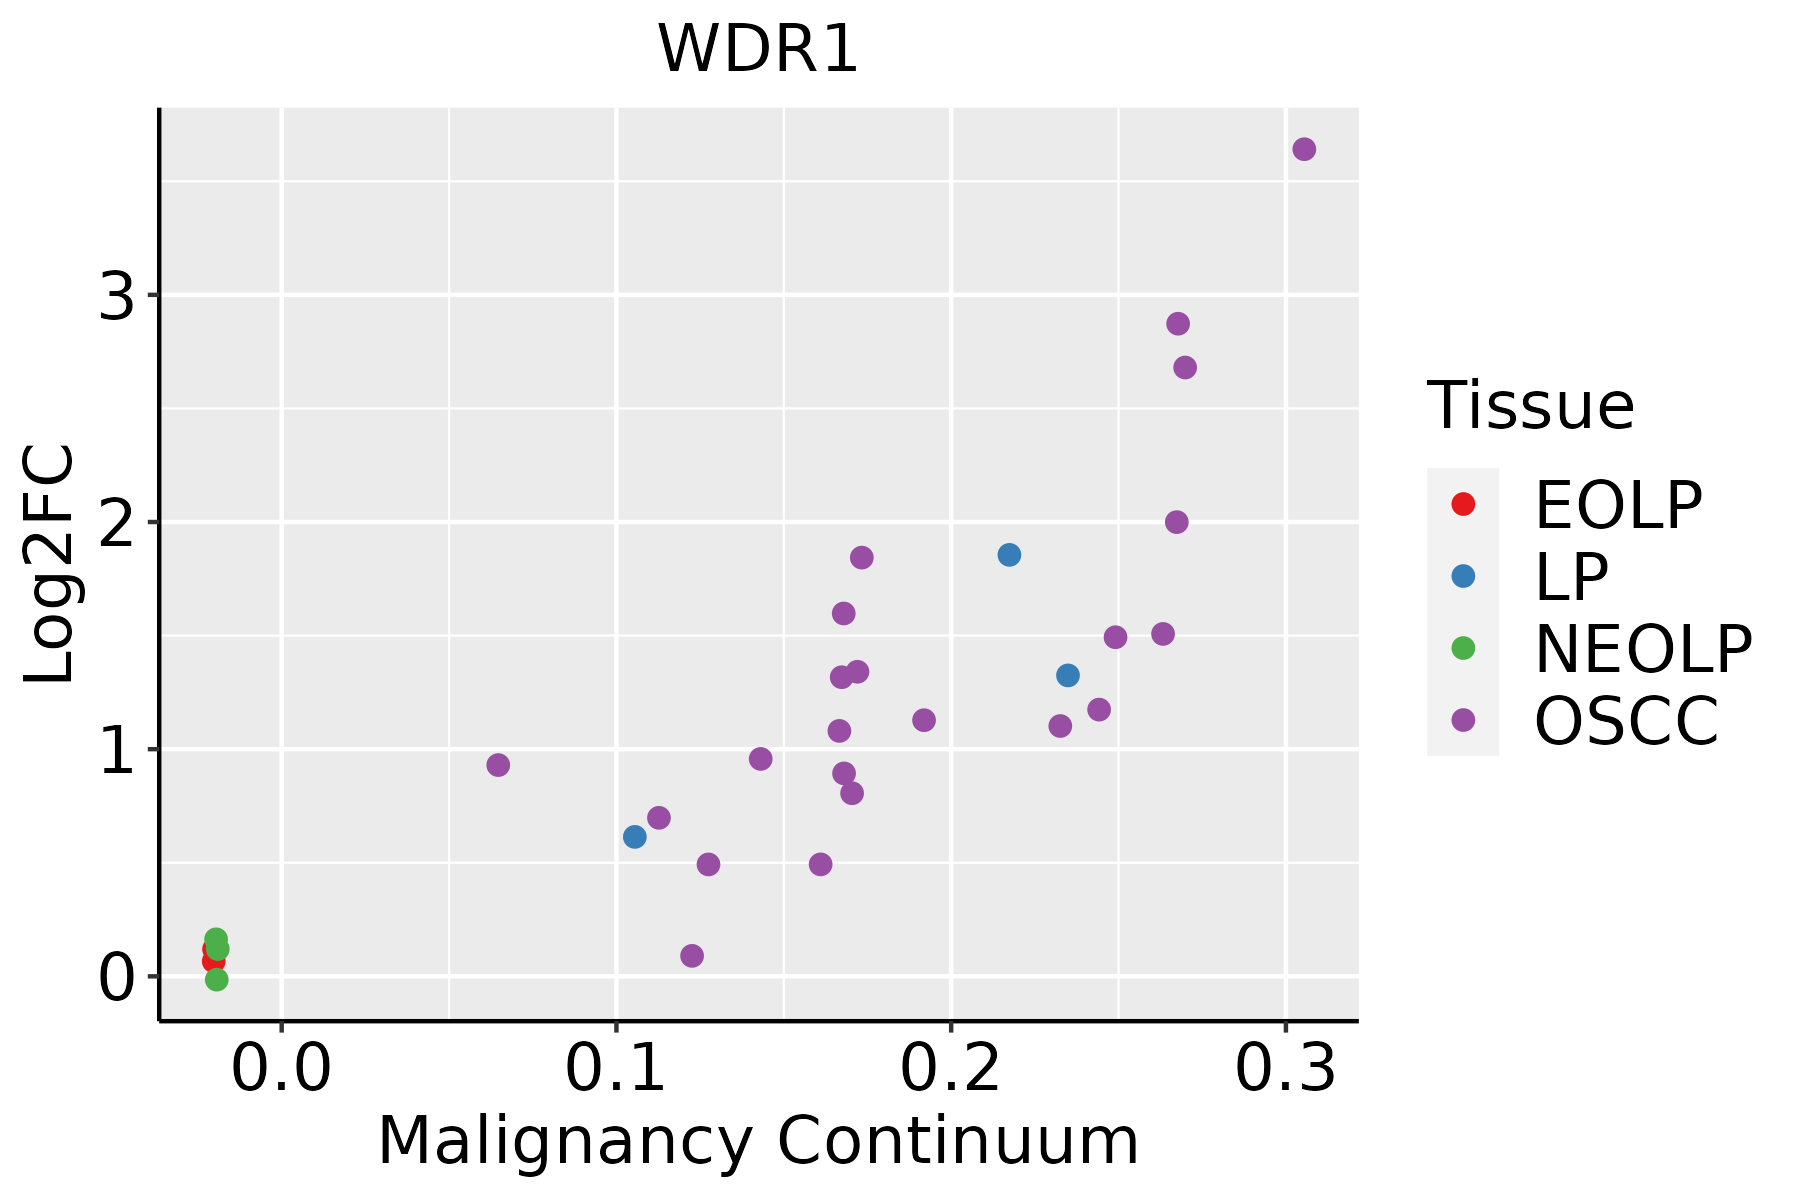 | EOLP: Erosive Oral lichen planus |
| LP: leukoplakia | ||
| NEOLP: Non-erosive oral lichen planus | ||
| OSCC: Oral squamous cell carcinoma | ||
| Skin | 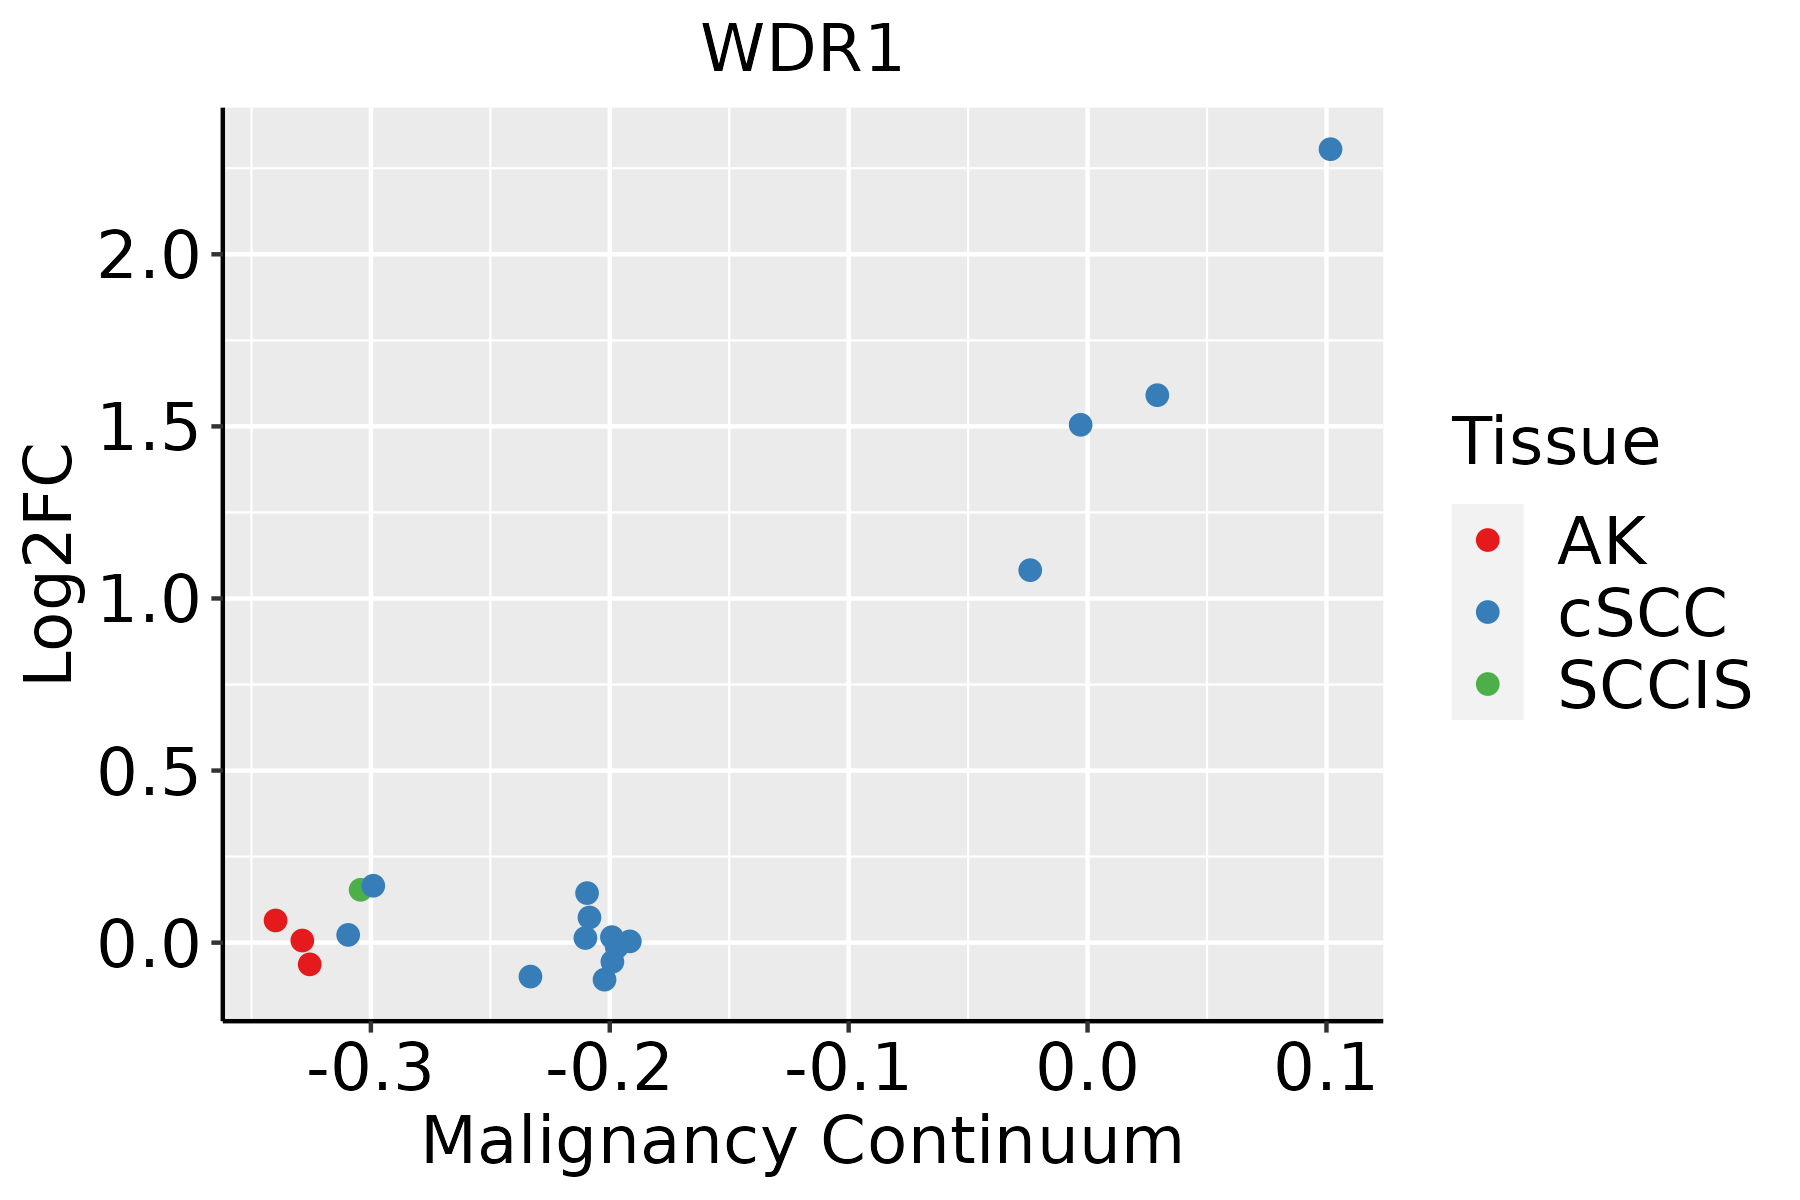 | AK: Actinic keratosis |
| cSCC: Cutaneous squamous cell carcinoma | ||
| SCCIS:squamous cell carcinoma in situ | ||
| Thyroid | 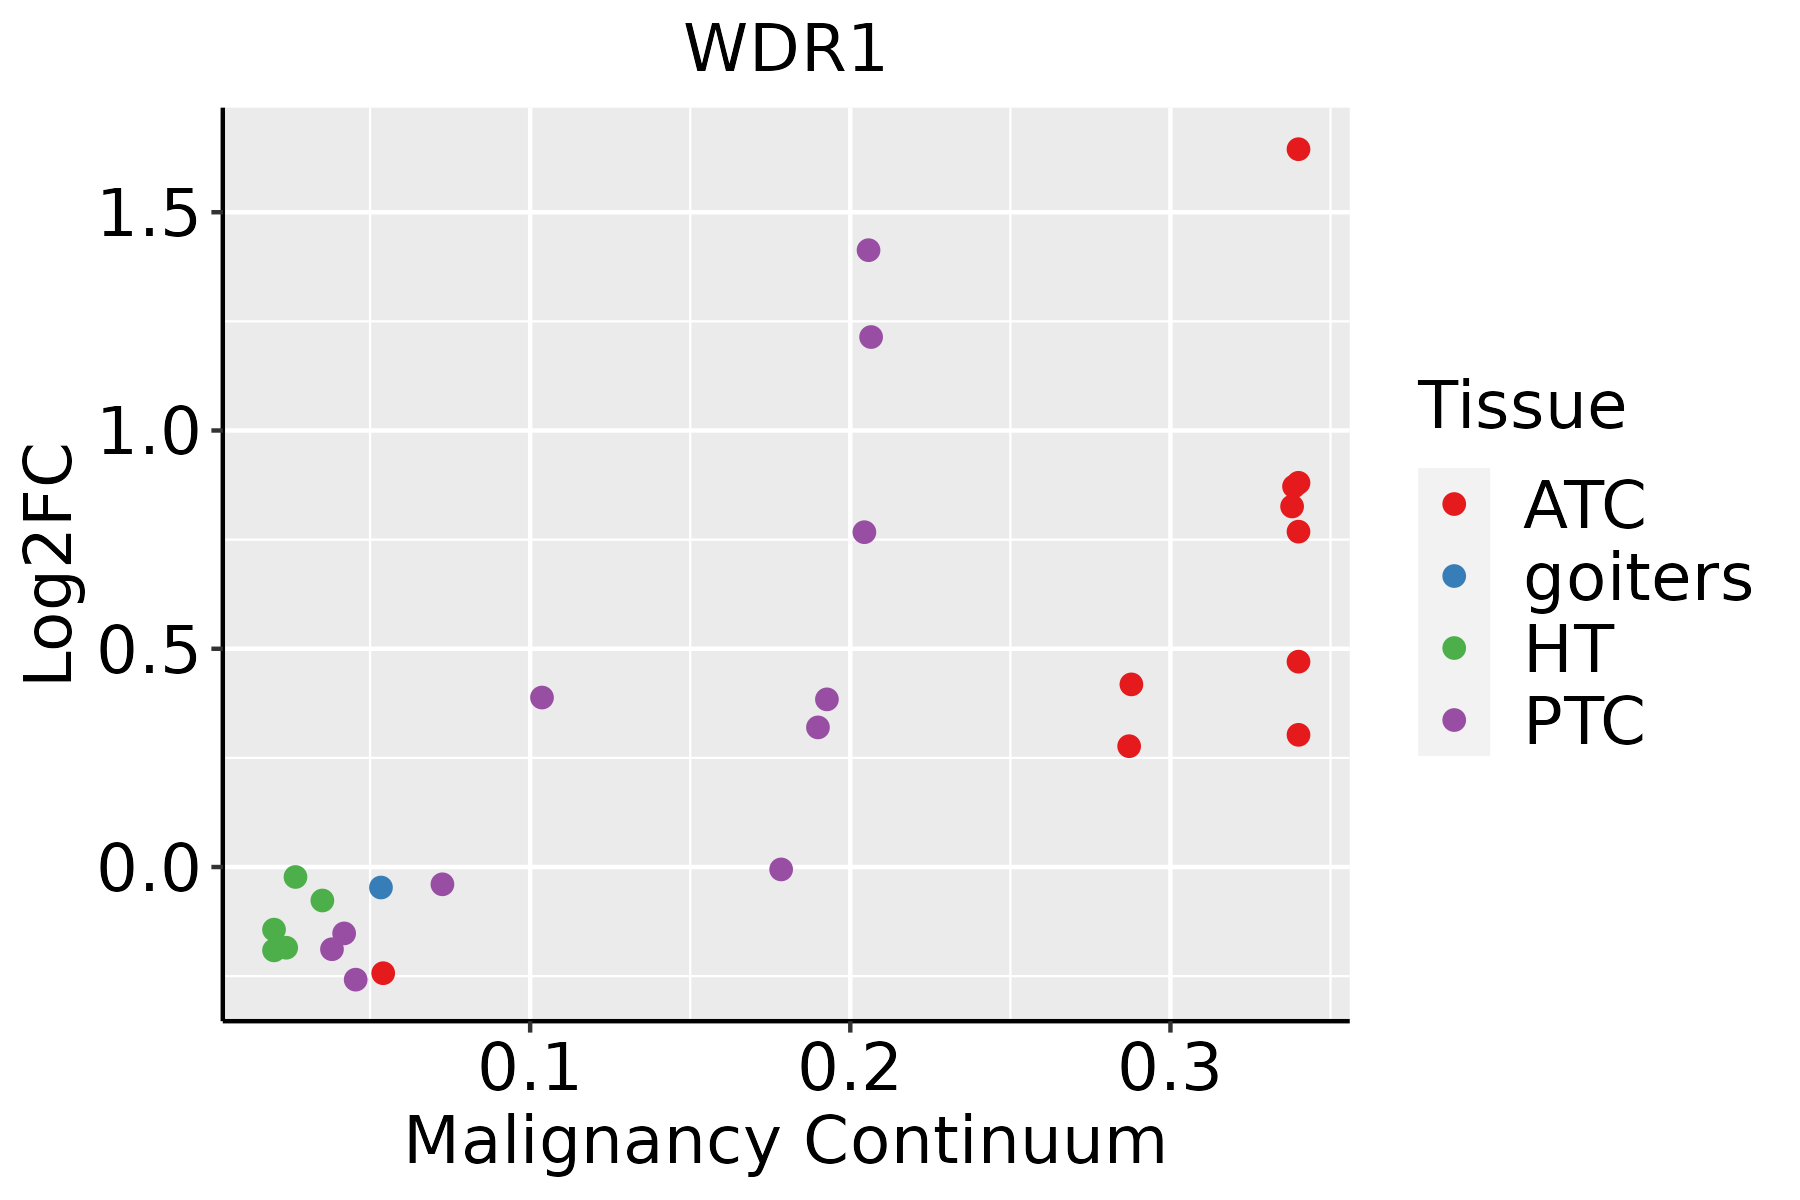 | ATC: Anaplastic thyroid cancer |
| HT: Hashimoto's thyroiditis | ||
| PTC: Papillary thyroid cancer |
| ∗log2FC in expression of this searched gene in stem-like cells from each diseased tissue sample relative to stem-like cells in normal samples in each tissue plotted against the malignancy continuum. Samples are colored based on if they are from different disease stage. |
Top |
Malignant transformation related pathway analysis |
| Find out the enriched GO biological processes and KEGG pathways involved in transition from healthy to precancer to cancer |
| Tissue | Disease Stage | Enriched GO biological Processes |
| Colorectum | AD |  |
| Colorectum | SER |  |
| Colorectum | MSS |  |
| Colorectum | MSI-H |  |
| Colorectum | FAP |  |
| ∗Top 15 enriched GO BP terms are showed in the bar plot of each disease state in each tissue. Each row represents a significant GO biological process which is colored according to the -log10(p.adjust). |
| Page: 1 2 3 4 5 6 7 8 9 |
| GO ID | Tissue | Disease Stage | Description | Gene Ratio | Bg Ratio | pvalue | p.adjust | Count |
| GO:00062756 | Thyroid | ATC | regulation of DNA replication | 50/6293 | 107/18723 | 3.25e-03 | 1.46e-02 | 50 |
| GO:004519715 | Thyroid | ATC | establishment or maintenance of epithelial cell apical/basal polarity | 24/6293 | 44/18723 | 3.39e-03 | 1.52e-02 | 24 |
| GO:0050673111 | Thyroid | ATC | epithelial cell proliferation | 174/6293 | 437/18723 | 3.49e-03 | 1.55e-02 | 174 |
| GO:004329722 | Thyroid | ATC | apical junction assembly | 38/6293 | 78/18723 | 4.03e-03 | 1.73e-02 | 38 |
| GO:0050678110 | Thyroid | ATC | regulation of epithelial cell proliferation | 151/6293 | 381/18723 | 7.47e-03 | 2.92e-02 | 151 |
| GO:003083413 | Thyroid | ATC | regulation of actin filament depolymerization | 27/6293 | 54/18723 | 9.25e-03 | 3.44e-02 | 27 |
| GO:009902211 | Thyroid | ATC | vesicle tethering | 8/6293 | 11/18723 | 9.31e-03 | 3.44e-02 | 8 |
| GO:0007224 | Thyroid | ATC | smoothened signaling pathway | 60/6293 | 138/18723 | 9.75e-03 | 3.57e-02 | 60 |
| GO:00017363 | Thyroid | ATC | establishment of planar polarity | 34/6293 | 72/18723 | 1.13e-02 | 4.05e-02 | 34 |
| GO:00071643 | Thyroid | ATC | establishment of tissue polarity | 34/6293 | 72/18723 | 1.13e-02 | 4.05e-02 | 34 |
| Page: 1 2 3 4 5 6 7 8 9 10 11 12 13 14 15 16 17 18 19 20 21 22 23 24 25 26 27 28 29 |
| Pathway ID | Tissue | Disease Stage | Description | Gene Ratio | Bg Ratio | pvalue | p.adjust | qvalue | Count |
| Page: 1 |
Top |
Cell-cell communication analysis |
| Identification of potential cell-cell interactions between two cell types and their ligand-receptor pairs for different disease states |
| Ligand | Receptor | LRpair | Pathway | Tissue | Disease Stage |
| Page: 1 |
Top |
Single-cell gene regulatory network inference analysis |
| Find out the significant the regulons (TFs) and the target genes of each regulon across cell types for different disease states |
| TF | Cell Type | Tissue | Disease Stage | Target Gene | RSS | Regulon Activity |
| ∗The dot plots of a searched regulon are shown for all cell subpopulations in each disease state of each tissue based on the regulon specific score inferred using pySCENIC and by calculating the average expression. |
| Page: 1 |
Top |
Somatic mutation of malignant transformation related genes |
| Annotation of somatic variants for genes involved in malignant transformation |
| Hugo Symbol | Variant Class | Variant Classification | dbSNP RS | HGVSc | HGVSp | HGVSp Short | SWISSPROT | BIOTYPE | SIFT | PolyPhen | Tumor Sample Barcode | Tissue | Histology | Sex | Age | Stage | Therapy Types | Drugs | Outcome |
| WDR1 | SNV | Missense_Mutation | novel | c.1043N>G | p.Tyr348Cys | p.Y348C | O75083 | protein_coding | tolerated(0.14) | possibly_damaging(0.807) | TCGA-BH-A0BA-01 | Breast | breast invasive carcinoma | Female | <65 | III/IV | Chemotherapy | cytoxan | SD |
| WDR1 | SNV | Missense_Mutation | novel | c.1041N>G | p.Asn347Lys | p.N347K | O75083 | protein_coding | tolerated(0.3) | possibly_damaging(0.739) | TCGA-BH-A0BA-01 | Breast | breast invasive carcinoma | Female | <65 | III/IV | Chemotherapy | cytoxan | SD |
| WDR1 | SNV | Missense_Mutation | c.1606N>C | p.Val536Leu | p.V536L | O75083 | protein_coding | tolerated(0.11) | benign(0.02) | TCGA-D8-A1JG-01 | Breast | breast invasive carcinoma | Female | <65 | I/II | Chemotherapy | doxorubicin | SD | |
| WDR1 | deletion | Frame_Shift_Del | novel | c.748delN | p.Leu250PhefsTer16 | p.L250Ffs*16 | O75083 | protein_coding | TCGA-GI-A2C9-01 | Breast | breast invasive carcinoma | Female | <65 | I/II | Unspecific | SD | |||
| WDR1 | SNV | Missense_Mutation | novel | c.532C>T | p.Pro178Ser | p.P178S | O75083 | protein_coding | deleterious(0) | benign(0.03) | TCGA-2W-A8YY-01 | Cervix | cervical & endocervical cancer | Female | <65 | I/II | Chemotherapy | cisplatin | CR |
| WDR1 | SNV | Missense_Mutation | rs545497657 | c.700G>A | p.Asp234Asn | p.D234N | O75083 | protein_coding | tolerated(0.49) | benign(0.011) | TCGA-HM-A4S6-01 | Cervix | cervical & endocervical cancer | Female | <65 | III/IV | Chemotherapy | cisplatin | CR |
| WDR1 | SNV | Missense_Mutation | rs868174972 | c.200N>T | p.Ala67Val | p.A67V | O75083 | protein_coding | deleterious(0.01) | benign(0.343) | TCGA-AA-3864-01 | Colorectum | colon adenocarcinoma | Male | >=65 | I/II | Unknown | Unknown | SD |
| WDR1 | SNV | Missense_Mutation | novel | c.638N>C | p.Ile213Thr | p.I213T | O75083 | protein_coding | deleterious(0.01) | possibly_damaging(0.493) | TCGA-AA-A010-01 | Colorectum | colon adenocarcinoma | Female | <65 | I/II | Chemotherapy | folinic | CR |
| WDR1 | SNV | Missense_Mutation | c.1319N>A | p.Ser440Asn | p.S440N | O75083 | protein_coding | tolerated(0.11) | benign(0) | TCGA-AA-A01P-01 | Colorectum | colon adenocarcinoma | Female | >=65 | III/IV | Unknown | Unknown | PD | |
| WDR1 | SNV | Missense_Mutation | rs370326840 | c.1222G>A | p.Val408Ile | p.V408I | O75083 | protein_coding | tolerated(0.4) | benign(0) | TCGA-AD-6889-01 | Colorectum | colon adenocarcinoma | Male | >=65 | I/II | Chemotherapy | xeloda | PD |
| Page: 1 2 3 4 5 6 7 |
Top |
Related drugs of malignant transformation related genes |
| Identification of chemicals and drugs interact with genes involved in malignant transfromation |
| (DGIdb 4.0) |
| Entrez ID | Symbol | Category | Interaction Types | Drug Claim Name | Drug Name | PMIDs |
| Page: 1 |

Copyright 2023-Present -The University of Texas Health Science Center at Houston |