
|
|||||
|
 | |
| |
| |
| |
| |
| |
|
Gene: VPS35 |
Gene summary for VPS35 |
| Gene information | Species | Human | Gene symbol | VPS35 | Gene ID | 55737 |
| Gene name | VPS35 retromer complex component | |
| Gene Alias | MEM3 | |
| Cytomap | 16q11.2 | |
| Gene Type | protein-coding | GO ID | GO:0000266 | UniProtAcc | Q96QK1 |
Top |
Malignant transformation analysis |
| Identification of the aberrant gene expression in precancerous and cancerous lesions by comparing the gene expression of stem-like cells in diseased tissues with normal stem cells |
| Entrez ID | Symbol | Replicates | Species | Organ | Tissue | Adj P-value | Log2FC | Malignancy |
| 55737 | VPS35 | HTA11_1938_2000001011 | Human | Colorectum | AD | 5.15e-04 | 4.80e-01 | -0.0811 |
| 55737 | VPS35 | HTA11_78_2000001011 | Human | Colorectum | AD | 3.01e-07 | 5.20e-01 | -0.1088 |
| 55737 | VPS35 | HTA11_347_2000001011 | Human | Colorectum | AD | 8.49e-16 | 5.65e-01 | -0.1954 |
| 55737 | VPS35 | HTA11_6801_2000001011 | Human | Colorectum | SER | 1.96e-03 | 6.25e-01 | 0.0171 |
| 55737 | VPS35 | HTA11_99999970781_79442 | Human | Colorectum | MSS | 6.06e-06 | 5.11e-01 | 0.294 |
| 55737 | VPS35 | HTA11_99999965104_69814 | Human | Colorectum | MSS | 3.74e-14 | 9.51e-01 | 0.281 |
| 55737 | VPS35 | HTA11_99999971662_82457 | Human | Colorectum | MSS | 3.13e-04 | 4.63e-01 | 0.3859 |
| 55737 | VPS35 | A015-C-203 | Human | Colorectum | FAP | 1.32e-07 | -7.45e-02 | -0.1294 |
| 55737 | VPS35 | A002-C-201 | Human | Colorectum | FAP | 3.82e-02 | -1.29e-01 | 0.0324 |
| 55737 | VPS35 | A001-C-108 | Human | Colorectum | FAP | 1.61e-03 | -7.15e-02 | -0.0272 |
| 55737 | VPS35 | A002-C-205 | Human | Colorectum | FAP | 4.61e-05 | -2.50e-02 | -0.1236 |
| 55737 | VPS35 | A015-C-006 | Human | Colorectum | FAP | 7.13e-03 | -9.74e-02 | -0.0994 |
| 55737 | VPS35 | A002-C-114 | Human | Colorectum | FAP | 6.16e-04 | 4.67e-03 | -0.1561 |
| 55737 | VPS35 | A015-C-104 | Human | Colorectum | FAP | 5.04e-10 | -3.78e-02 | -0.1899 |
| 55737 | VPS35 | A002-C-016 | Human | Colorectum | FAP | 2.34e-03 | -9.22e-02 | 0.0521 |
| 55737 | VPS35 | A015-C-002 | Human | Colorectum | FAP | 4.12e-02 | 8.22e-02 | -0.0763 |
| 55737 | VPS35 | A002-C-116 | Human | Colorectum | FAP | 2.35e-11 | -7.03e-02 | -0.0452 |
| 55737 | VPS35 | A014-C-008 | Human | Colorectum | FAP | 1.33e-02 | 6.47e-02 | -0.191 |
| 55737 | VPS35 | A018-E-020 | Human | Colorectum | FAP | 2.69e-03 | -4.56e-02 | -0.2034 |
| 55737 | VPS35 | F034 | Human | Colorectum | FAP | 1.60e-05 | 1.29e-03 | -0.0665 |
| Page: 1 2 3 4 5 6 7 8 |
| Tissue | Expression Dynamics | Abbreviation |
| Colorectum (GSE201348) |  | FAP: Familial adenomatous polyposis |
| CRC: Colorectal cancer | ||
| Colorectum (HTA11) |  | AD: Adenomas |
| SER: Sessile serrated lesions | ||
| MSI-H: Microsatellite-high colorectal cancer | ||
| MSS: Microsatellite stable colorectal cancer | ||
| Esophagus | 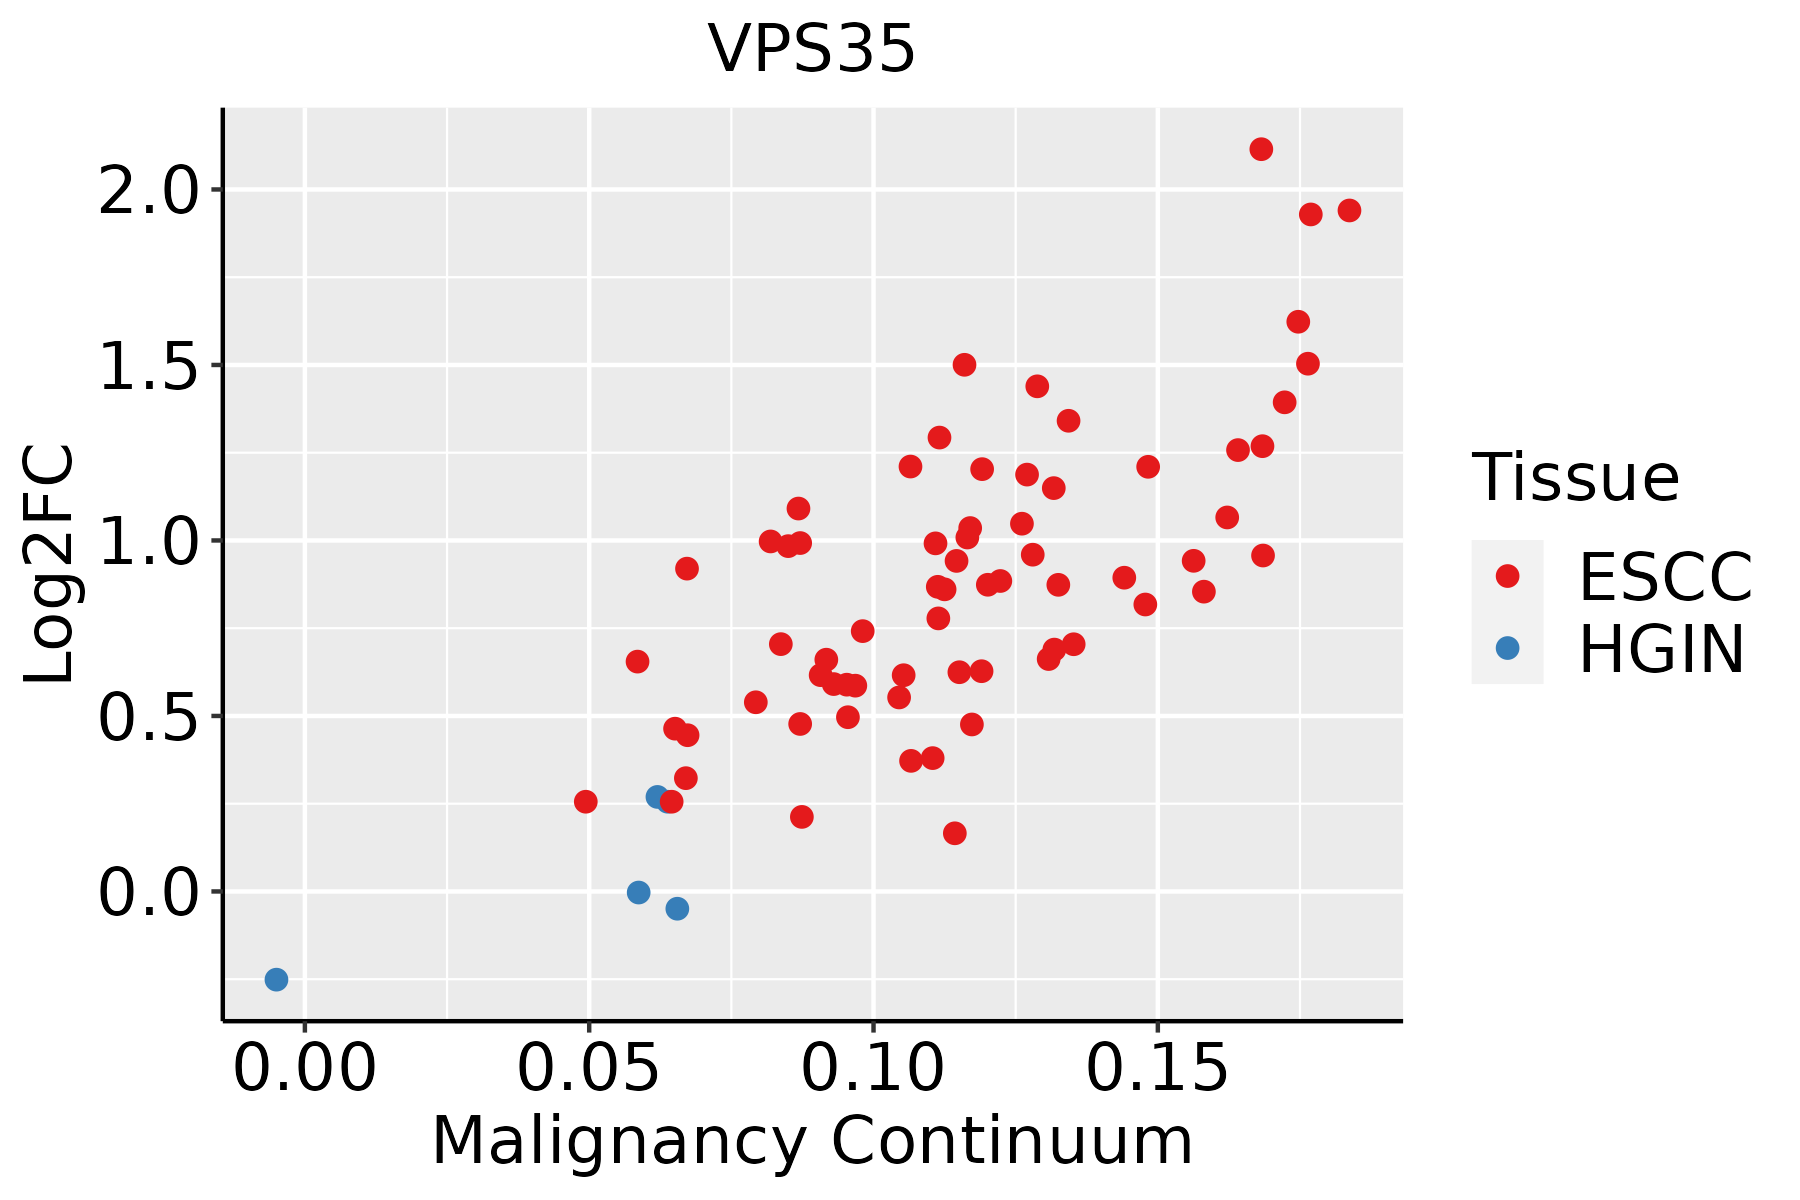 | ESCC: Esophageal squamous cell carcinoma |
| HGIN: High-grade intraepithelial neoplasias | ||
| LGIN: Low-grade intraepithelial neoplasias | ||
| Liver |  | HCC: Hepatocellular carcinoma |
| NAFLD: Non-alcoholic fatty liver disease | ||
| Oral Cavity |  | EOLP: Erosive Oral lichen planus |
| LP: leukoplakia | ||
| NEOLP: Non-erosive oral lichen planus | ||
| OSCC: Oral squamous cell carcinoma | ||
| Prostate |  | BPH: Benign Prostatic Hyperplasia |
| Skin | 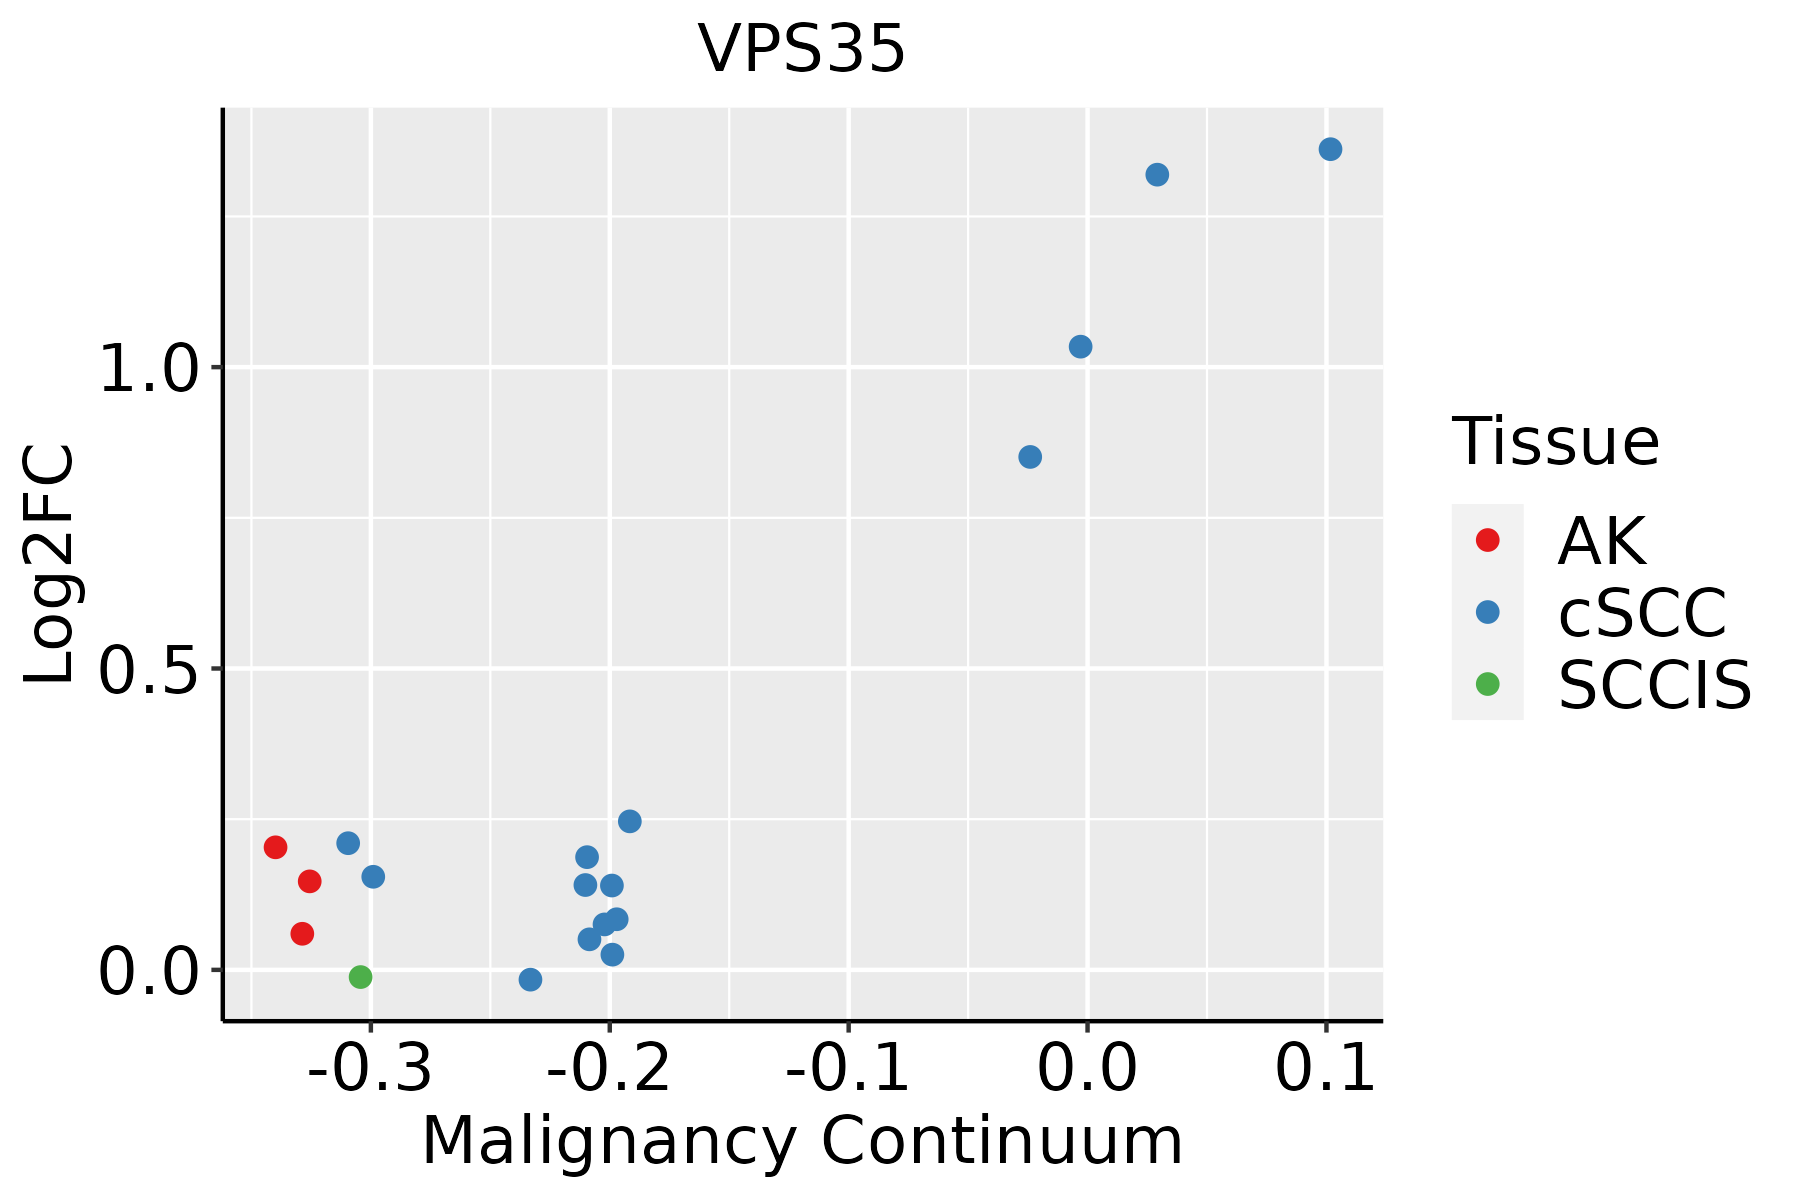 | AK: Actinic keratosis |
| cSCC: Cutaneous squamous cell carcinoma | ||
| SCCIS:squamous cell carcinoma in situ | ||
| Thyroid | 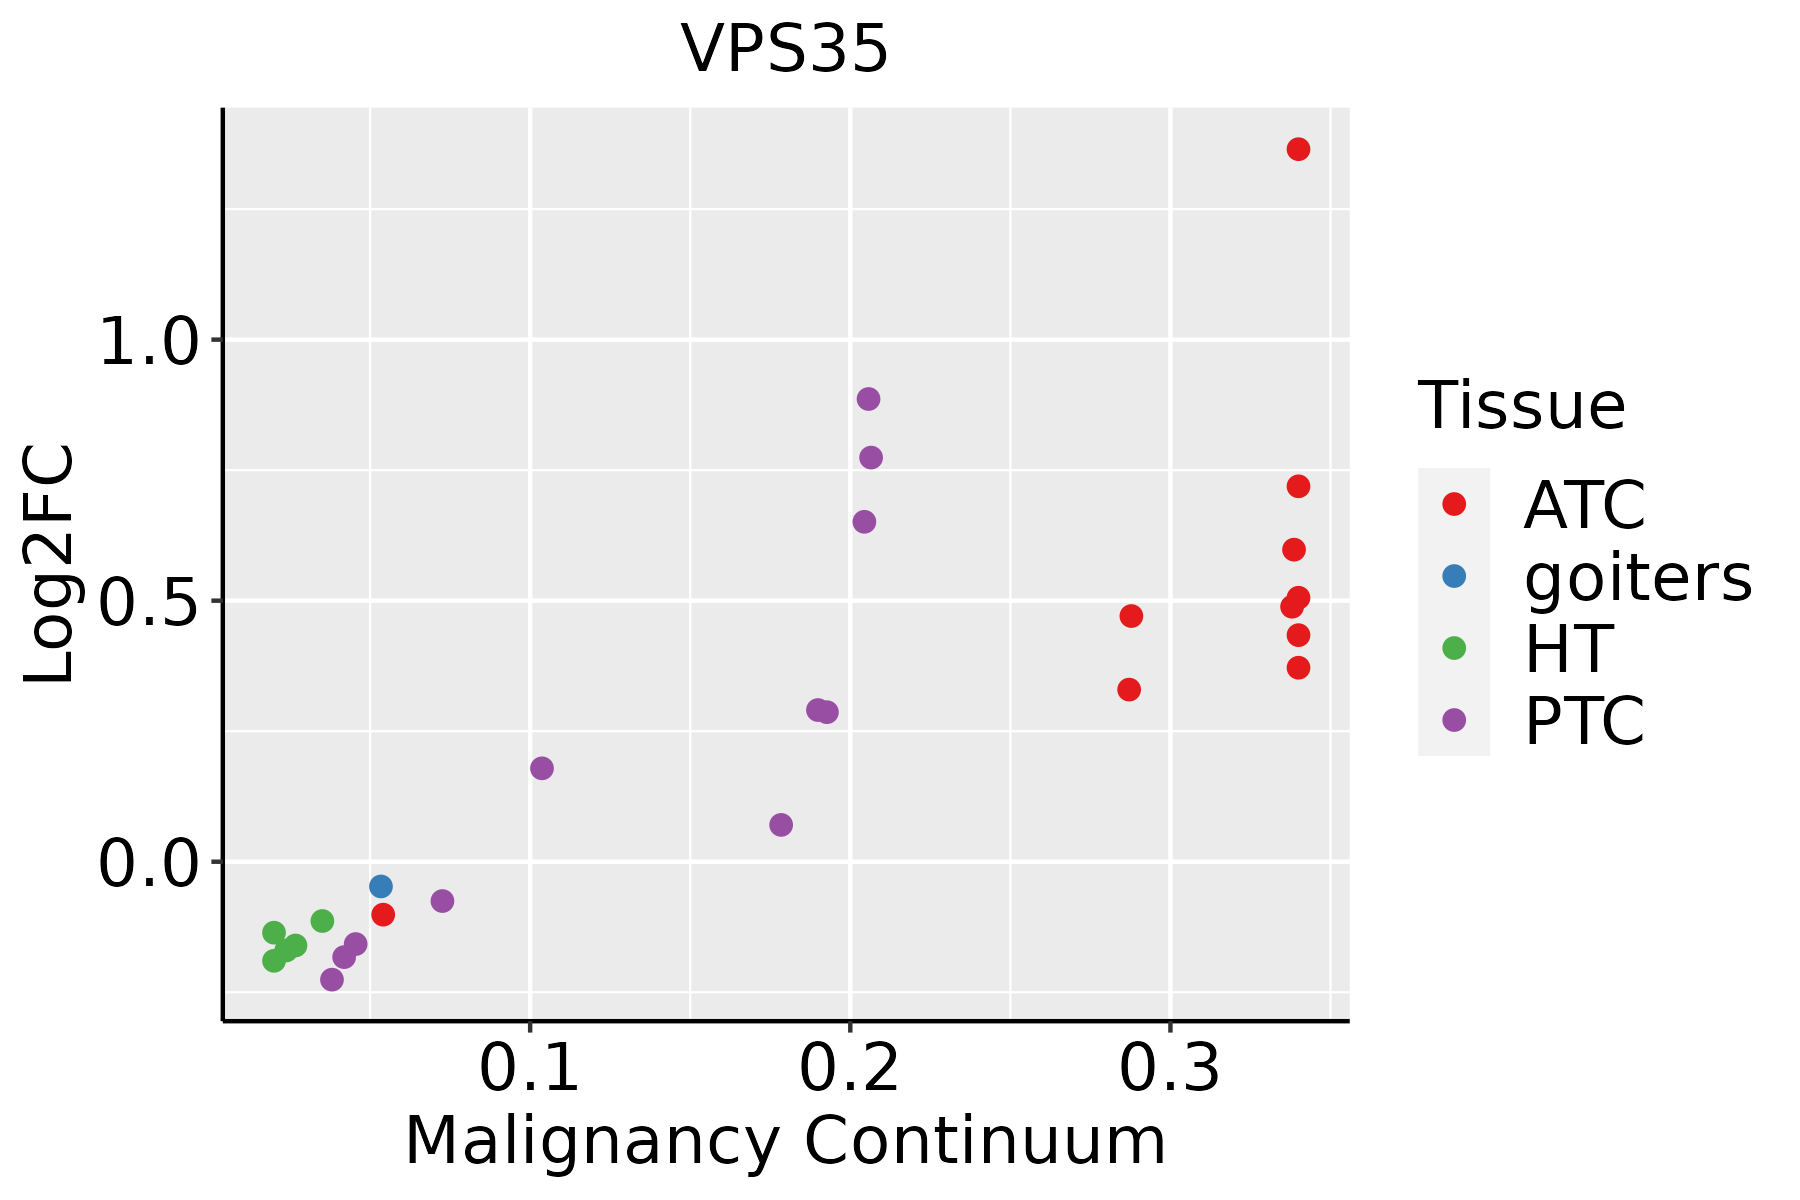 | ATC: Anaplastic thyroid cancer |
| HT: Hashimoto's thyroiditis | ||
| PTC: Papillary thyroid cancer |
| ∗log2FC in expression of this searched gene in stem-like cells from each diseased tissue sample relative to stem-like cells in normal samples in each tissue plotted against the malignancy continuum. Samples are colored based on if they are from different disease stage. |
Top |
Malignant transformation related pathway analysis |
| Find out the enriched GO biological processes and KEGG pathways involved in transition from healthy to precancer to cancer |
| Tissue | Disease Stage | Enriched GO biological Processes |
| Colorectum | AD |  |
| Colorectum | SER |  |
| Colorectum | MSS |  |
| Colorectum | MSI-H |  |
| Colorectum | FAP |  |
| ∗Top 15 enriched GO BP terms are showed in the bar plot of each disease state in each tissue. Each row represents a significant GO biological process which is colored according to the -log10(p.adjust). |
| Page: 1 2 3 4 5 6 7 8 9 |
| GO ID | Tissue | Disease Stage | Description | Gene Ratio | Bg Ratio | pvalue | p.adjust | Count |
| GO:0045732210 | Thyroid | ATC | positive regulation of protein catabolic process | 148/6293 | 231/18723 | 1.93e-21 | 4.36e-19 | 148 |
| GO:190336434 | Thyroid | ATC | positive regulation of cellular protein catabolic process | 109/6293 | 155/18723 | 8.26e-21 | 1.49e-18 | 109 |
| GO:003164734 | Thyroid | ATC | regulation of protein stability | 177/6293 | 298/18723 | 4.08e-20 | 6.46e-18 | 177 |
| GO:001623623 | Thyroid | ATC | macroautophagy | 169/6293 | 291/18723 | 6.56e-18 | 7.69e-16 | 169 |
| GO:001050632 | Thyroid | ATC | regulation of autophagy | 180/6293 | 317/18723 | 1.34e-17 | 1.46e-15 | 180 |
| GO:000683929 | Thyroid | ATC | mitochondrial transport | 151/6293 | 254/18723 | 2.07e-17 | 2.14e-15 | 151 |
| GO:001605525 | Thyroid | ATC | Wnt signaling pathway | 234/6293 | 444/18723 | 4.64e-17 | 4.31e-15 | 234 |
| GO:019873825 | Thyroid | ATC | cell-cell signaling by wnt | 234/6293 | 446/18723 | 9.26e-17 | 8.25e-15 | 234 |
| GO:007265928 | Thyroid | ATC | protein localization to plasma membrane | 161/6293 | 284/18723 | 8.45e-16 | 6.52e-14 | 161 |
| GO:009015031 | Thyroid | ATC | establishment of protein localization to membrane | 150/6293 | 260/18723 | 1.05e-15 | 7.96e-14 | 150 |
| GO:199077826 | Thyroid | ATC | protein localization to cell periphery | 181/6293 | 333/18723 | 3.72e-15 | 2.56e-13 | 181 |
| GO:001619719 | Thyroid | ATC | endosomal transport | 128/6293 | 230/18723 | 4.44e-12 | 1.75e-10 | 128 |
| GO:001624115 | Thyroid | ATC | regulation of macroautophagy | 86/6293 | 141/18723 | 2.35e-11 | 8.24e-10 | 86 |
| GO:004828512 | Thyroid | ATC | organelle fission | 229/6293 | 488/18723 | 4.79e-10 | 1.29e-08 | 229 |
| GO:0070997210 | Thyroid | ATC | neuron death | 176/6293 | 361/18723 | 1.43e-09 | 3.57e-08 | 176 |
| GO:000703423 | Thyroid | ATC | vacuolar transport | 89/6293 | 157/18723 | 2.26e-09 | 5.40e-08 | 89 |
| GO:001648218 | Thyroid | ATC | cytosolic transport | 93/6293 | 168/18723 | 5.19e-09 | 1.15e-07 | 93 |
| GO:0010821112 | Thyroid | ATC | regulation of mitochondrion organization | 82/6293 | 144/18723 | 7.15e-09 | 1.54e-07 | 82 |
| GO:190121428 | Thyroid | ATC | regulation of neuron death | 156/6293 | 319/18723 | 9.30e-09 | 1.96e-07 | 156 |
| GO:009887619 | Thyroid | ATC | vesicle-mediated transport to the plasma membrane | 77/6293 | 136/18723 | 2.86e-08 | 5.43e-07 | 77 |
| Page: 1 2 3 4 5 6 7 8 9 10 11 12 13 14 15 16 17 18 19 20 21 22 23 24 25 26 27 28 29 30 |
| Pathway ID | Tissue | Disease Stage | Description | Gene Ratio | Bg Ratio | pvalue | p.adjust | qvalue | Count |
| hsa04144 | Colorectum | AD | Endocytosis | 111/2092 | 251/8465 | 5.95e-12 | 1.42e-10 | 9.08e-11 | 111 |
| hsa041441 | Colorectum | AD | Endocytosis | 111/2092 | 251/8465 | 5.95e-12 | 1.42e-10 | 9.08e-11 | 111 |
| hsa041444 | Colorectum | MSS | Endocytosis | 102/1875 | 251/8465 | 1.85e-11 | 4.43e-10 | 2.71e-10 | 102 |
| hsa041445 | Colorectum | MSS | Endocytosis | 102/1875 | 251/8465 | 1.85e-11 | 4.43e-10 | 2.71e-10 | 102 |
| hsa041446 | Colorectum | FAP | Endocytosis | 78/1404 | 251/8465 | 6.20e-09 | 2.96e-07 | 1.80e-07 | 78 |
| hsa041447 | Colorectum | FAP | Endocytosis | 78/1404 | 251/8465 | 6.20e-09 | 2.96e-07 | 1.80e-07 | 78 |
| hsa041448 | Colorectum | CRC | Endocytosis | 65/1091 | 251/8465 | 1.27e-08 | 1.06e-06 | 7.19e-07 | 65 |
| hsa041449 | Colorectum | CRC | Endocytosis | 65/1091 | 251/8465 | 1.27e-08 | 1.06e-06 | 7.19e-07 | 65 |
| hsa0414429 | Esophagus | HGIN | Endocytosis | 76/1383 | 251/8465 | 1.74e-08 | 3.34e-07 | 2.65e-07 | 76 |
| hsa04144113 | Esophagus | HGIN | Endocytosis | 76/1383 | 251/8465 | 1.74e-08 | 3.34e-07 | 2.65e-07 | 76 |
| hsa04144210 | Esophagus | ESCC | Endocytosis | 186/4205 | 251/8465 | 9.74e-16 | 4.66e-14 | 2.39e-14 | 186 |
| hsa0414437 | Esophagus | ESCC | Endocytosis | 186/4205 | 251/8465 | 9.74e-16 | 4.66e-14 | 2.39e-14 | 186 |
| hsa0414412 | Liver | Cirrhotic | Endocytosis | 119/2530 | 251/8465 | 2.33e-09 | 4.56e-08 | 2.81e-08 | 119 |
| hsa0414413 | Liver | Cirrhotic | Endocytosis | 119/2530 | 251/8465 | 2.33e-09 | 4.56e-08 | 2.81e-08 | 119 |
| hsa0414422 | Liver | HCC | Endocytosis | 178/4020 | 251/8465 | 2.03e-14 | 5.22e-13 | 2.91e-13 | 178 |
| hsa0414432 | Liver | HCC | Endocytosis | 178/4020 | 251/8465 | 2.03e-14 | 5.22e-13 | 2.91e-13 | 178 |
| hsa0414427 | Oral cavity | OSCC | Endocytosis | 174/3704 | 251/8465 | 9.42e-17 | 4.51e-15 | 2.29e-15 | 174 |
| hsa04144112 | Oral cavity | OSCC | Endocytosis | 174/3704 | 251/8465 | 9.42e-17 | 4.51e-15 | 2.29e-15 | 174 |
| hsa0414428 | Oral cavity | LP | Endocytosis | 121/2418 | 251/8465 | 1.89e-11 | 3.70e-10 | 2.38e-10 | 121 |
| hsa0414436 | Oral cavity | LP | Endocytosis | 121/2418 | 251/8465 | 1.89e-11 | 3.70e-10 | 2.38e-10 | 121 |
| Page: 1 2 |
Top |
Cell-cell communication analysis |
| Identification of potential cell-cell interactions between two cell types and their ligand-receptor pairs for different disease states |
| Ligand | Receptor | LRpair | Pathway | Tissue | Disease Stage |
| Page: 1 |
Top |
Single-cell gene regulatory network inference analysis |
| Find out the significant the regulons (TFs) and the target genes of each regulon across cell types for different disease states |
| TF | Cell Type | Tissue | Disease Stage | Target Gene | RSS | Regulon Activity |
| ∗The dot plots of a searched regulon are shown for all cell subpopulations in each disease state of each tissue based on the regulon specific score inferred using pySCENIC and by calculating the average expression. |
| Page: 1 |
Top |
Somatic mutation of malignant transformation related genes |
| Annotation of somatic variants for genes involved in malignant transformation |
| Hugo Symbol | Variant Class | Variant Classification | dbSNP RS | HGVSc | HGVSp | HGVSp Short | SWISSPROT | BIOTYPE | SIFT | PolyPhen | Tumor Sample Barcode | Tissue | Histology | Sex | Age | Stage | Therapy Types | Drugs | Outcome |
| VPS35 | SNV | Missense_Mutation | rs868056476 | c.1807N>A | p.Ala603Thr | p.A603T | Q96QK1 | protein_coding | tolerated(0.15) | probably_damaging(0.991) | TCGA-AN-A0AK-01 | Breast | breast invasive carcinoma | Female | >=65 | I/II | Unknown | Unknown | SD |
| VPS35 | SNV | Missense_Mutation | c.2209N>A | p.Ala737Thr | p.A737T | Q96QK1 | protein_coding | tolerated(0.31) | benign(0) | TCGA-BH-A0C1-01 | Breast | breast invasive carcinoma | Female | <65 | III/IV | Chemotherapy | adriamycin | PD | |
| VPS35 | SNV | Missense_Mutation | c.1747N>G | p.Leu583Val | p.L583V | Q96QK1 | protein_coding | deleterious(0) | possibly_damaging(0.894) | TCGA-C8-A12K-01 | Breast | breast invasive carcinoma | Female | >=65 | I/II | Unknown | Unknown | SD | |
| VPS35 | SNV | Missense_Mutation | c.514A>G | p.Thr172Ala | p.T172A | Q96QK1 | protein_coding | tolerated(0.86) | benign(0.001) | TCGA-AA-3710-01 | Colorectum | colon adenocarcinoma | Female | >=65 | I/II | Unknown | Unknown | SD | |
| VPS35 | SNV | Missense_Mutation | novel | c.183G>T | p.Lys61Asn | p.K61N | Q96QK1 | protein_coding | deleterious(0) | probably_damaging(1) | TCGA-CA-6717-01 | Colorectum | colon adenocarcinoma | Male | <65 | I/II | Chemotherapy | oxaliplatin | CR |
| VPS35 | SNV | Missense_Mutation | c.676C>T | p.Arg226Cys | p.R226C | Q96QK1 | protein_coding | deleterious(0) | probably_damaging(1) | TCGA-G4-6588-01 | Colorectum | colon adenocarcinoma | Female | <65 | I/II | Unknown | Unknown | SD | |
| VPS35 | SNV | Missense_Mutation | novel | c.587N>A | p.Arg196Gln | p.R196Q | Q96QK1 | protein_coding | deleterious(0) | probably_damaging(0.947) | TCGA-EI-6917-01 | Colorectum | rectum adenocarcinoma | Male | <65 | III/IV | Chemotherapy | 5fluorouracil+oxaciplatina+l-folinian | SD |
| VPS35 | SNV | Missense_Mutation | c.286N>A | p.Glu96Lys | p.E96K | Q96QK1 | protein_coding | deleterious(0) | probably_damaging(0.98) | TCGA-EI-6917-01 | Colorectum | rectum adenocarcinoma | Male | <65 | III/IV | Chemotherapy | 5fluorouracil+oxaciplatina+l-folinian | SD | |
| VPS35 | SNV | Missense_Mutation | novel | c.1961N>T | p.Ala654Val | p.A654V | Q96QK1 | protein_coding | tolerated(0.09) | possibly_damaging(0.447) | TCGA-A5-A0G2-01 | Endometrium | uterine corpus endometrioid carcinoma | Female | <65 | III/IV | Unknown | Unknown | SD |
| VPS35 | SNV | Missense_Mutation | c.434N>T | p.Arg145Met | p.R145M | Q96QK1 | protein_coding | deleterious(0) | possibly_damaging(0.886) | TCGA-A5-A0G2-01 | Endometrium | uterine corpus endometrioid carcinoma | Female | <65 | III/IV | Unknown | Unknown | SD |
| Page: 1 2 3 4 5 6 7 |
Top |
Related drugs of malignant transformation related genes |
| Identification of chemicals and drugs interact with genes involved in malignant transfromation |
| (DGIdb 4.0) |
| Entrez ID | Symbol | Category | Interaction Types | Drug Claim Name | Drug Name | PMIDs |
| 55737 | VPS35 | ENZYME | MELAGATRAN | MELAGATRAN | 22494098 |
| Page: 1 |

Copyright 2023-Present -The University of Texas Health Science Center at Houston |