| Tissue | Expression Dynamics | Abbreviation |
| Cervix | 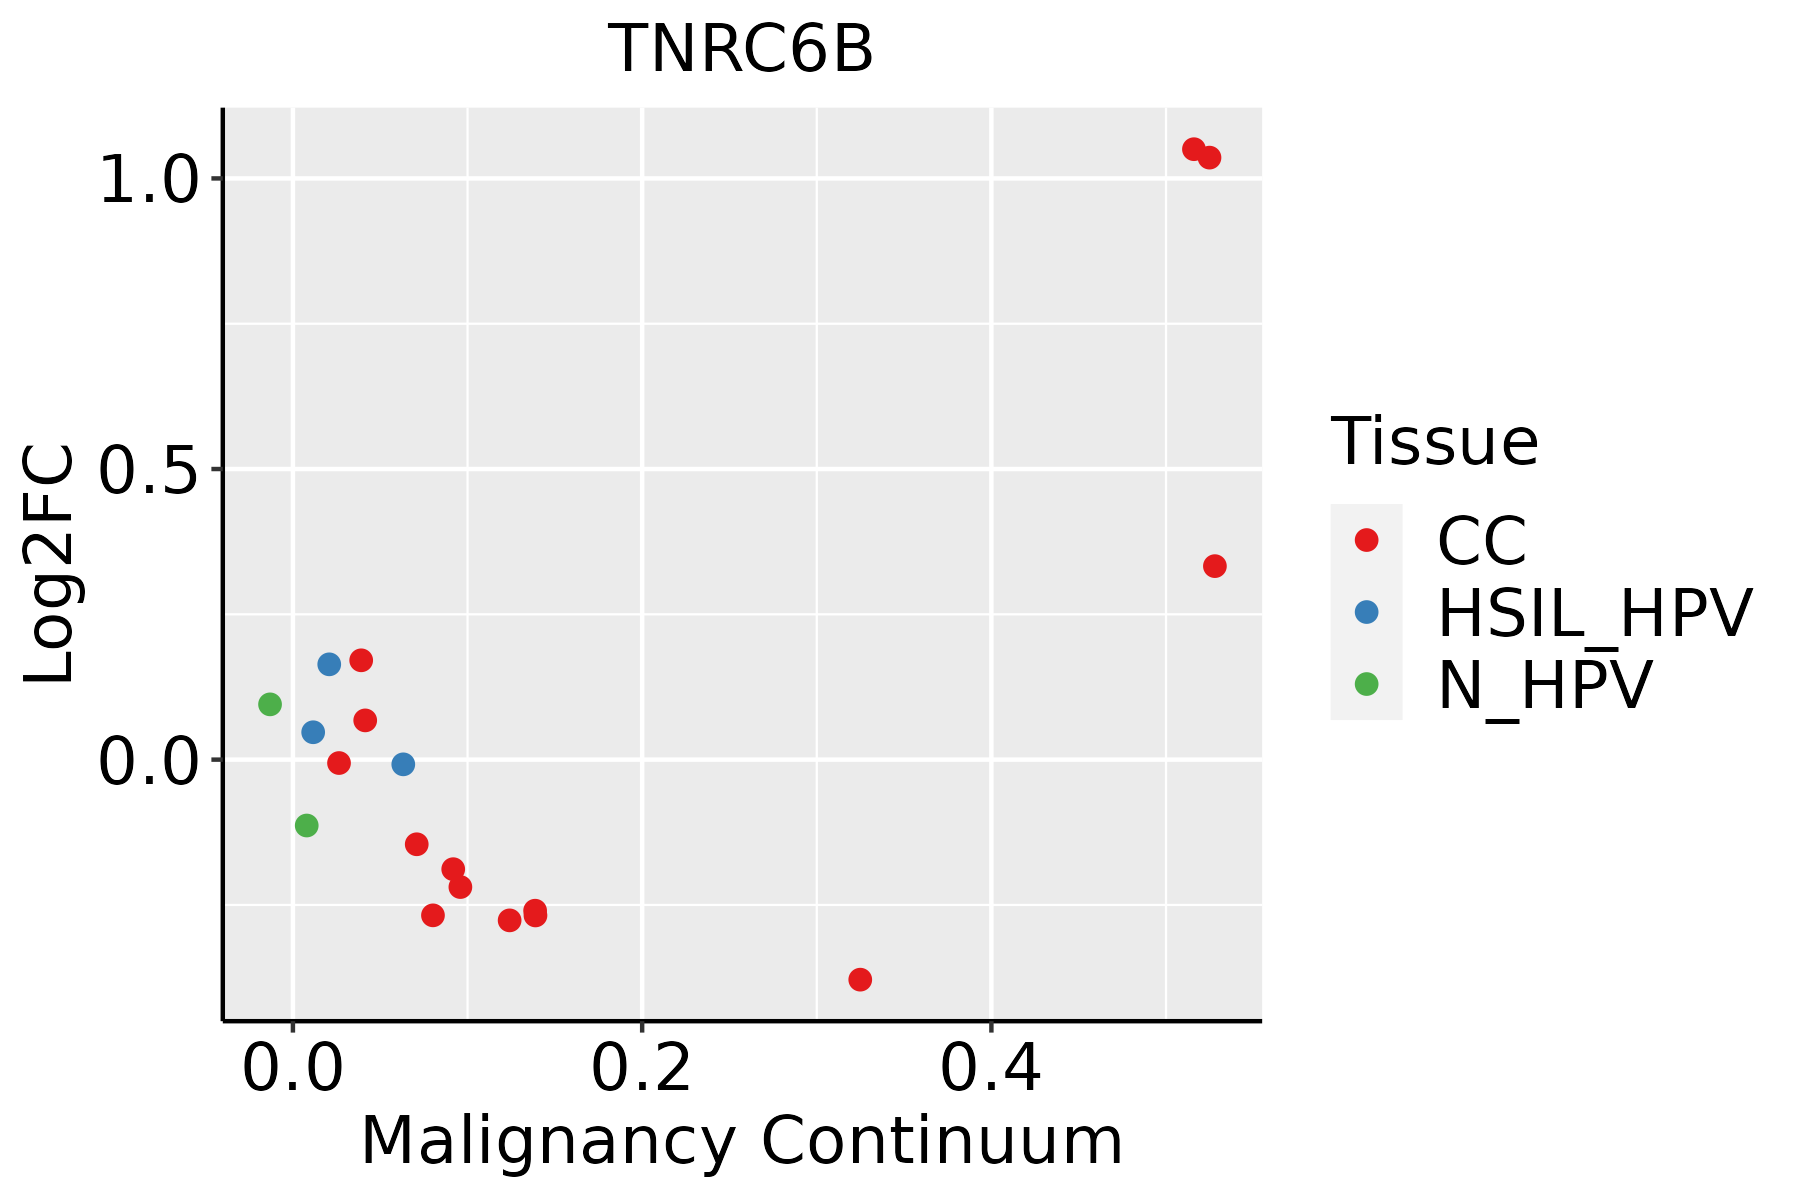 | CC: Cervix cancer |
| HSIL_HPV: HPV-infected high-grade squamous intraepithelial lesions |
| N_HPV: HPV-infected normal cervix |
| Colorectum (GSE201348) |  | FAP: Familial adenomatous polyposis |
| CRC: Colorectal cancer |
| Colorectum (HTA11) |  | AD: Adenomas |
| SER: Sessile serrated lesions |
| MSI-H: Microsatellite-high colorectal cancer |
| MSS: Microsatellite stable colorectal cancer |
| Esophagus | 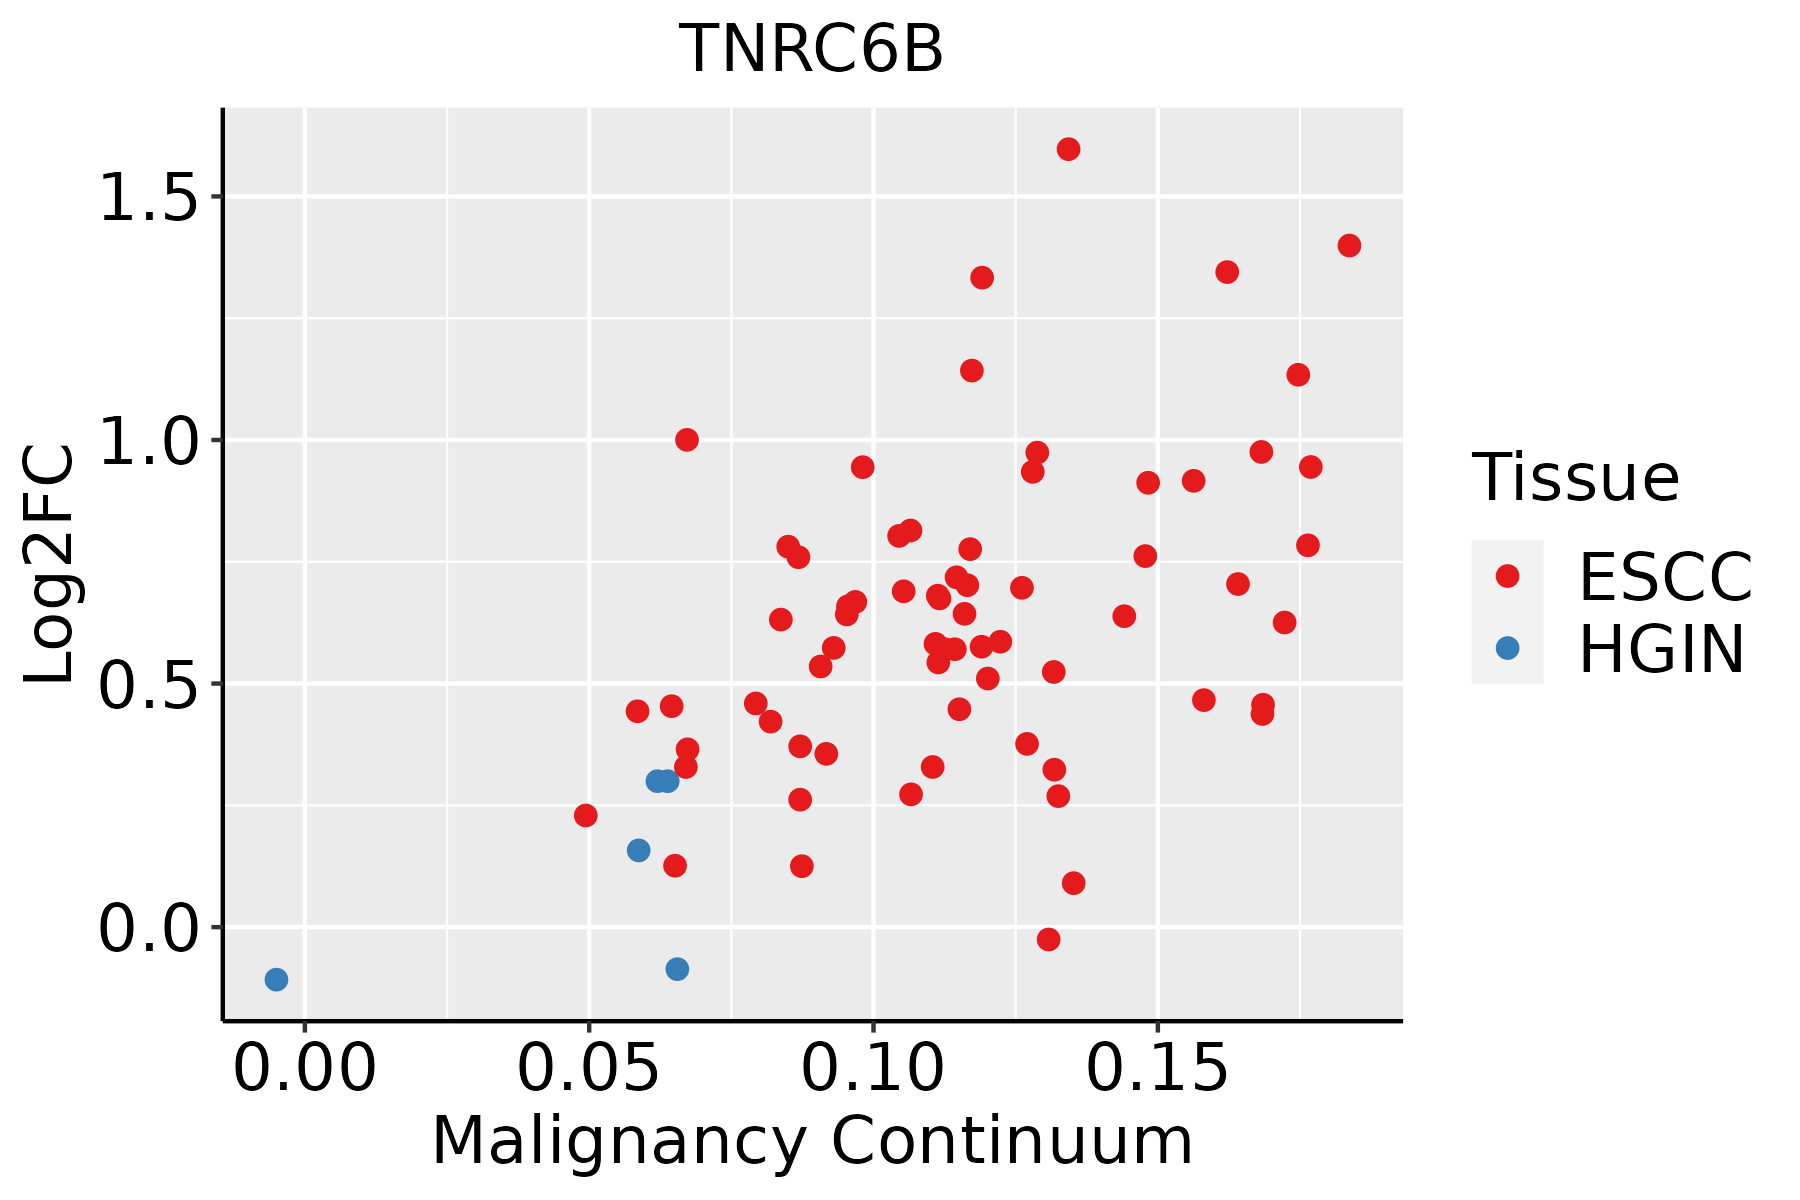 | ESCC: Esophageal squamous cell carcinoma |
| HGIN: High-grade intraepithelial neoplasias |
| LGIN: Low-grade intraepithelial neoplasias |
| Liver | 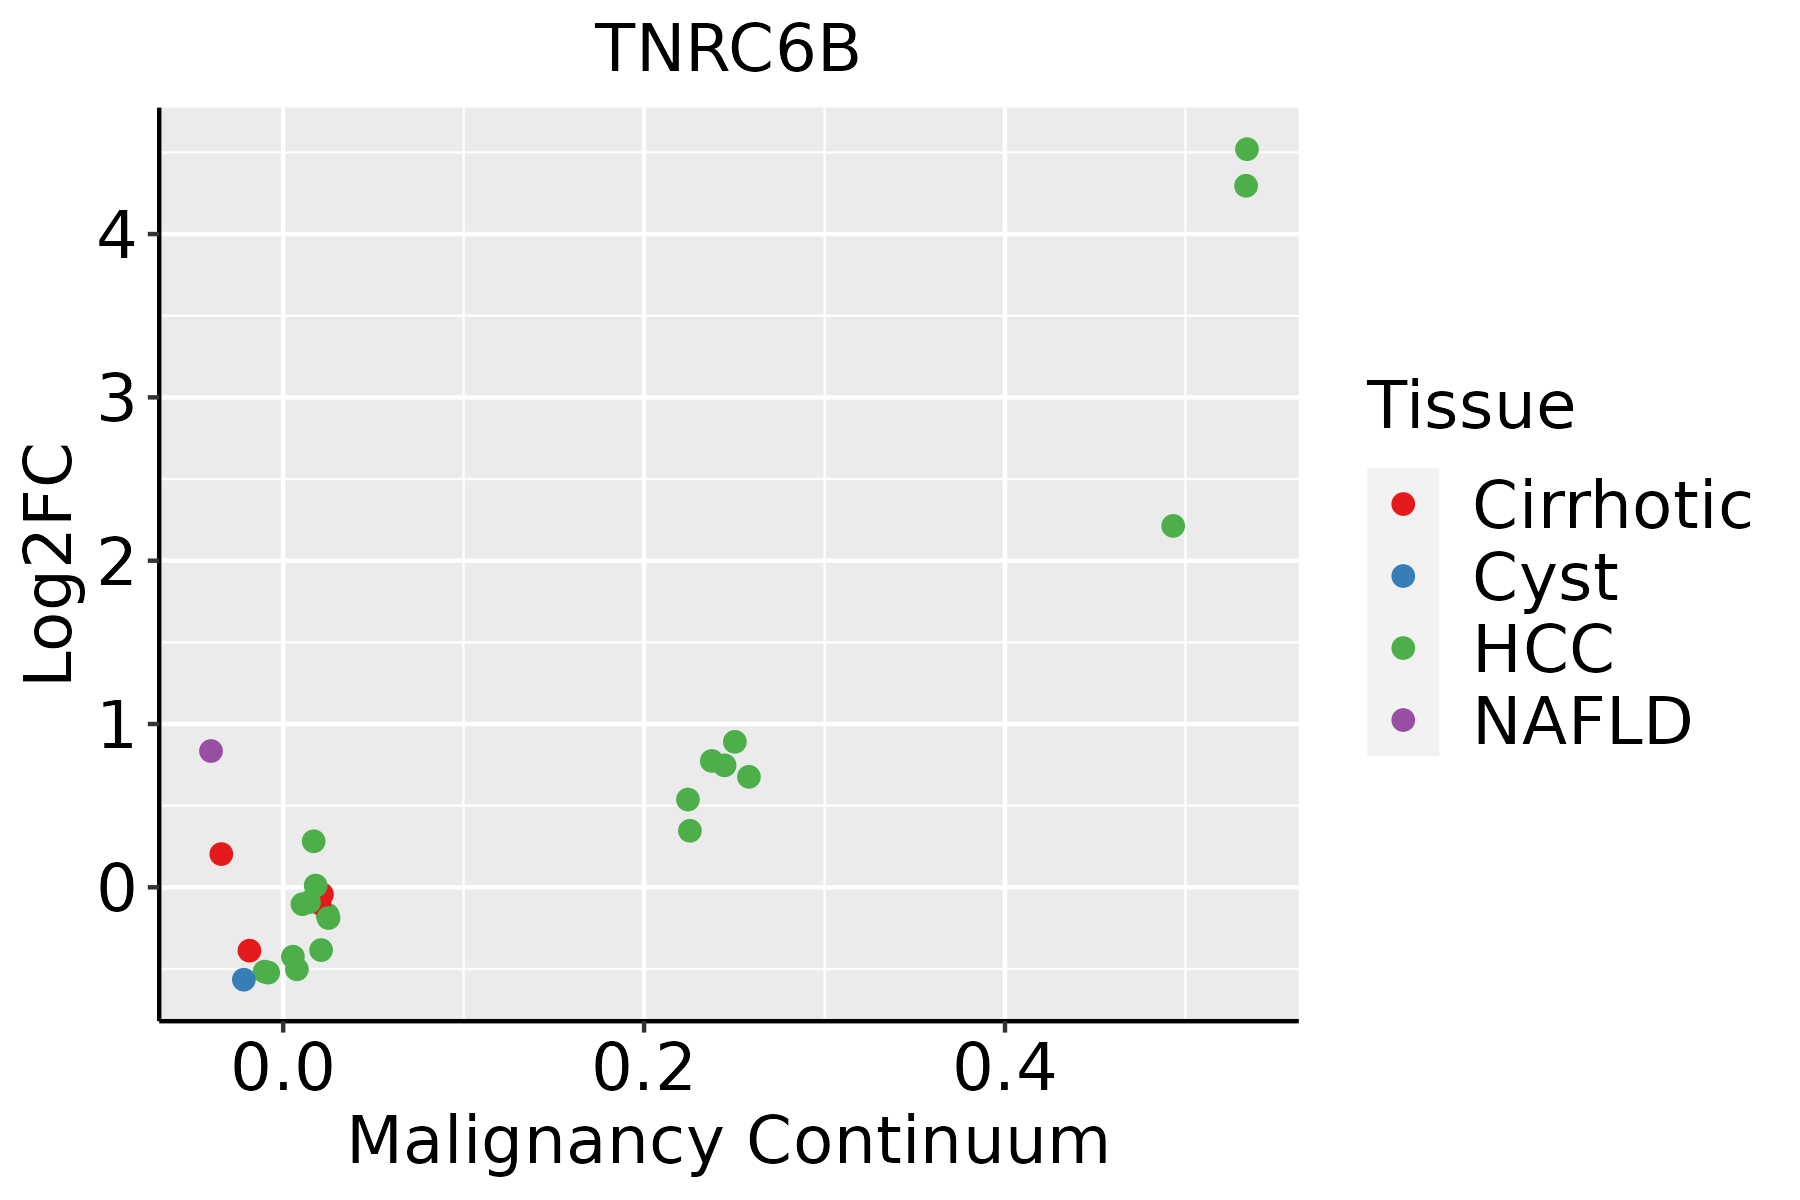 | HCC: Hepatocellular carcinoma |
| NAFLD: Non-alcoholic fatty liver disease |
| Lung | 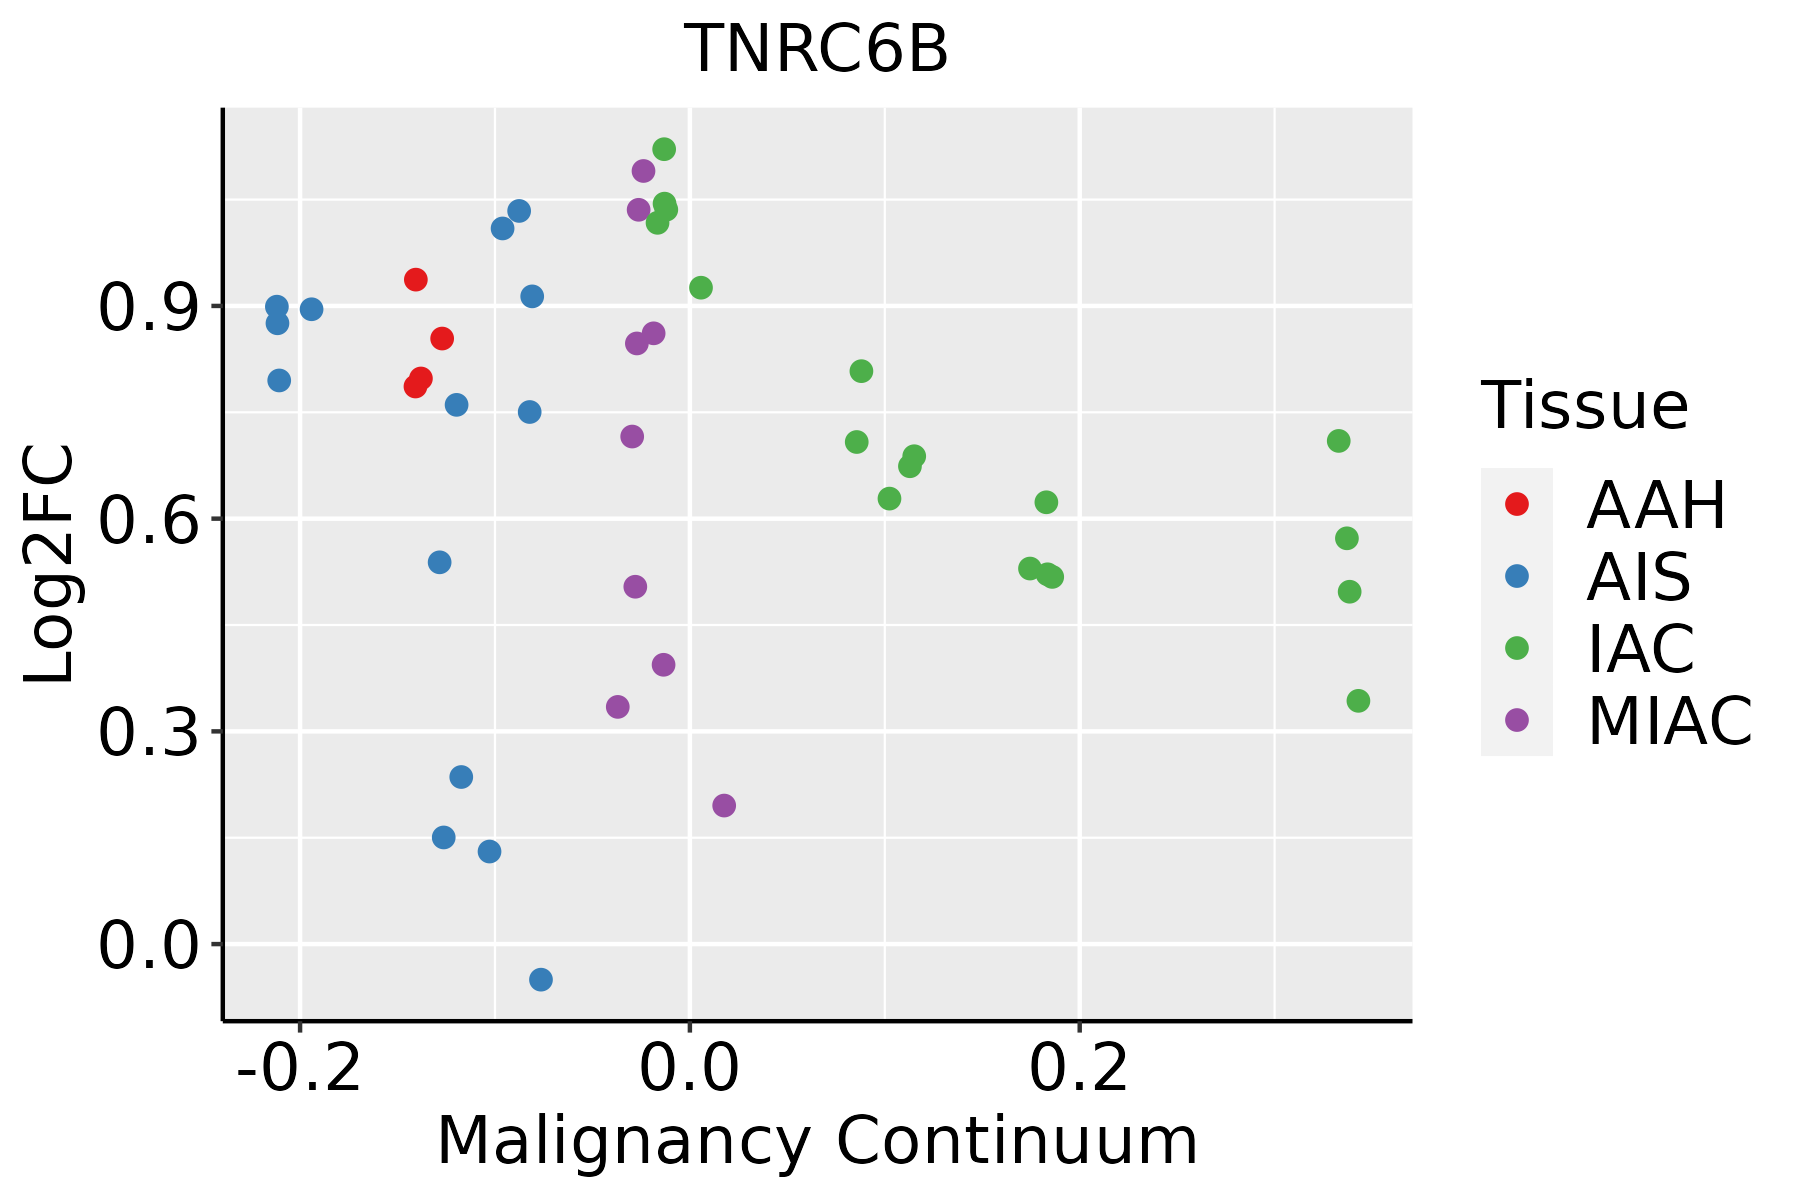 | AAH: Atypical adenomatous hyperplasia |
| AIS: Adenocarcinoma in situ |
| IAC: Invasive lung adenocarcinoma |
| MIA: Minimally invasive adenocarcinoma |
| Oral Cavity | 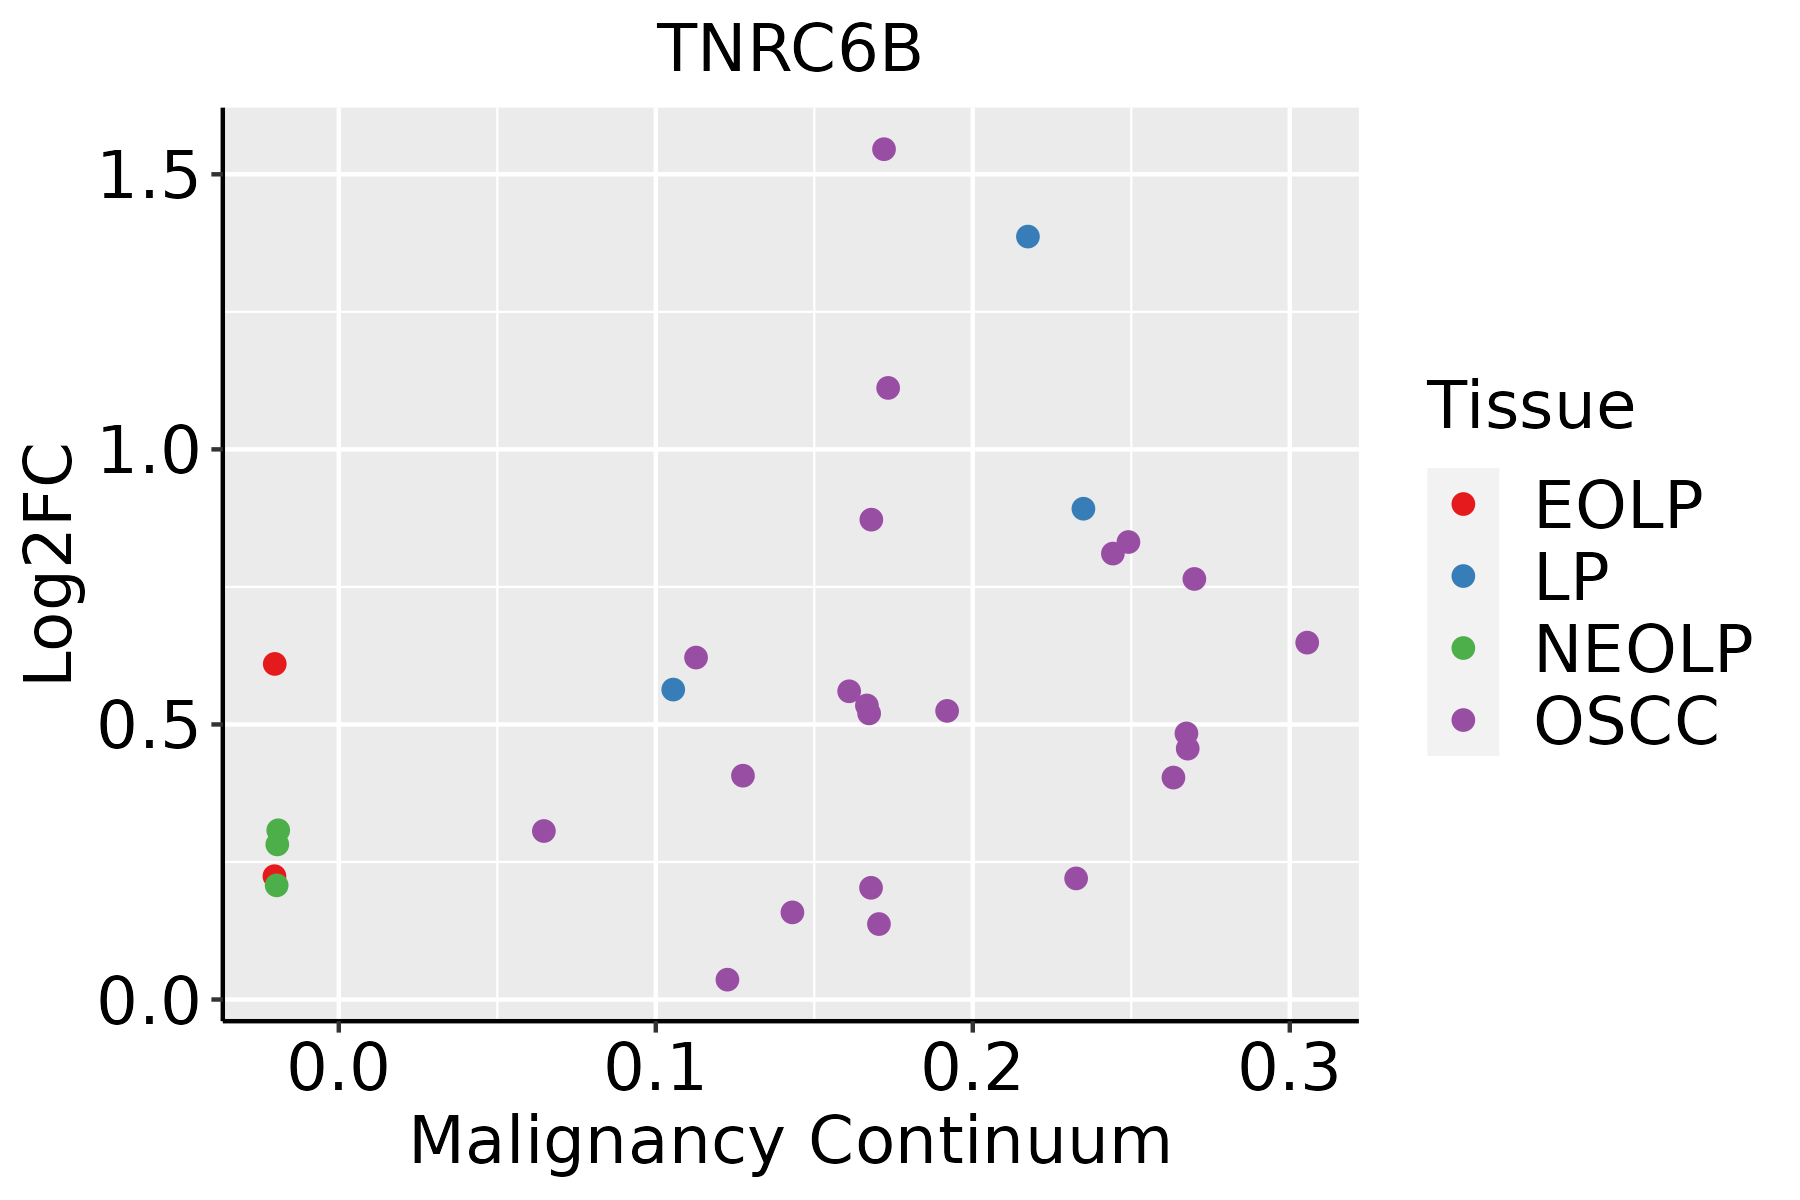 | EOLP: Erosive Oral lichen planus |
| LP: leukoplakia |
| NEOLP: Non-erosive oral lichen planus |
| OSCC: Oral squamous cell carcinoma |
| Prostate | 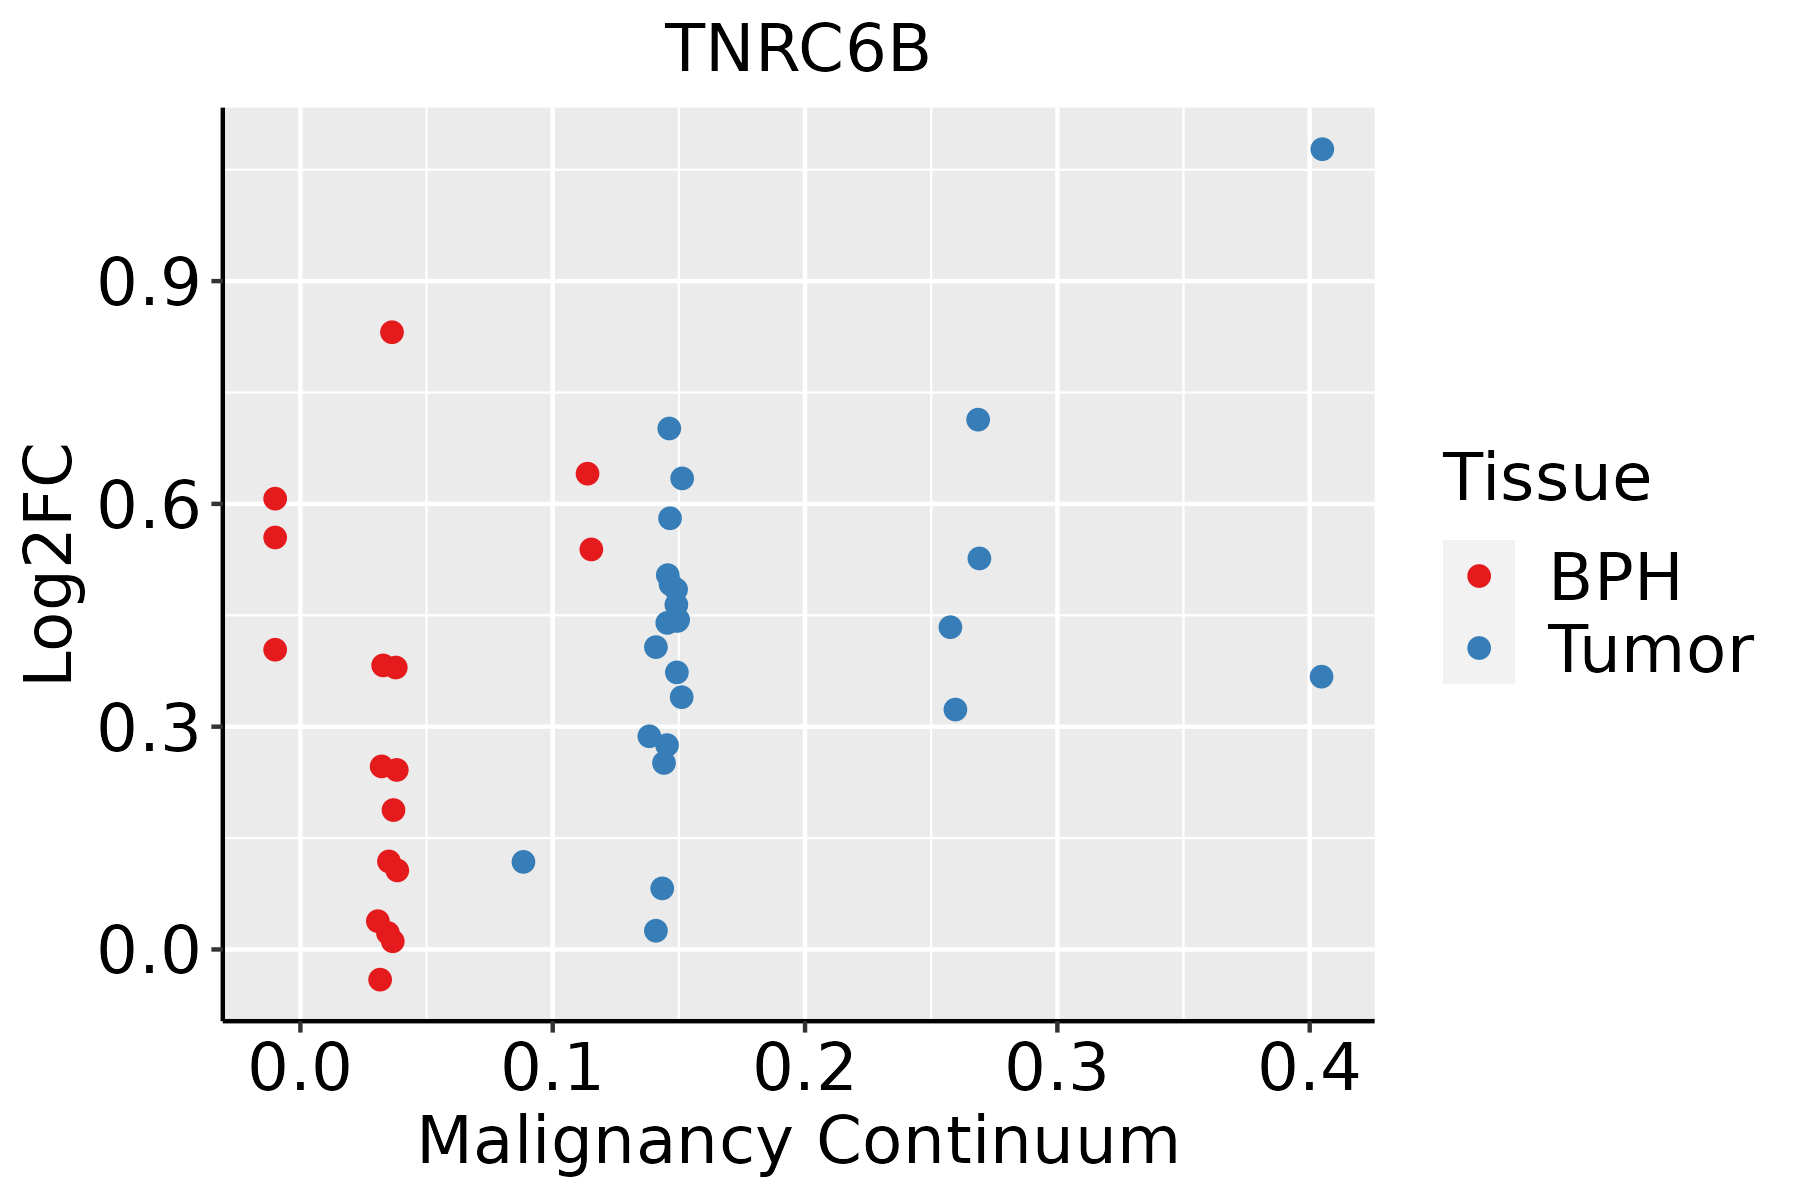 | BPH: Benign Prostatic Hyperplasia |
| Skin |  | AK: Actinic keratosis |
| cSCC: Cutaneous squamous cell carcinoma |
| SCCIS:squamous cell carcinoma in situ |
| Thyroid |  | ATC: Anaplastic thyroid cancer |
| HT: Hashimoto's thyroiditis |
| PTC: Papillary thyroid cancer |
| GO ID | Tissue | Disease Stage | Description | Gene Ratio | Bg Ratio | pvalue | p.adjust | Count |
| GO:00002888 | Prostate | BPH | nuclear-transcribed mRNA catabolic process, deadenylation-dependent decay | 19/3107 | 56/18723 | 1.19e-03 | 7.31e-03 | 19 |
| GO:20006375 | Prostate | BPH | positive regulation of gene silencing by miRNA | 12/3107 | 30/18723 | 1.94e-03 | 1.10e-02 | 12 |
| GO:00601485 | Prostate | BPH | positive regulation of posttranscriptional gene silencing | 12/3107 | 31/18723 | 2.69e-03 | 1.43e-02 | 12 |
| GO:00609684 | Prostate | BPH | regulation of gene silencing | 23/3107 | 81/18723 | 5.35e-03 | 2.49e-02 | 23 |
| GO:000641719 | Prostate | Tumor | regulation of translation | 161/3246 | 468/18723 | 1.55e-19 | 8.74e-17 | 161 |
| GO:190331117 | Prostate | Tumor | regulation of mRNA metabolic process | 111/3246 | 288/18723 | 6.66e-18 | 2.30e-15 | 111 |
| GO:000989619 | Prostate | Tumor | positive regulation of catabolic process | 155/3246 | 492/18723 | 5.62e-15 | 8.52e-13 | 155 |
| GO:000640217 | Prostate | Tumor | mRNA catabolic process | 87/3246 | 232/18723 | 1.56e-13 | 1.73e-11 | 87 |
| GO:003133119 | Prostate | Tumor | positive regulation of cellular catabolic process | 134/3246 | 427/18723 | 5.54e-13 | 5.84e-11 | 134 |
| GO:000640117 | Prostate | Tumor | RNA catabolic process | 94/3246 | 278/18723 | 1.77e-11 | 1.25e-09 | 94 |
| GO:000095615 | Prostate | Tumor | nuclear-transcribed mRNA catabolic process | 46/3246 | 112/18723 | 2.80e-09 | 1.17e-07 | 46 |
| GO:006101315 | Prostate | Tumor | regulation of mRNA catabolic process | 57/3246 | 166/18723 | 8.79e-08 | 2.39e-06 | 57 |
| GO:003465516 | Prostate | Tumor | nucleobase-containing compound catabolic process | 112/3246 | 407/18723 | 1.61e-07 | 4.02e-06 | 112 |
| GO:004348815 | Prostate | Tumor | regulation of mRNA stability | 54/3246 | 158/18723 | 2.26e-07 | 5.42e-06 | 54 |
| GO:003424912 | Prostate | Tumor | negative regulation of cellular amide metabolic process | 80/3246 | 273/18723 | 6.33e-07 | 1.32e-05 | 80 |
| GO:004670014 | Prostate | Tumor | heterocycle catabolic process | 117/3246 | 445/18723 | 1.11e-06 | 2.10e-05 | 117 |
| GO:004427015 | Prostate | Tumor | cellular nitrogen compound catabolic process | 118/3246 | 451/18723 | 1.30e-06 | 2.39e-05 | 118 |
| GO:004348715 | Prostate | Tumor | regulation of RNA stability | 54/3246 | 170/18723 | 3.00e-06 | 4.95e-05 | 54 |
| GO:190331314 | Prostate | Tumor | positive regulation of mRNA metabolic process | 41/3246 | 118/18723 | 3.86e-06 | 6.18e-05 | 41 |
| GO:001714812 | Prostate | Tumor | negative regulation of translation | 71/3246 | 245/18723 | 4.08e-06 | 6.51e-05 | 71 |
| Hugo Symbol | Variant Class | Variant Classification | dbSNP RS | HGVSc | HGVSp | HGVSp Short | SWISSPROT | BIOTYPE | SIFT | PolyPhen | Tumor Sample Barcode | Tissue | Histology | Sex | Age | Stage | Therapy Types | Drugs | Outcome |
| TNRC6B | SNV | Missense_Mutation | | c.4778G>T | p.Arg1593Met | p.R1593M | Q9UPQ9 | protein_coding | deleterious(0) | probably_damaging(0.987) | TCGA-A2-A04P-01 | Breast | breast invasive carcinoma | Female | <65 | III/IV | Chemotherapy | taxol | PD |
| TNRC6B | SNV | Missense_Mutation | | c.872N>T | p.Asp291Val | p.D291V | Q9UPQ9 | protein_coding | deleterious(0.01) | possibly_damaging(0.522) | TCGA-A2-A04U-01 | Breast | breast invasive carcinoma | Female | <65 | I/II | Chemotherapy | adriamycin | SD |
| TNRC6B | SNV | Missense_Mutation | | c.1277N>T | p.Gly426Val | p.G426V | Q9UPQ9 | protein_coding | deleterious(0) | probably_damaging(0.997) | TCGA-A2-A0YC-01 | Breast | breast invasive carcinoma | Female | <65 | I/II | Hormone Therapy | arimidex | PD |
| TNRC6B | SNV | Missense_Mutation | | c.4130N>T | p.Ser1377Phe | p.S1377F | Q9UPQ9 | protein_coding | tolerated(0.48) | probably_damaging(0.988) | TCGA-A7-A26H-01 | Breast | breast invasive carcinoma | Female | >=65 | I/II | Hormone Therapy | anastrozole | PD |
| TNRC6B | SNV | Missense_Mutation | novel | c.4237N>A | p.Glu1413Lys | p.E1413K | Q9UPQ9 | protein_coding | deleterious(0) | benign(0.036) | TCGA-A8-A096-01 | Breast | breast invasive carcinoma | Female | >=65 | I/II | Unknown | Unknown | SD |
| TNRC6B | SNV | Missense_Mutation | rs772135186 | c.1769N>A | p.Arg590His | p.R590H | Q9UPQ9 | protein_coding | deleterious(0.05) | probably_damaging(0.984) | TCGA-AN-A0XU-01 | Breast | breast invasive carcinoma | Female | <65 | I/II | Unknown | Unknown | SD |
| TNRC6B | SNV | Missense_Mutation | rs267606255 | c.79N>A | p.Glu27Lys | p.E27K | Q9UPQ9 | protein_coding | tolerated(0.14) | benign(0.015) | TCGA-B6-A0I5-01 | Breast | breast invasive carcinoma | Female | <65 | I/II | Unknown | Unknown | SD |
| TNRC6B | SNV | Missense_Mutation | rs267606255 | c.79N>A | p.Glu27Lys | p.E27K | Q9UPQ9 | protein_coding | tolerated(0.14) | benign(0.015) | TCGA-B6-A1KI-01 | Breast | breast invasive carcinoma | Female | <65 | I/II | Unknown | Unknown | SD |
| TNRC6B | SNV | Missense_Mutation | | c.769N>A | p.Gly257Arg | p.G257R | Q9UPQ9 | protein_coding | deleterious(0.03) | probably_damaging(0.998) | TCGA-BH-A0HF-01 | Breast | breast invasive carcinoma | Female | >=65 | I/II | Hormone Therapy | arimidex | SD |
| TNRC6B | SNV | Missense_Mutation | rs778520882 | c.5N>A | p.Arg2Lys | p.R2K | Q9UPQ9 | protein_coding | tolerated_low_confidence(0.08) | benign(0.267) | TCGA-C8-A8HQ-01 | Breast | breast invasive carcinoma | Female | <65 | I/II | Unknown | Unknown | SD |


